Int. J. Electrochem. Sci., 9 (2014) 1892 - 1901
International Journal of
ELECTROCHEMICAL
SCIENCE
www.electrochemsci.orgFractional Diffusion Equations and Equivalent Circuits Applied
to Ionic Solutions
F. R. G. B. Silva1, H. V. Ribeiro1, M. K. Lenzi2, T. Petrucci1, F. S. Michels1 and E. K. Lenzi1,*
1Departamento de Física, Universidade Estadual de Maringá, Avenida Colombo 5790, 87020-900 Maringá, Paraná, Brazil.
2Departamento de Engenharia Química, Universidade Federal do Paraná, Setor de Tecnologia - Jardim das Américas, Caixa Postal 19011, 81531-990, Curitiba, Paraná, Brazil.
*
E-mail: [email protected]
Received: 10 December 2013 / Accepted: 29 December 2013 / Published: 2 February 2014
We investigate dilute solutions of different salts (KClO3, K2SO4, and CdCl2H2O) dissolved in Milli-Q deionized water in the context of the fractional diffusion equations and equivalent circuits. The experimental results show that in the low frequency limit the behavior of the impedance is suitable described in terms of the boundary conditons which can be connected to constant phase elements (CPE). In addition, they also indicate that salts with similar characteristics, such as the ionic potential for the negative ion, present essentially the same frequency dependence of the impedance in the low frequency limit.
Keywords: electrical response, anomalous diffusion, fractional calculus
1. INTRODUCTION
dependence for the mean square displacement, e.g.,
x x
2 t. This nonlinear behavior is often a consequence of the presence of memory effects [10,11], long-range correlations and long-range interactions [12-14] or surface effects [15-18]. The last aspect plays an important role in the electrochemistry context, particularly in the low frequency limit where the system may present an anomalous electrical response, i.e., Z ~1
i with0 1. In this sense, the fractional approach applied to anomalous diffusion [19] with suitable boundary conditions [20-23] has been used to investigate the electrical response of an experimental scenario when the stationary state is considered. Another approach frequently used to analyze the electrical response of materials is based on equivalent circuits and, an important extension used in this framework is the CPE, whose presence can be linked to the necessity of describing unusual effects in many solid electrode/electrolyte interfaces. In addition, these two approaches can be connected in the low frequency limit as discussed in Ref. [24].The aim of this work is to investigate, by using the fractional approach and equivalent circuits, the electrical response obtained from ionic solutions of KClO3, K2SO4 and CdCl2H2O dissolved in Milli-Q deionized water and also to relate the results with the properties of these ions. In particular, the agreement between the prediction and the experimental data suggests that the formalism essentially based on the Debye relaxation has to be modified in order to incorporate the behavior exhibited by the experimental data in all frequency range. Furthermore, the results presented for these salts also indicate the role of the ionic radius and potential on the behavior of the electrical response in the low frequency limit. These developments are performed in the Sec. 2 and Sec. 3. Sec. 4 is devoted to our discussions and in Sec. 5 the conclusions are presented.
2. FRACTIONAL DIFFUSION AND EQUIVALENT CIRCUIT
Let us start our discussion by presenting the approach used here to investigate the electrical response of the ionic solutions obtained from the salts previously mentioned. It is based on the fractional diffusion equation and its connection with equivalent circuits with CPE elements. In this regard, it is interesting to mention that, the presence of these elements depend on the boundary conditions requeired by the system, i.e., the surface effects.
The approach considers the densities of the ions
n
(α = + for positive and α = for negative) governed by the fractional diffusion equation of distributed order) ( )
( )
( 1
0 τ tγ nα z,t z Jα z,t γ
γ γ d
(1) with) , ( ) ( )
( )
( z t
z t z, n D t z, n z D t z,
J V
T k q
B
(2)
, ' ' , '
2 ' 2
t a
d d
t dt t t t
t
J n . (3) Note the that the integro-differential form of Eq.(3) has as particular case several situations and the choice of the
a
t depends on the physical system to be investigated (see, for example, the casesconsidered in Refs. [16, 25 – 27]). For the above set of equations, it is possible to find an analytical solution of the linear approximation for the steady state (A. C. small-signal limit) and, consequently, to obtain an analytical expression for the electrical impedance. In this limit, we consider
) ( )
(z,t n z,t
n Nδ with Nδn(z,t), where N represents the number of ions per unit of volume. This result allows us to search for solutions in the form δn(z,t)(z)eit and V(z,t)(z)eit in order to analyze the impedance when the electrolytic cell is subject to a time-dependent potential
i t e V t dV 2, 0 2 since the steady-state is reached. After some calculations, it is possible to show that the impedance, for the case discussed here, is given by
2
2 2 2
2 tanh( 2) ( ) / (2 )
1 a( )(1 / ) tanh( / 2) / ( )
d d D
i i i D d
E Z
S (4)
where S is the electrode area, is the Debye´s screening length, E
i
i
a
i tanh
d/ 2
in which
1
0
) ( )
(i d i ,and
2(i
) D1
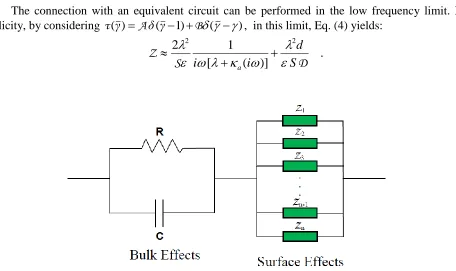
2.The connection with an equivalent circuit can be performed in the low frequency limit. For simplicity, by considering τ(γ)Aδ(γ1)B( ), in this limit, Eq. (4) yields:
. )]
( [
1
2 2 2
D S
Z
S d i
i a
[image:3.596.75.531.419.690.2] (5)
By comparing the impedance given by Eq. (5) and the one obtained by considering the circuit of Fig. 1, we obtain:
)] ( [ 1 2 2
i i S aS
Z (6)
where
n i
s Z
Z 1
[image:4.596.83.548.301.500.2]1 and R = λ2d/(εSD) is related with bulk effect, i.e., the first part of the circuit of Fig. 1. By using Eq. (6), it is possible to establish a connection between surface effects represented by
) (
a i and the circuit elements or association ZS. Consequently, for each
a(i
) it is possible to search for a simple circuit or an association of circuit elements with the same or equivalent behavior for the impedance, when the low frequency limit is considered. Physical processes related to different surface effects and, consequently, to different elements contributing for Zs may be considered by means of de suitable choice of
a(i
). Specifically, a relationship between CPE and the boundary conditions used in the model described above can be established by rewriting Zs as:) ( 2
2 1
2
i i S i S a S Z . (10)
By performing the choice
ζn n n n a ζ a ζ a
a
(
i
)
,1
1/(
i
1)
1
,2
2(
i
2)
2
,
(
i
)
, (11)we have that
n n n ζ n n n a ζ n n n a ζ a ζ a S i S i S i S i S i S Z Z Z Z Z Z 1/ 1 , 1/ 1 1 1 1 , / 1 1 2 2 2 , / 1 1 1 1 1 , / 1 ) ( 2 ) ( 2 ) ( 2 ) ( 2 2 1 1 -n 1 3 2 2 1 1 (12)
which represents the association illustrated in Fig. 1 whose elements correspond to a capacitive element (Z1) and n CPE (Z2, Z3, …, Zn), i.e., Z1 = 1/(iωC1), with C1 = εS/(2λ), and 1/[( ) 2]
1
2 i 1C
ζ
Z ,
with C2 ,1 11 ζ1/ C1 a
and Z3 1/[(i
)1ζ2C3], with1 1
2 2 ,
3 2/ C
C a ζ , and so on. Another choices to
a(i
) are also possible, leading us to different equivalent circuits. In particular, the case) 1 ( )
(
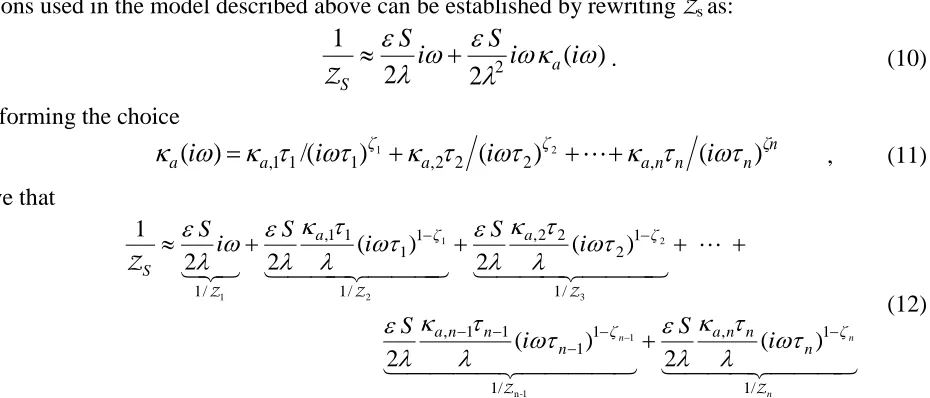
a i i is connected to an adsorption – desorption process governed by a first order kinetic equation playing an important role in several scenarios (see Refs. [25], [26], and [27]). This choice leads us to
i
S
i
S
S1
1
2
2
1
2Z
Figure 2. This figure represents the association connected to the choicea(i) (1i) for the part related to the surface terms of the circuit illustrated in Fig. 1.
with C1 = εS/(2λ), C2εS (2λ2) , and R2 22 (S). Thus, we observe that different choices for )
(
a i may be connected to different surface effects and consequently, to different equivalent circuits.3. EXPERIMENTAL DATA AND MODELS
In this section, we compare the experimental data obtained by means of impedance spectroscopy technique of the electrical response of electrolytic cells of salts KClO3, K2SO4 and CdCl2H2O dissolved in Milli-Q deionized water, with the theoretical results obtained from the model presented in the previous section. Further details description of the experimental procedure can be found in Ref. [22]. In addition, the concentration used for these salts were 1.12×10⁻⁴ mol/L, 1.14×10⁻⁴ mol/L and, consequently, 1.10×10⁻⁴
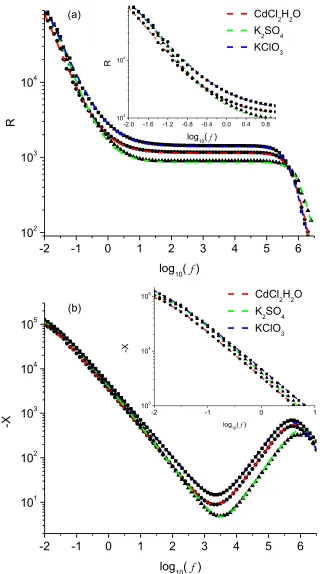
mol/L. The Figs. 3a and 3b show a comparison between the experimental data, black symbols, and the values predicted by the model (colorful lines), for the real and imaginary parts of impedance as a function of the frequency, respectively. As one can see, for the frequency range shown in these figures, there is a good agreement between experimental and predicted values when Eq. (4) is used, with τ(γ)Aδ(γ1)B( ) and the first two terms of Eq. (12), i.e.,
1 2
,1 1 1 ,2 2 2
( ) / ( )ζ ( )ζ
a i a i a i
[image:5.596.223.371.72.181.2]
-2 -1 0 1 2 3 4 5 6
102
103
104
CdCl2H2O K2SO4
KClO3
R
log10( f )
(a)
-2.0 -1.6 -1.2 -0.8 -0.4 0.0 0.4 0.8 103
104
10
R
log10( f )
-2 -1 0 1 2 3 4 5 6
101
102
103
104
105
CdCl2H2O K2SO4 KClO3
-X
log10( f )
(b)
-2 -1 0 1
103
104
105
-X
[image:6.596.138.458.65.639.2]log10( f )
Figure 3. Real and imaginary parts of impedance as a function of frequency. The black dots (square, circle and triangle) represent the experimental data obtained by the impedance spectroscopy technique, while the colorful lines (blue, red and green) represent the values predicted by the model. The parameter values obtained by fitting the experimental data are given in Table 1 with DKClO3 =1.14 DKSO4= 1.62 DCdCl2H2O, DCdCl2H2O = 3.05 × 10⁻⁹ m2/s, d = 10-3m and S = 3.14×10⁻⁴
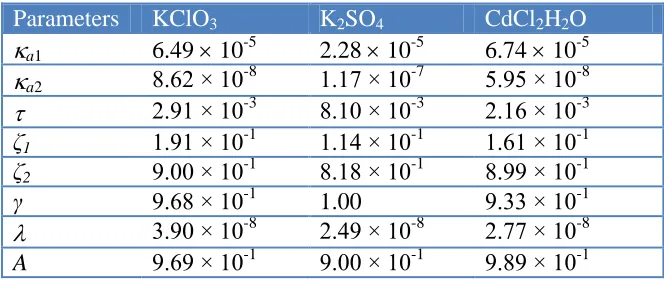
The parameters values estimated using the model, that lead to the best agreement with the experimental data, are shown in Table 1. The fit was obtained by using the particle swarm optimization method (see Refs. [28] and [29]), where the real and imaginary part of impedance are simultaneous adjusted with the experimental data in order to obtain the best set of parameters which minimize the 2
[image:7.596.132.464.285.427.2]. For this case, the value of R2 (see Refs. [30] and [31]) points out that, in all the cases, the model account for about 99.9% of the observed variance in the experimental data. We can observe in Table 1 that
a1
1>
a2
2 ( may represent an intrinsic thickness related to the surface effect on the ions) for the three ionic solutions presented here, implying that the characteristic length
a2
2 is closer to the surface of electrode than
a1
1.Table 1. Best fit parameters values in SI units.
Parameters KClO3 K2SO4 CdCl2H2O
a1 6.49 10-5 2.28 10-5 6.74 10-5
a2 8.62 × 10
-8 1.17 × 10⁻⁷ 5.95 × 10⁻⁸
2.91 × 10⁻³ 8.10 × 10⁻³ 2.16 × 10⁻³
ζ1 1.91 × 10⁻¹ 1.14 × 10⁻¹ 1.61 × 10⁻¹ ζ2 9.00 × 10⁻¹ 8.18 × 10⁻¹ 8.99 × 10⁻¹
γ 9.68 × 10⁻¹
1.00 9.33 × 10⁻¹
3.90 × 10⁻⁸ 2.49 × 10⁻⁸ 2.77 × 10⁻⁸
A 9.69 × 10⁻¹ 9.00 × 10⁻¹ 9.89 × 10⁻¹
In Table 2, we show how these parameters, related to surface effects, influence the capacitance of these layers near to surface of electrode, making it C2 > C3. The connection with an equivalent circuit implies in two different CPE elements governing the behavior of the system in the low frequency regime.
Table 2. Electric quantities obtained from the equivalence between circuits, Fig.1, and the fractional diffusion equation.
In this point, it is interesting to mention that the behavior obtained for the impedance, i.e.,
) /( 1
~ i
Z with 0 1, resembles the ones discussed in Refs. [32] and [33] for semiconductor materials from the trapping mechanisms. For the ionic solutions of KClO3 and CdCl2H2O, the value of C2 and C3 are very close, meaning that the behavior of the layers in the neighborhood of the electrodes in these two cases is essentially the same. This feature may be related, observing the Table 3, to the
KClO3 K2SO4 CdCl2H2O
C1 = S/2 3.18 × 10
5 3.81 × 10⁵ 4.53 × 10⁵ C2 = ((S/2)a,11/)1-ζ1 1.36 × 10
4 3.98 × 10⁴ 1.38 × 10⁴ C3 = ((S/2)a,22/)1-ζ2 1.14 × 10
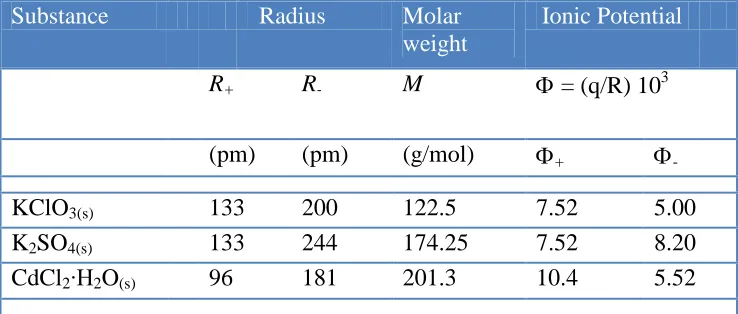
fact that these two salts dissolved in water exhibit similar characteristics in respect to ionic radius and also the ionic potential for the negative ions, i.e., R-and - . However, the values obtained for KClO3 and CdCl2H2O differ significantly from the values obtained for K2SO4 as well as the data presented in the Table 1.
[image:8.596.95.506.171.357.2]
Figure 4. These figures (A and B) give a qualitative illustration of the combination of the ions ClO3 1-and SO42- (obtained from the salts KClO3 and K2SO4) with the water molecules.
This difference in behavior exhibited for the K2SO4, compared to KClO3 and CdCl2H2O may be related to differences in the combination of ions with water molecules (see, Fig. 4) and their response to applied potential where the ionic radius and also the ionic potential seems to play an important role. In addition, the predict values of the constant for KClO3 and CdCl2H2O (80.07 and 79.24, respectively) are very close, however, differ significantly from the value obtained for the K2SO4 ( = 60.56).
Table 3. Some properties of the species: KClO3(s); K2SO4(s); CdCl2∙H2O(s) in solid state and water solution of 0.200g/100 mL.
Substance Radius Molar
weight
Ionic Potential
R+ R- M = (q/R) 103
(pm) (pm) (g/mol) + -
KClO3(s) 133 200 122.5 7.52 5.00 K2SO4(s) 133 244 174.25 7.52 8.20
[image:8.596.114.483.604.761.2]
4. DISCUSSIONS
The agreement between the experimental data and the models discussed here indicates the presence of processes which are not suitable described in all frequency range in terms of the approaches only based on the usual diffusion equation with standard boundary conditions or equivalent circuits with a simple association of resistive and capacitive elements. Using the equivalent circuit illustrated in Fig.1, we have observed that the salts KClO3 and CdCl2H2O have presented similar values for C2 and C3 and different from the ones obtained for K2SO4 as show in Tab. 2. This feature may be connected to the radius R- and to the ionic potential - which is smaller for these anions, chlorate (ClO3-) and chloride (Cl-) of the salts KClO3 and CdCl2H2O. Thus, the electrical response for the situations analyzed here seems to indicate that characteristics of the negative ions, when Table 2 is compared with Table 3, in the low frequency limit have a relevant influence on the dynamic of the system. This point may also be observed from the inset present in Figs. 3a and 3b which shows that the red and the blue dotted lines are essentially parallels in the low frequency limit. Note that the imaginary part of the impedance in this limit may be connected to the surface effects, i.e., with boundary conditions or the capacitive elements (C1, C2, C3) present in Fig. 1.
5. CONCLUSIONS
We have investigated by using the phenomenological models presented in Sec. 2 the experimental data obtained by means impedance spectroscopy technique for the electrical response of electrolytic cells of salts KClO3, K2SO4 and CdCl2H2O dissolved in Milli-Q deionized water. The results obtained for these salts indicate the presence of processes which deserve special attention and are not suitable described in all frequency range in terms of the approaches based on the usual diffusion equation with standard boundary conditions or equivalent circuits with a simple association of resistive and capacitive elements as discussed previously. Another interesting feature which emerges by using approaches discussed in Sec. 2 and observing the numerical values presented in Tables 2 and 3 is the effect of the negative ion on the electrical response. Finally, we hope that the framework presented here based on fractional approach and their connection with equivalent circuits can be useful to investigate the electrical response of other systems.
ACKNOWLEDGEMENT
We thank CNPq, CAPES, and Fundação Araucária.
References
1. R. Metzler, G. Glöckle and T. F. Nonnenmacher, Phys. A, 13 (1994) 211.
2. D. S. F. Crothers, D. Holland, Y. P. Kalmykov and W. T. Coffey, J. Mol. Liq, 114 (2007) 27. 3. R. Hilfer, Applications of Fractional Calculus in Physics, Singapore, World Scientific, (2000). 4. M. Muskat, The Flow of Homogeneous Fluid Through Porous Media, New York, MacGraw Hill,
5. V. Plerou, P. Gopikrishnan, L. A. N. Amaral, X. Gabaix and H. E. Stanley, Phys. Rev. E, 62 (2000) 3023.
6. Iomim, A., Phys. Rev. E, 73 (2006) 061918.
7. A. Ott, J. P. Bouchaud, D. Langevin and W. Urbach, Phys. Rev. Lett., 65 (1990) 2201. 8. A. Mertelj, L. Cmok and M. Copic, Phys. Rev. E, 79 (2009) 041402.
9. R. Golestanian, Phys. Rev. Lett., 102 (2009) 188305.
10.L. R. Evangelista, E. K. Lenzi, G. Barbero and J. R. Macdonald, J. Phys: Condens. Matter, 23 (2011) 485005.
11.J. Bisquert and A. Compte, J. Electroanal. Chem., 499 (2001) 112.
12.J. Bisquert, G. Garcia-Belmonte and A. Pitarch,, Chem. Phys. Chem., 4 (2003) 287. 13.J. Bisquert, Phys. Rev. Lett., 91 (2003) 010602.
14.J. Bisquert, Phys. Rev. E, 72 (2005) 0111009.
15.E. K. Lenzi, L. R. Evangelista and G. Barbero, J. Phys. Chem. B, 113 (2009) 11371.
16.P. A. Santoro, J. L. de Paula, E. K. Lenzi and L. R. Evangelista, J. Chem. Phys., 135 (2011) 114704.
17.M. A. Abakarov, M. A. Giraev and O. M. Shabanov, Russ. J. Electrochem., 41 (2005) 1017. 18.A. G. Anastopoulos and A. I. Bozatzidis, Russ. J. Electrochem, 47 (2011) 53.
19.R. Metzler and J. Klafter, Phys. Rep., 339 (2000) 1.
20.E. K. Lenzi, P. R. G. Fernandes, T. Petrucci, H. Mukai and H. V. Ribeiro, Phys. Rev. E, 84 (2011) 041128.
21.F. Ciuchi, A. Mazzulla, N. Scaramuzza, E. K. Lenzi and L. R. Evangelista, J. Phys. Chem. C, 116 (2012) 8773.
22.E. K. Lenzi, P. R. G. Fernandes, T. Petrucci, H. Mukai, H. V. Ribeiro, M. K. Lenzi and G. Gonçalves, Int. J. Electrochem. Sci., 8 (2013) 2849.
23.E. K. Lenzi, M. K. Lenzi, F. R. G. B. Silva, G. Gonçalves, R. Rossato, R. S. Zola and L. R. Evangelista, J. Electroanal. Chem., 712 (2014) 82.
24.E. K. Lenzi, J. L. Paula, F. R. G. B. Silva and L. R. Evangelista, J. Phys. Chem. C, 117 (2013) 23685.
25.G. Barbero and M. Scalerandi, J. Chem. Phys., 136 (2012) 084705. 26.G. Barbero, Phys. Rev. E, 71 (2005) 062201.
27.G. Barbero and L. R. Evangelista, Adsorption Phenomena and Anchoring Energy in Nematic Liquid Crystals, London, Taylor & Francis (2006).
28.J. Kennedy and R. C. Eberhart, Proceedings of IEEE International Conference on Neural Networks IV, Perth, IEEE Press, (1995).
29.Y. Shi and R. C. Eberhart, Proceedings of IEEE International Conference on Evolutionary Computation, Piscataway, IEEE Press (1998).
30.R. G. D. Steel and J. H. Torrie, Principles and Procedures of Statistics with Special Reference to the Biological Sciences, New York, McGraw Hill (1960).
31.S. Licodeidoff, R. H. Ribani, A. M. O. Camlofski and M. K. Lenzi, Braz. Arch. Biol. Technol., 56 (2013) 467.