Int. J. Electrochem. Sci., 10 (2015) 10157 - 10172
International Journal of
ELECTROCHEMICAL
SCIENCE
www.electrochemsci.org
Electrochemical Performance of Activated Carbon Derived
from Treated Food-Waste
Cheng-Kim Sim1,2, S.R. Majid1,*, Noor Zalina Mahmood2
1
Centre for Ionics University of Malaya, Department of Physics, University of Malaya, 50603 Kuala Lumpur, Malaysia.
2
Institute of Biological Science, Faculty of Science, University of Malaya 50603 Kuala Lumpur, Malaysia.
*
E-mail: shana@um.edu.my
Received: 27 August 2015 / Accepted: 22 September 2015 / Published: 4 November 2015
This work reports on the physical characteristics and electrochemical properties of the carbon derived from treated food-waste as electrode material. The eco-green carbon was produced by means of chemical activation using phosphoric acid as activating agent with varies activation temperature, 500 °C, 600 °C and 700 °C. Highest specific surface area of 535.80 m2
g-1 was achieved and consists mainly of mesoporous. Field Emission Scanning Electron Microscopy images illustrated the morphology of the activated carbon was porous and homogenously distributed. The electrochemical properties of activated carbon electrodes were analyzed using cyclic voltammetry, galvanostatic charge-discharge and electrochemical impedance spectroscopy in KOH as electrolyte. The specific capacitance from cyclic voltammetry and galvanostatic charge-discharge showed 85 Fg-1 and 106 Fg-1. Results demonstrated that the carbon produced from treated food-waste was a promising electrode material for supercapacitor.
Keywords: food-waste, activated carbon, supercapacitor, cyclic voltammetry, specific capacitance
1. INTRODUCTION
researchers or from industry, as an energy storage device for electric plant. Its application has range from memory backup to hybrid electric vehicles and industrial power management [2].
Generally, in EDLC assembly, carbon materials, such as activated carbon, carbon aerogel and carbon nanotubes are used, as a result of their unique characteristics. Many researchers have chosen activated carbon (AC) over the other two carbons, owing mainly to its relatively low cost, accessibility, ease of production, reasonable surface area value, chemical stability and ability to withstand wide range of temperatures [3]. There are number of reports stating that the production of activated AC from agricultural wastes, such as coconut [4], rice husk [5], bamboo [6], waste tea [7] etc. and its effectiveness in different applications. The synthesized AC can be utilized in a wide range of applications; for instance, as an adsorbent, for colour removal and purification, and also as an electrode for batteries as shown in Table 1.
Table 1. Activated carbon derived from agricultural waste and its applications
Raw material SBET (m2/g) Application Reference
Oil palm empty fruit bunches
- Phenol Adsorption [8]
Biomass: Grass cutting, horse manure, beer waste, bio-sludge
841, 749, 622, 489
Adsorbents for CO2 [9]
Industrial sludge - Methylene blue removal [10]
Coir Pith 315 Trichloroethlyene removal [11]
Sugarcane Baggase - Sugar decolorisation [12]
Walnut shells 1800 Methylene blue removal [13]
Waste tea-leaves, straw based
2245-2841, 2316
EDLC application [14], [15]
Spent tea waste - Purification of biodiesel [16]
Hard shell of apricot stones 1078 Adsorbent for the gold separation from gold-plating wastewater
[17]
Pecan shell 435-917 Treatment of chemical
oxygen demand (COD)
[18]
Sawdust (pinewood) 1350 Recovery of activator [19]
Maize tassel 5-1214 Removal of heavy metals
in water
[20]
waste or even animals’ manure. More importantly, this treatment can reduce waste volume by 40 to 60 % with feasible construction, low cost and low greenhouse gases emission [22].
In this work, we focus on the carbon preparation as an electrode material in a supercapacitor, using treated food-waste by vermicomposting as precursor, via the method of chemical activation. The carbonized precursor was activated at temperatures of 500 C, 600 C and 700 C. The electrochemical performance of prepared carbon electrode was determined using cyclic voltammetry, and electrochemical impedance spectroscopy. To the authors’ knowledge, there is yet available report on utilizing food-waste vermicompost as AC source for supercapacitor application currently. Thus, this study will diverse the application of vermicompost product not only provides waste management option but also contribution to the power sources.
2. METHODOLOGY
2.1 Carbonaceous Material Preparation
Local treated food-waste via vermicomposting was used as precursor and further dried in an oven at 110 °C for 48 hours. 10 g of dried vermicompost was impregnated with 400 mL of 1 M H3PO4
(R & M Chemicals) as the activating agent, and stirred continuously for 24 hours. The impregnated sample was then dried at 100 °C and crushed into powder. The powder was pyrolyzed at 400 °C, and subsequently, activated at different temperatures, such as 500 °C (FW500), 600 °C (FW600) and 700 °C (FW700) at a heating rate of 10 °Cmin-1
for 1 hour holding time, respectively, under nitrogen flow of 1 Lmin-1. The sample was cooled down inside the furnace under nitrogen flow, followed by washing with 0.5 M HCl and distilled water, to remove residual chemical and ash then dried at 110 °C.
2.2 Physical Characteristics
The IR spectrum was obtained under the resolution of 4 cm-1 over the range of 4000-550 cm-1. Each spectrum runs 32 scans in 2 s with correction against the background spectrum of air.
2.3 Electrochemical Measurements
A mixture of 0.9 g AC, 0.05 g super P and 0.05 g polyvinylidene difluoride (Pvdf) (Sigma Aldrich) in N-Methyl-2-pyrrolidone (NMP) was used for electrode preparation. The 2 cm2 nickel foam was pasted with carbon slurry, and dried in the furnace at 100 °C for four hours. Dried nickel foam was pressed at 100 kPa. A three-electrode set-up was carried out with carbon electrode, Pt and Ag/AgCl acted as working, counter and reference electrode in 6 M KOH. Cyclic voltammetry (CV), galvanostatic charge-discharge (CD) and electrochemical impedance spectroscopy (EIS) were recorded using an Autolab electrochemical measurement unit (PGSTAT30, Germany). CV was carried out in the voltage range of -0.9 V to -0.3 V, at various scan rates (1, 3, 5, 7, 9, 10, 30, 50, 70 and 100 mVs-1). The EIS measurement was performed within a frequency range of 0.1 Hz to 10 kHz, with alternating current amplitude of 10 mV. CD measurements were conducted from -0.9 V to -0.3 V, at the current of 1 mA. Specific capacitance (Cs, Fg-1) were evaluated from CV curves (1) and CD (2), according to the equations below:
Specific capacitance (Cs) = ∆i/(Mac × s) (1)
Specific capacitance (Cs) = (I × ∆t)/(∆V × Mac) (2)
where ∆i is average of discharge current, Mac (g) is the mass of active material, s (mVs-1) is the
scan rate, I (A) is the discharge current, ∆t (s) is the discharge time and ∆V (V) represents the voltage change after a full charge or discharge.
3. RESULTS AND DISCUSSION 3.1 Physical Characteristics
[image:4.596.155.444.541.720.2]
In Figure 1, thermogravimetric (TG) of the food waste based vermicompost depicted the mass loss during the pyrolysis process is divided into two phases. It can be seen that great dropped mass of 58% is observed at the early stage of the heating process. In DTG curve, first significant sharp peak is shown at 37 °C, mainly due to the loss of its high water content. Another small hump can be observed in both TG and DTG curves at 293 °C. This might be due to the breakdown of cellulose and hemi-cellulose [23, 24] in the vermicompost. Arising temperature after 400 °C showing in both DTG and TG curve implying the decomposition process is occurred.
[image:5.596.94.503.277.391.2]The activation temperature of materials has an important influence on the textural properties, as tabulated in Table 2.
Table 2. Textural properties of prepared activated carbon
Sample
Carbon
Yield BET
t-plot Micropore Volume Mesopore Volume Total Pores Volume Average Pores Width (%) (m2g-1) (cm3g-1) (cm3g-1) (cm3g-1) (nm)
FW500 41.55 535.80 0.068 0.18 0.248 3.7
FW600 30.50 312.68 0.051 0.074 0.125 4.1
FW700 29.26 173.51 0.012 0.089 0.101 4.5
In Table 2, it is clearly shown that SBET and total pore volume are inversely proportionate to the
activation temperature. The SBET and total pore volume values decreased when the activation
temperature was increased from 500 C to 600 C and 700 C. The used of H3PO4 as an activating
agent will lead to the shrinkage of the carbon structure, at temperatures above 600 °C, and results in the decrease of surface area and pore volume [25]. Figures 2(a) show the adsorption-desorption isotherm plots which explain further the information on the porosities of the AC. According to International Union of Pure and Applied Chemistry (IUPAC) classification, FW500 to FW700 showed the mixture of type I initial part and type II end part. FW500 and FW600 showed a steep isotherm at relatively low pressure p/p° ≈ 0 indicating high uptake of micropore filling. In this isotherm, we also observed that although it showed type I, but it micropore filling happened at a comparatively higher relative pressure indicating wider micropores termed as supermicroporous materials. Besides that, no long plateau is observed at middle relative pressure but an inflection point indicating the beginning of multilayer adsorption. This is mainly due to the existing of mesopores or macropores. The increase of the pyrolysis temperature from 600 C to 700 C has reduced the micropore as can be seen that the steepness at low relative pressure is reducing. The majority of the carbon prepared in this study is mainly mesoporous, as approximately 72% of Vmeso is shown in
hysteresis loop as Figure 2(a). The second peak of increment pore volume is noted at the range of 6-9 nm, however, the peak is gradually disappeared as the activation temperature increased.
[image:6.596.88.510.122.694.2]
Figure 3 presents the micrographs for all types of FW activated carbon prepared from a variety of activation temperatures. Micrographs were recorded with 200,000x magnification. Pores of heterogeneous shapes and sizes were observed from different activation temperatures. It can be seen that FW500 produced small pores and distributed homogenously. At 600°C, small pores with distinct size within the bigger pores are developed, while in FW700 porosity was reduced and left only larger pores in the carbon, as can be seen in Figure 3(c). This is one of the reasons contributed to low surface area in FW700 as surface area is inversely proportionate to the pore size. The FESEM images shown matched with the textural properties explained.
Figure 3. Porosity images observed from FESEM (a) FW500; (b) FW600 and (c) FW700
The EDX result has proven that FW is successfully converted to activated carbon in which it occupied highest percentage in carbon element compared to other elements as shown in Figure 4.
[image:7.596.81.515.237.598.2][image:8.596.98.499.343.588.2]
Figure 4. EDX of prepared FW-based carbon
Figure 5. X-ray diffraction pattern of FW activated carbons with various activation temperatures
[image:9.596.96.503.146.734.2]
appeared at 2338 cm-1 is attributed to the phosphate compound. The peak of 1706 cm-1 suggests the stretching vibration of C=O in ketones, aldehydes, carboxylic acids or acid phosphate esters indicating the reaction of phosphoric acid with raw material.
Figure 6. FT-IR spectrum of raw and soaked FW, FW500, FW600 and FW700
FW500 FW600
FW700
Soaked FW
Raw FW
3169
2357 1650
1020 1130 1170
1190
1130 1636
982 2360
3197
979 1087 1577
2361 3154
970 1616
2918
1071 2338
1148 1205
780
882
1025 1386
1643 3328
[image:10.596.77.523.238.662.2]
The peak of 1616 cm-1 can be assigned to the C=O of amide I and carboxylates. The shoulder peak of 1205 cm-1 is due to the C-O of polysaccharides and 1148 cm-1 can be assigned to the stretching vibration of hydrogen-bonded P=O, O-C stretching in P-O-C linkage and P=OOH groups from phosphates of polyphosphates. The peak of 1071 cm-1 represented the ionized linkage P+-O- and stretching vibration in P-O-P in acid phosphate esters. The remaining peaks of 970 cm-1, 882 cm-1, 780 cm-1 are due to the presence of residual quartz.
Table 3. The summary of related bands in raw FW, soaked FW, FW500, FW600 and FW700 vibration to the functional group or component
Wavenumbers (cm-1)
Vibration Functional group or component
References
3328-2918 O-H stretch Hydroxyl group [25]
2360-2338 Phosphate compound
1706 C=O Ketones, aldehyde,
carboxylic acids and esters
[26], [27], [28]
1650-1612 C=O Amides I,
carboxylates
[26]
1582-1577 N-H in plane Amides II [26]
1386 O-H bending Phenol [27], [29]
1205 C-O Polysaccharides [26]
1190-1130 P=O, O-C, P=OOH
stretch
Phosphate group [27], [28]
1087-1071 P+-O- Ionized linkage of
acid phosphate esters
[25]; [27]; [28]; [30]; [31]
1082 Quartz [26]
1025-1020 Si-O stretch Clay minerals [26]
Si-O-Si Silica
982-780 Quartz residual [32], [33]
phosphonates substances in FW500 and further shallower to 2360 cm-1 and 2357 cm-1 in FW600 and FW700 respectively. The peak at 1577 cm-1 in FW500 is assigned to the N-H plane of amides II and further deconvolution resolved the peaks of 1612 cm-1 and 1543 cm-1 which might due to the C=O of amides I and N-H plane of amides II as shown in Figure 6(b). The deconvolution of the similar wavenumbers region from 1800-1400 cm-1 is also carried out for FW600 and FW700 as depicted in Figure 6(c, d) which resolved in peaks 1636 cm-1 and 1550 cm-1 in FW600 while 1641 cm-1 and 1540 cm-1 in FW700. This phenomenon showing as the activation temperature, the C=O shifted to higher wavenumbers. The stretching P=O groups from phosphates of polyphosphates and ionized linkage P+ -O- in acid phosphate esters occurring at 1148 cm-1 and 1071 cm-1 in soaked FW are appeared to be at merge into the peak at1087 cm-1 after activated at 500 °C. This relative peak is then diverted to a doublet at 1130 cm-1 and 1190 cm-1 when activation temperature is increased to 600 °C and this doublet is remained at almost similar wavenumbers at 700 °C. In FW500 and FW600, the peaks at 979 cm-1 and 982 cm-1 respectively are assigned to quartz residual though this relative peak is shifted to 1020 cm-1 due to clay minerals in FW700. The summary of the related peaks are listed in Table 3.
3.2 Electrochemical Performance
[image:12.596.63.537.67.522.2]
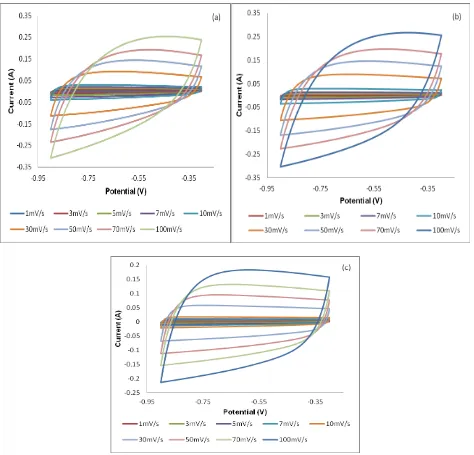
Figure 7. Cyclic voltammetry of (a) FW500, (b) FW600 and (c) FW700 in aprotic electrolyte of various scan rates
[image:12.596.175.421.587.735.2]
Figure 9. Comparison of capacitance from cyclic voltammetry curve on FW500, FW600 and FW700
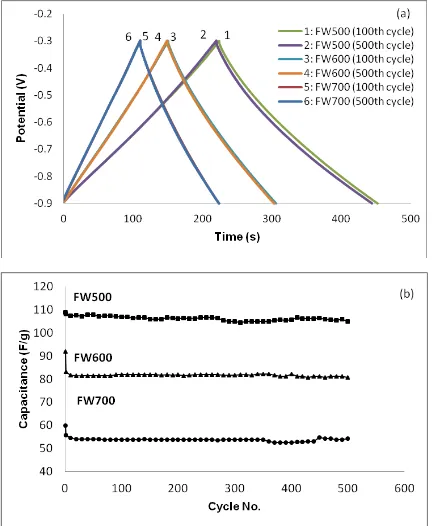
In Figure 10(a), the curves showed a nearly symmetrical and triangular shape, which reveals the good capacitive behaviour of the supercapacitor. According to the Figure 7(a), FW500 displayed longest charging and discharging time as compared with FW600 and FW700. The duration of the discharge process, at the 100th and 500th cycles for all carbons, showed an insignificant difference, suggesting that the carbon can withstand high reversibility and stability. The calculated specific capacitance at the 100th and 500th cycles for FW500 (107 Fg-1 and 105 Fg-1), FW600 (82 Fg-1 and 81 Fg-1) and FW700 (54 Fg-1 and 54 Fg-1) respectively. The result is in agreement with the specific capacitance evaluated from cyclic voltammetry and showed insignificant difference in capacitance value. The insignificance difference indicated good Coulombic efficiency and capacitive performance of the synthesized carbons in KOH solution [36]. FW500 exhibited high capacitance, owing to its higher surface area and total pore volume, which provide more active site for ions. Additionally, the highest micropore in FW500 provides additional support for ion adsorption enhances the specific capacitance [37]. Particularly, FW500 only showed 8 mV of voltage drop from the start of discharge curve which known as internal resistance (IR). From here, we can see that surface area showed a linear relationship with specific capacitance. Based on Figure 10(b), the results illustrated that all the ACs maintained high stability in capacitance along 500 cycles of charge-discharge.
Nyquist plot, as depicted in Figure 11 showing the imaginary component (Z") of the impedance against the real component (Z'), indicates the frequency response of the electrode/electrolyte system. All the plots exhibit two different segments which consist of a semicircle loop in the high frequency region and a nearly vertical line in the low frequency region [38]. The observed semicircle loop in the high frequency region indicate the resistance of the electrode/electrolyte/current-collector in the supercapacitor system [39]. The smallest semicircle diameter, depicted in FW600, suggests a lower charge-transfer resistance, which might be attributed to its nearly equivalent ratio of micropore and mesopore volume. However, contradiction was observed between FW500 and FW600, in terms of specific capacitance and charge-transfer resistance.
FW500
FW600
[image:13.596.121.479.70.287.2]
Figure 10. (a) Charge-discharge curves at 1 mA of FW500, FW600 and FW700 and (b) Specific capacitance of FW500, FW600 and FW700 over 500 cycles
[image:14.596.84.516.70.596.2]
Figure 11. Nyquist plots for FW500, FW600 and FW700 in electrolytes
4. CONCLUSION
A vermicompost-based FW activated carbon was prepared successfully by chemical activation treatment, using H3PO4. The optimized electrochemical performance of AC was obtained for the
FW500 sample. The electrochemical behavior of FW500 in KOH solution showed the specific capacitance of 107 Fg-1 and 105 Fg-1 at the 100th and 500th cycles respectively while 85 Fg-1 obtained from CV curve. The specific capacitance is consistent over 500 cycles. Based on the textural properties, the best capacitance value of FW500 was found to be controlled by SBET, total pore volume
and pore size distribution. This showed that vermicompost-based AC has potential as a greener electrode material in supercapacitor application.
ACKNOWLEDGEMENTS
This work was supported by RP025B-14AFR and PG009-2013A. The author would like to express gratitude to Skim Biasiswa University, Malaysia, for the scholarship awarded.
References
1. D. Qu, H. Shi, J. Power Sources, 74 (1998) 99
2. A.G. Pandolfo, A.F. Hollenkamp, J. Power Sources, 157 (2006) 11 3. E. Frackowiak, F. Beguin, Carbon, 39, (2001) 937
4. T.M.D. Azam, B.H. Hameed, A.L. Ahmad, J. Hazard Mater, 161 (2009) 1522
5. S.B. Daffalla, H. Mukhtar, M.S. Shaharun, Int. J. Glob. Environ. Issues, 12 (2012) 107 6. Q. Liu, T. Zheng, P. Wang, L. Guo, Ind. Crop. Prod., 31 (2010) 233
7. E. Yagmur, M. Ozma, Aktas, Fuel, 87 (2008) 3278
[image:15.596.178.419.66.286.2]
10.K. Mahapatra, D.S. Ramteke, L.J. Paliwala. J. Anal. Appl. Pyrol., 95 (2012) 79 11.Y.-F. Su, Y.-L. Cheng, Y.-H. Shih, J. Environ. Manage., 129 (2013) 361
12.K. Qureshi, I. Bhatti, R. Kazi, A.K. Ansari, Int. J. Chem. Biol. Eng. 1, (2008) 144 13.J. Yang, K. Qiu, Chem. Eng. J., 165 (2010) 209
14.C. Peng, X.-B. Yan, R.-T. Wang, J.-W. Lang, Y.-J. Ou, Q.-J. Xue, Electrochim. Acta, 87 (2013) 401
15.X. Li, C. Han, X. Chen, C. Shi, Microporous Mesoporous Mater., 131 (2010) 303
16.A.B. Fadhil, M.M. Dheyab, A.-Q.Y. Abdul-Qader, J. Association Arab Universities Basic Appl Sci., 11 (2012) 45
17.M. Soleimani, T. Kaghazchi, Bioresource Technol., 99 (2008) 5374
18.R.R. Bansode, J.N. Losso, W.E. Marshall, R.M. Rao, R.J. Portier, Bioresource Technol., 94 (2004) 129
19.Q.-F. Wu, F.-S. Zhang, Fuel, 94 (2012) 426
20.O.F. Olorundare, R.W.M. Krause, J.O. Okonkwo, B.B. Mamba, Phys. Chem. Earth Parts A/B/C 50-52 (2012) 104
21.T. Lieo, E. Albacete, R. Barrena, X. Font, A. Artola, A. Sanchez, J. Clean. Prod., 47 (2013) 70 22.K.P. Nagavallemma, S.P. Wani, S. Lacroix, V.V. Padmaja, C. Vineela, M. BabuRao, K.L.
Sahrawat, J. SAT Agr. Res., 2 (2006) 1
23.J. Hayashi, A. Kazehaya, K. Muroyama, A.P. Watkinson, Carbon, 38 (2000) 1873 24.A. Kundu, B. Sengupta, M.A. Hashim, G. Redzwan, J. Clean. Prod., 105 (2015) 420 25.M.A. Nahil, P.T. Williams, Biomass Bioenerg., 37 (2012) 142
26.E. Smidt, K. Meissl, Waste Manage., 27 (2007) 268
27.A.M. Puziy, O.I. Poddubnaya, A. Martinex-Alonso, F. Suarez-Garcia, J.M.D. Tascon, Carbon, 43 (2005) 2857
28.D. Prahas, Y. Kartika, N. Indraswati, S. Ismadji, Chem. Eng. J., 140 (2008) 32
29.J. Coates, in Encyclopedia of analytical chemistry, ed. By R.A. Meyers, John Wiley & Son Ltd, Chichester, (2000)
283
31.R. Xie, B. Qu, K. Hu, Polym. Degrad. Stabil., 72 (2001) 313
32.B.K. Das, S.M. Mandal, J. Bhattacharya, Environ. Earth Sci., 66 (2012) 607 33.H.-x. Li, X.-s. Qiu, Y.-x. Tang, J. China University Min. Technol., 18 (2008) 245
34.F. Kaasik, T. Tamm, M.M. Hantel, E. Perre, A. Aabloo, E. Lust M.Z. Bazant, V. Presser, Electrochem. Commun., 34 (2013) 196
35.S.H. Kwon, E. Lee, B.-S. Kim, S.-G. Kim, B.-J. Lee, M.-S. Kim, J.C. Jung, Curr. Appl. Phys., 14 (2014) 603
36.J. Tan, H. Chen, Y. Gao, H. Li, Electrochim. Acta, 178 (2015) 144.
37.D.-C. Guo, J. Mi, G.-P. Hao, W. Dong, G. Xiong, W.-C. Li, A.-H. Lu, Energy Environ. Sci., 6 (2013) 652
38.X.Y. Chen, Y.Y. He, H. Song, Z.J. Zhang, Carbon, 72 (2014) 410
39.R. Farma, M. Deraman, Awitdrus, I.A. Talib, R. Omar, J.G. Manjunatha, M.M. Ishak, N.H. Basri, B.N.M. Dolah, Int. J. Electrochem. Sci., 8 (2013) 257