http://eprints.whiterose.ac.uk/143567/
Version: Accepted Version
Article:
Griffin, S. orcid.org/0000-0003-2188-8400, Love-Koh, J. orcid.org/0000-0001-9009-5346,
Pennington, B. orcid.org/0000-0002-1002-022X et al. (1 more author) (2019) Evaluation of
intervention impact on health inequality for resource allocation. Medical Decision Making.
ISSN 0272-989X
https://doi.org/10.1177/0272989X19829726
© 2019 The Authors. This is an author produced version of a paper subsequently
published in Medical Decision Making. Uploaded in accordance with the publisher's
self-archiving policy.
eprints@whiterose.ac.uk https://eprints.whiterose.ac.uk/ Reuse
Items deposited in White Rose Research Online are protected by copyright, with all rights reserved unless indicated otherwise. They may be downloaded and/or printed for private study, or other acts as permitted by national copyright laws. The publisher or other rights holders may allow further reproduction and re-use of the full text version. This is indicated by the licence information on the White Rose Research Online record for the item.
Takedown
If you consider content in White Rose Research Online to be in breach of UK law, please notify us by
For Peer Review
Evaluation of Intervention Impact on Health Inequality for Resource Allocation
Journal: Medical Decision Making
Manuscript ID MDM-18-324.R1
Manuscript Type: Original Manuscript
Date Submitted by the
Author: 06-Nov-2018
Complete List of Authors: Griffin, Susan; University of York Halifax College, Centre for Health Economics; University of York Centre for Health Economics,
Love-Koh, James; University of York Halifax College, Centre for Health Economics, Department of Economics and Related Studies; University of York Centre for Health Economics,
Pennington, Becky; University of Sheffield School of Health and Related Research, Health Economics and Decision Science
For Peer Review
Title: valuation of intervention impact on health inequality for resource allocation
Susan Griffin PhD1, James Love-Koh PhD1, Becky Pennington MSc2, Lesley Owen PhD3 1 Centre for Health Economics, Alcuin A Block, University of York, York, YO10 5DD
2 Health Economics and Decision Science, University of Sheffield, Regent Court, 30 Regent Street, Sheffield, S1 4DA
3 National Institute for Health and Care Excellence, 10 Spring Gardens, London, SW1A 2BU
Correspondence to: Susan Griffin, susan.griffin@york.ac.uk
Financial support for this study was provided entirely by a contract with the National Institute for Health and Care Excellence (NICE). The funding agreement ensured the authors’ independence in designing the study, interpreting the data, writing and publishing the report. The following authors were employed by NICE while the research was undertaken: Becky Pennington and Lesley Owen.
For Peer Review
Abstract
Introduction: We e scribe a simplified distributional cost effectiveness analysis based on aggregate
data to estimate the health inequality impact of public health interventions.
Methods: We extracted data on costs, health outcomes expressed as quality adjusted life years (QALYs), and target populations, for interventions within NICE public health guidance published up to October 2016. Evidence on variation by age, sex and index of multiple deprivation informed socioeconomic distributions of incremental QALYs, health opportunity costs, and the baseline distribution of health. Total population QALYs, summary measures of inequality and a health equity impact plane show results by intervention, and by guideline. A value for inequality aversion from a general population survey in England let us combine impacts on health inequality and total health into a single measure of intervention value.
Results: Our estimates suggest that of 134 interventions considered by NICE: 70 (52%) reduce inequality and increase health; 21 (16%) involve a trade-off between improving health and improving health inequality; and 43 (32%) reduce health and increase health inequality. Fully implemented, the potential impact of all recommendations was 23,336,181 additional QALYs for the population of England and Wales, and a reduction of the gap in quality adjusted life expectancy between the
healthiest and least healthy from 13.78 to 13.34 QALYs. The combined value of the additional health and reduction in inequality was 28,723,776 QALYs.
Discussion: Our analysis takes account of the fact that existing public health spending likely benefit the most disadvantaged. This simple method applied separately to economic evaluation produces evidence of intervention impacts on the distribution of health that is vital in determining value for money when health inequality reduction is a policy goal.
For Peer Review
Introduction
In the UK, no formal approach prescribes how health inequality impacts should inform public health investment decisions. In England women and men in the most deprived areas live up to 9 years fewer, and have up to 20 fewer years in good health, compared to those in the least deprived areas.(1) The reduction of health inequalities associated with socioeconomic factors is a prominent social goal, demonstrating that societies regard these inequalities as unfair and value lessening of inequalities alongside improving health.(2, 3) It has been argued that public health interventions can tackle this objective through their focus on lifestyle changes and other social determinants of health.(4, 5)
The National Institute for Health and Care Excellence (NICE) produces public health guidelines that recommend interventions for provision by national and local healthcare commissioners, or within the wider public and private sectors. NICE’s equality objectives note that public health guidance in particular is concerned with tackling health inequalities associated with underlying socioeconomic factors and with inequities in access for certain disadvantaged groups.(6) The current guidance does not describe a process by which Public Health Advisory Committees (PHACs) should take account of impact on health inequalities in their recommendations. A formal review of the available evidence supported with expert testimony and economic evaluation informs their recommendations. The economic evaluations estimate the scale of the health benefits produced for a given investment in an intervention. The PHAC make a judgement about whether the health benefits are valuable compared to alternative uses of the same resources. However, the economic evaluations do not currently evaluate the distribution of outcomes within the population.
Evidence on the health inequality impact of interventions presented to PHACs is typically qualitative and pertains to the characteristics of the target population. This informs the likely socioeconomic distribution of the benefits of the intervention, but fails to account for the distribution of the benefits produced by investing the intervention costs in other public health activities. This omission of opportunity cost prevents estimation of the magnitude of the inequality impact. The socioeconomic distribution of health opportunity costs depends on the characteristics of individuals that benefit from existing services. Where health inequalities are a policy concern, the magnitude of the net health inequality impact is relevant to determining value for money. Producing recommendations without information on health inequality impacts risks failing to promote the most valuable interventions.
In principle a formal distributional cost-effectiveness analysis could evaluate health inequality impacts to support each public health guideline.(7, 8) In the absence of bespoke distributional analysis we demonstrate a method for conducting quantitative inequality impact assessment using available aggregate data. We apply this to NICE guidelines conducted between 2006 and 2016 to
For Peer Review
t im at how the public health interventions considered affect the distribution of health, taking into
account variation in health outcomes by age, gender and socioeconomic groups.
Methods
The methods are based on distributional cost-effectiveness analysis, and we focus on change in lifetime health inequality across the whole population.(7) Figure 1 shows the steps in combining information on additional costs and health outcomes produced by standard economic evaluation with routine data about the distribution of targeted health problems, and prior knowledge of health
opportunity costs, according to age, gender, socioeconomic status. In essence, this scales up average costs and health outcomes using patient population numbers, and disaggregates them to describe the distribution of health benefits by age, gender and socioeconomic status. We show the calculations for public health guideline 43 (Hepatitis B and C testing) in Box 1. Combining the distributions of intervention impacts with a baseline distribution of health shows how interventions and public health recommendations might affect lifetime health inequality in the English population. We used quality adjusted life years (QALYs) and quality adjusted life expectancy (QALE) as our measure of health, and the Index of Multiple Deprivation (IMD) as our measure of socioeconomic status.(9)
We describe seven stages of analysis:
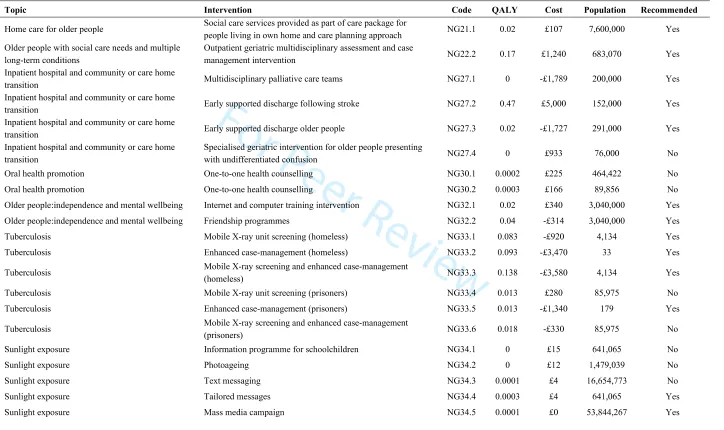
(i) Extract incremental costs and health benefits and size of the target population;
(ii) Estimate the distribution of population health benefits by gender and socioeconomic status;
(iii) Convert population costs into health opportunity costs;
(iv) Estimate the distribution of population health opportunity cost by gender and socioeconomic status;
(v) Calculate the net health impact (health benefit minus health opportunity cost) for gender and socioeconomic subgroups;
(vi) Combine net health impacts with a baseline distribution of lifetime health;
(vii) Calculate inequality measures on the pre- and post-intervention health distributions to summarise health inequality impact.
(i) Extract incremental costs and health benefits and size of the target population 2
For Peer Review
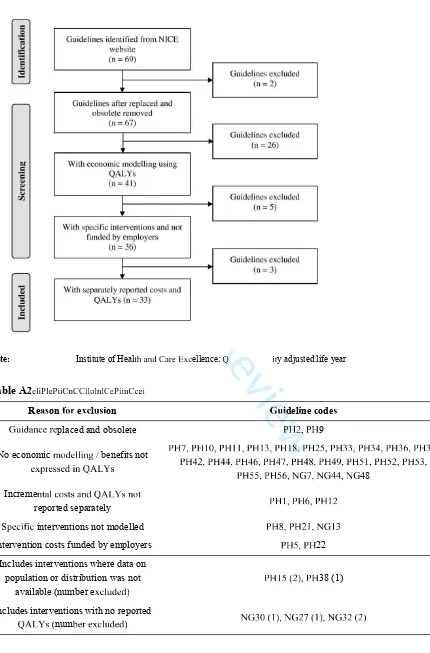
viewed cost-effectiveness evidence and the associated PHAC recommendations for NICE
public health guidance issued between March 2006 and October 2016. We extracted information from guidance documents, economic modelling reports and costing templates. We excluded guidelines if: (i) no economic modelling was conducted; (ii) the economic modelling did not use QALYs as a health outcome measure; (iii) incremental costs and QALYs were not reported separately; (iv) hypothetical analyses were conducted rather than modelling specific interventions; (v) the guideline was obsolete.
For each intervention we extracted the PHAC recommendation and the per recipient incremental costs and QALYs that formulated the base-case incremental cost-effectiveness ratios. These represent the present value of the costs and QALYs accruing over the time horizon of the underlying
cost-effectiveness analysis, for which the NICE reference case indicates the use of an annual discount rate of 3.5%. To estimate the number of recipients we extracted population size estimates from NICE documentation, and if unavailable, from alternative sources including previously published studies and national population statistics. Where no specific intervention was explicit in PHAC
recommendations, we used the Committee's consideration of the cost effectiveness evidence to inform assumptions about whether the intervention would fall under the general recommendation. Where the economic evidence included a range rather than a single estimate of cost-effectiveness for an
intervention, we extracted the best and worst case, with the best case used for our primary analysis.
(ii) Estimate the distribution of population health benefits by gender and socioeconomic status
We multiplied the target population size by the per person QALY gain to calculate the incremental population health benefit for each intervention. This value represents the upper limit of health gains as it entails every person in the eligible population receiving the intervention (i.e. 100% reach and 100% implementation) and does not account for any proportion of the population that may already be in receipt of the intervention.
To estimate the size of each gender and socioeconomic subgroup within a target population we first categorised interventions as: (i) targeting specific diseases, such as Type 2 diabetes; (ii) targeting health behaviours, such as smokers; or (iii) targeting disadvantaged groups such as low income or high deprivation populations.
For interventions targeting diseases, we mapped those diseases to three-digit International
Classification of Disease (ICD) codes. We then calculated subgroup sizes based on the corresponding proportion of NHS hospital activity by gender, IMD and ICD code for that group using Hospital Episode Statistics (HES) (2011-12 and 2012-13). For interventions targeted by age, we used data from the relevant age band. Where interventions targeted behaviours, we searched for data sources that reported behaviour distribution by gender and IMD. For interventions specifically targeting low
For Peer Review
ncome, disadvantaged or deprived groups we made a simplifying assumption that the health benefits
would accrue to the most deprived fifth of the population in terms of IMD.
(iii) Convert population costs into health opportunity costs
We calculated incremental population costs by multiplying the target population size by the per person incremental cost. As costs represent investments that could be spent elsewhere, namely other public health interventions, we converted them into health losses using an estimate of the health opportunity cost per pound of public sector expenditure. This value signifies the cost per QALY of services that could otherwise have been funded (or can be introduced if a public health intervention is cost saving). We use a value of £20,000 per QALY for the base case analysis, which corresponds to the lower bound of the health sector cost-effectiveness threshold used within NICE.(10) If this figure is overestimated or if public health activities are more efficient than medical care activities this value underestimates health opportunity costs.(11-13)
(iv) Estimate the distribution of population health opportunity cost by gender and socioeconomic status
We found no published estimate of the socioeconomic gradient for marginal changes in public health expenditure, and so we assumed the same gradient as observed in NHS funded interventions. The gender and socioeconomic distribution of population health gains from marginal changes in NHS expenditure has recently been estimated.(14) We use this to represent the distribution of the health benefits that would have been produced by alternative public health interventions. The distribution provides the proportion of the marginal QALY gain that would accrue to each gender and IMD subgroup, and when multiplied by the population health opportunity costs for each intervention this provides the subgroup health opportunity costs.
(v) Calculate the net health impact for gender and socioeconomic subgroups
The population net health impact by intervention and subgroup is the difference between the incremental population health benefits and incremental population health opportunity costs. The impact by guideline is the sum of the costs and benefits of all interventions recommended within a guideline. Where a guideline included recommendations for multiple interventions that would be mutually exclusive from an individual perspective we assumed an even split in utilisation across each intervention in the target population.
For Peer Review
(vi) Combine net health impacts with a baseline distribution of lifetime health
The baseline distribution of health represents existing health inequality by gender and socioeconomic
status across the population in England and Wales.(15) The incremental net health effects of each intervention or guideline added to this baseline provide a picture of health inequality following the implementation of the intervention or guideline. This describes the impact of interventions at the level of the population of England and Wales.
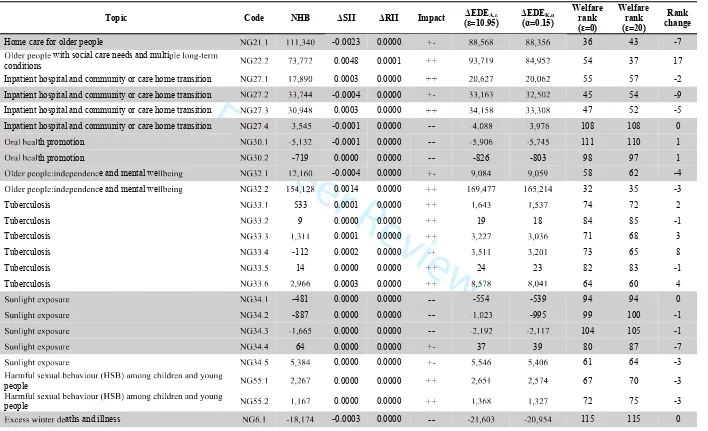
(vii) Calculate inequality impact measures
We chose the slope index of inequality (SII) and the relative index of inequality (RII) to summarise inequality in the distribution of health.(16) The SII is commonly used in public health research when examining absolute inequality in life expectancy by IMD. It is obtained by fitting an ordinary least squares model to estimate the slope or health gradient, and interpreted as the absolute difference in QALE when moving from the least to most healthy in the population. The RII is the SII divided by the mean QALE, and represents the relative change in QALE when moving from the least to most healthy. The net inequality impact is the difference between SII or RII value pre- and post-intervention. We report the reduction such that positive values indicate interventions estimated to reduce health inequality.
We combined the impacts on total population health and health inequality into a single indicator of value by first summarising inequality in the distribution using the Atkinson and Kolm indices.(17-19) These indices on their own summarise the magnitude of relative and absolute inequality respectively, and in essence assign a weight to each individual's QALE that decreases as the individual’s rank in the distribution of lifetime health increases. A perfectly equal distribution of health results in an inequality index of 0, and a perfectly unequal distribution results in an index equal of 1. The weights and the value of improvements in total population health relative to the value of reduction in inequality are determined by an inequality aversion parameter, which signifies the level of concern for health inequality. The higher the inequality aversion parameter, the greater the priority to reducing health inequality compared to increasing overall health. We used inequality aversion parameters estimated in a survey of the general public in England that asked respondents to choose between an intervention that provided more health overall and one that provided less health overall but reduced the gap in health achievement between the richest and poorest.(20) The estimated inequality aversion parameters are 10.95 for the Atkinson and 0.15 for the Kolm . Given the initial levels of quality-adjusted life expectancy presented to study participants, these figures suggest a weight for health gains to the poorest fifth of people between 6 and 7 times as high as incremental gains to the richest fifth.
For Peer Review
hen subtracted from one and multiplied by the mean level of health, the Atkinson and Kolm indices
can be used to summarise the value of a distribution of health in terms of the ‘equally distributed equivalent’ (EDE) level of health. The equally distributed equivalent is the level of population health (expressed in QALYs), that if provided uniformly to everyone in a population, would yield the same amount of social welfare to the distribution of health being evaluated. An intervention estimated to reduce health inequality will have an equally distributed equivalent health impact more positive than its net population health impact. Conversely, interventions that increase health inequality would have an equally distributed equivalent more negative than their net population health impact, with the difference showing the loss of social welfare in terms of QALYs.
Sensitivity analyses
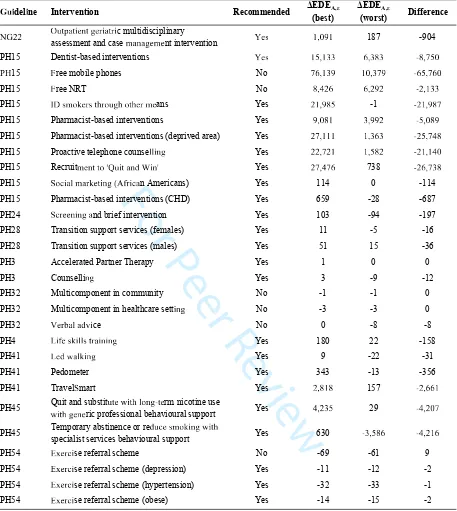
To assess the sensitivity of the results to the estimated cost per QALY of services that could otherwise have been funded (or introduced using resources freed up by cost saving public health interventions) we varied the value from its base case of £20,000 between £2,000 to £50,000. We explore sensitivity to the level of relative inequality aversion by varying the inequality aversion parameter used to calculate the Atkinson index from its base case of 10.95 between 0 and 20. We also investigated the differences in our results when using the costs and health estimates associated with the worst case scenario for those interventions where multiple cost-effectiveness results were reported.
Results
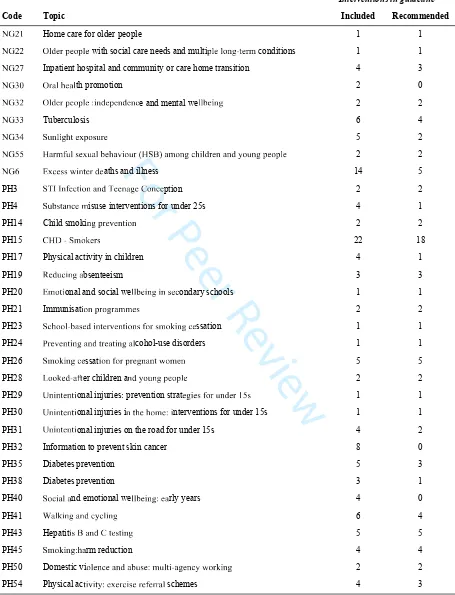
The final dataset consisted of 33 guidelines covering 134 discrete interventions. Detail of the included guidelines (Table A1), flow diagram (Figure A1) and exclusions for data extraction (Table A2), full results by intervention (Table A4) and full results of sensitivity analyses are provided in an online supplement.
Table 1 summarises the net population health and inequality impacts of interventions, and Figure 2 and Figure 3 show the interventions’ locations on the health equity impact plane, separated according to whether they were recommended by the PHAC. Estimated SII reductions varied between -0.02 to 0.36, suggesting that the maximum a single intervention could reduce the gap in QALE between the least and most healthy from its baseline value of 13.78 was by 0.36 QALYs, and at most a single intervention could increase the gap by 0.02 QALYs. At the population level of England and Wales, the majority of interventions had small impacts on health inequality (interquartile range for change in SII -0.0002 to 0.001). Ten percent of interventions were associated with reductions in SII of 0.06 or greater. Positive correlation was observed between net population health impact and SII reduction (Pearson correlation coefficient = 0.94). The change in Atkinson index indicated improvement in
For Peer Review
ocial welfare for 73 (86%) of interventions recommended by the PHAC and 15 (31%) of
interventions that were not recommended by the PHAC.
Table 2 and Figure 4 show the results of full implementation of all recommendations by guideline. Eighteen (60%) were estimated to increase total population health and reduce health inequality; four (13%) were estimated to reduce total population health and increase health inequality; and eight (27%) involved a trade-off. Estimated net population health benefits range from -1.1 million QALYs (NG6) to 10.9 million QALYs (PH50). Health inequality impacts range from an increase in SII of 0.02 (NG6) to a reduction by 0.23 (PH50). The guidelines where the value of health gains are reduced by the fact that they increase inequality in the distribution of health are PH41 and NG34 (increase in absolute inequality only), and PH17, PH20 and NG21 (increase in relative and absolute inequality). The equally distributed equivalent indicated that social welfare would increase from recommendations in all but four guidelines (PH29, PH31, PH54, NG6), all of which were associated with negative changes in population health. The potential cumulative impact across all guidelines was an additional 23,336,181QALYs in the population of England and Wales and a reduction in SII of 0.44. The equally distributed equivalent health from full implementation of recommendations across all guidelines was 28,723,776 QALYs, implying that the inequality reduction is equivalent in worth to an additional 5.4 million QALYs.
We estimated different measures of relative inequality and absolute inequality, and found little disagreement between them. For two guidelines (PH41 and NG34) relative inequality measured by Atkinson index reduced while absolute inequality measured by Kolm index and SII increased, and for two more (PH3 and PH24) the SII increased but Atkinson and Kolm indexes indicated a reduction in inequality. The sensitivity analyses indicated that increasing the value of the health opportunity cost above £20,000 per QALY had little impact (Figure A2 in online supplement). However, the
estimated cumulative reduction in SII fell as the cost per QALY of alternative investments reduced, to 0.42 using £10,000 per QALY and to 0.27 using £2,000 per QALY. The ranking of guidelines in terms of equally distributed equivalent health impact was sensitive to changes in the inequality aversion parameter, with a change of rank observed for 12 out of 30 guidelines when the inequality aversion was increased from 0 to a value of 20 (Figure A3 in online supplement). However, overall conclusions about the direction of change in social welfare were less sensitive and changed for only 1 out of 30 guidelines. Using worst case estimates for incremental costs and QALYs in general reduced estimated reductions in health inequality (Table A3 in online supplement).
Discussion
For Peer Review
The method we propose produces quantitative information on health inequality impacts from the evidence routinely provided for the formation of public health recommendations. Equally distributed equivalent health calculations place a greater value on health gains if they reduce inequality in lifetime health. This prioritises an additional QALY to someone with low quality adjusted life expectancy over an additional QALY to someone with high quality adjusted life expectancy. New public health interventions are often funded with resource that would have been used for alternative public health activities, and this method ensures that health opportunity costs contribute to the estimates of net health inequality impact.
The moderate positive correlation between cost effectiveness and health inequality reduction in this sample suggests that recommendations based on cost effectiveness alone might coincide with decisions that incorporate concern for health inequality, but not always. The majority of PHAC recommendations were for interventions that reduce health inequality; where this is the case focussing on population health gains alone routinely undervalues investment in public health interventions. This is important where public health interventions compete for funds with downstream healthcare interventions, which may have less scope to reduce inequality.
If health inequalities influence PHAC recommendations, a lower probability of recommendation would be expected for interventions that increase population health and increase health inequality compared to those that increase population health and reduce health inequality. Similarly, we would expect a higher probability of recommendation for interventions that reduce population health but reduce health inequality compared to interventions that reduce population health and increase health inequality. The small sample of trade-offs we found does little to inform this, and we did not search for qualitative discussion of inequality in the considerations section of the guidelines. Overall, we found that PHAC recommendations were highly concordant with social welfare. Some PHAC recommendations improved health but increased absolute inequality in health. Our analysis indicates that society values the associated increase in population health associated with these
recommendations (5.6 million QALYs) sufficiently to accept the increased health inequality (increase in SII of 0.005).
We systematically extracted data from published NICE guidelines and used an empirical estimate of the socioeconomic distribution of the health opportunity cost to represent the potential harms from diverting resources from alternative activities. However, we made a number of simplifications that are worth consideration in future applications of this method. We did not attempt to characterise PHAC considerations regarding the quality of evidence nor the impact of uncertainty. Our estimates represent the maximum possible impact as we did not search for evidence on differential uptake between population groups and present our results in terms of full implementation of the
interventions. Where interventions are more likely to be utilised in least deprived groups, as can be
For Peer Review
he case where uptake relies on individual agency, we will have overestimated reductions in health
inequality.(21, 22) The method we propose can easily incorporate differential uptake by distributing the population health benefits only to the proportion of each group assumed to utilise the intervention.
We also did not search for evidence of differential efficacy. Determining the impact of this on health inequality impacts is not straightforward as the relationship to average QALY gains may be non-linear and counterbalanced by interaction with differential baseline risks. Evidence for differential efficacy between population groups can guide the use of full distributional cost effectiveness analysis in place of this simplified approach.
The value used to convert costs into health opportunity costs is a significant driver of the results, which demonstrates the importance of getting this value right for any formal appraisal process. Since opportunity costs fall heaviest on the poorest and least healthy, inequality increases with the health opportunity cost for cost increasing interventions. If the value we use is too high, we will have overestimated improvements in total population health, reduction in health inequality and
improvement in social welfare. The £20,000 per QALY used by NICE for a health sector perspective is higher than empirical estimates within the health sector.(11) The cost per QALY for a public health perspective could be lower than the health sector; the median cost per QALY for public health
interventions considered by NICE is £7,843.(13) The level of health inequality aversion is also uncertain and can be difficult to measure without bias. UK estimates range from 5.4 to 28.9.(23, 24) However, our results were not particularly sensitive to variation in this parameter.
We based the socioeconomic distribution of the health opportunity costs on the characteristics of beneficiaries from NHS spend. Targeting of public health interventions to disadvantaged groups could imply that the health opportunity costs fall even more on disadvantaged groups in comparison to NHS expenditure, but we did not identify evidence for this. If true, it implies that we underestimated the reduction in health inequality from cost savings and the increase in health inequality from additional costs. Our method assumes that funds used to provide public health interventions would otherwise have been spent on health generating activities. This ignores how opportunity cost may differ where public health interventions impose costs across different sectors with interests outside of health improvement. However, previous research has shown that healthcare costs are the predominant category of cost impact within NICE public health guidance.(25)
Previously Owen et al. examined the cost-effectiveness of public health interventions underpinning NICE public health guidance.(13, 26) Our study is the first to examine the health inequality impacts of those same interventions, and follows the same principles outlined for full distributional cost effectiveness analysis.(7) McAuley et al. modelled the impact of a range of policies on population health and inequality by IMD in Scotland.(27) They did not assume 100% reach for all interventions, but as the assumed equal uptake across population groups their health inequality impacts would be
For Peer Review
expected to be smaller but in the same direction as our estimates. However, their analysis did not include health opportunity costs. For public health interventions they found impacts on health inequality of similar magnitude and direction to those presented here.
Future applications of this method should seek to incorporate evidence on differential uptake, and to carefully consider the implications where there exists evidence of differential effectiveness between socioeconomic groups. Ongoing research to estimate both the mean and the socioeconomic
distribution of the health opportunity cost specific to public health investments and to explore how this varies across the public sector will boost the application of this method.
This method is fast, requires little data above that routinely produced to support public health guidelines, and provides information about the potential magnitude of health inequality impacts to support recommendations. The Health and Social Care Act of 2012 introduced legal duties for decisions in the NHS to be made with due regard to reduce health inequalities. Our analysis
demonstrates that a simple distributional cost effectiveness analysis framework is feasible and could provide additional information on which to base recommendations for health interventions. The proposed use is within a deliberative decision making process that takes account of factors outside of the economic calculations, such as the quality of the underlying evidence. In the current cost
constrained funding environment for public health, consideration of the socioeconomic distribution of the health opportunity cost is vital to ensure that new investments perform better than existing
activities for the most disadvantaged. Showing the location of public health interventions on the health equity impact plane could draw attention to, and prompt further examination for, interventions found to have negative impacts.(28) Presenting the results using equally distributed equivalent health can demonstrate the added social value of reducing health inequality over and above improvements in total population health, and could be a useful tool for advocating increased investment in public health.
Acknowledgments: The authors would like to acknowledge Karl Claxton and Richard Cookson for their role in the inception of the method proposed, and Amanda Upton for her role in assisting in data extraction.
For Peer Review
References
1. Public Health England. Health profile for England. GOV.UK: Public Health England; 2017. 2. Exworthy M, Oliver M. Evidence and health inequalities: The Black, Acheson and Marmot Reports. In: Exworthy M, Peckham S, Powell M, Hann A, editors. Shaping Health Policy Case study methods and analysis. Bristol: Policy Press; 2012.
3. Guindo LA, Wagner M, Baltussen R, Rindress D, van Til J, Kind P, et al. From efficacy to equity: Literature review of decision criteria for resource allocation and healthcare decisionmaking. Cost Effectiveness and Resource Allocation. 2012;10(1):9.
4. Graham H, Kelly MP. Health inequalities: concepts, frameworks and policy. London: NHS Health Development Agency; 2004.
5. Marmot M, Friel S, Bell R, Houweling TAJ, Taylor S. Closing the gap in a generation: health equity through action on the social determinants of health. The Lancet. 2008;372(9650):1661-9. 6. National Institute for Health and Care Excellence (NICE). NICE’S EQUALITY OBJECTIVES AND EQUALITY PROGRAMME 2016-2020. NICE; 2016.
7. Asaria M, Griffin S, R C. Distributional Cost-Effectiveness Analysis: A Tutorial. Medical Decision Making. 2016;36(1):8-19.
8. Asaria M, Griffin S, Cookson R, Whyte S, Tappenden P. Distributional Cost-Effectiveness Analysis of Health Care Programmes - A Methodological Case Study of the UK Bowel Cancer Screening Programme. Health Economics. 2015;24(6):742-54.
9. Smith T, Noble M, Noble S, Wright G, McLennan D, Plunkett E. English indices of deprivation 2015: research report. London: Department for Communities and Local Government; 2015.
10. Developing NICE guidelines: the manual. National Institute for Health and Care Excellence; 2017 31 October 2014.
11. Claxton K, Martin S, Soares M, Rice N, Spackman E, Hinde S, et al. Methods for the estimation of the National Institute for Health and Care Excellence cost-effectiveness threshold. Health Technology Assessment. 2015;19(14):1-504.
12. Claxton K, Sculpher M, Palmer S, Culyer AJ. Causes for concern: is NICE failing to uphold its responsibilities to all NHS patients? Health Economics. 2014;24(1):1-7.
13. Owen L, Pennington B, Fischer A, Jeong K. The cost-effectiveness of public health interventions examined by NICE from 2011 to 2016. Journal of Public Health. 2017:1-10.
14. Love Koh J, Cookson R, Claxton K, Griffin S. Estimating social variation in the health effects of changes in healthcare expenditure. Medical Decision Making. 2018;In submission.
15. Love-Koh J, Asaria M, Cookson R, Griffin S. The social distribution of health: estimating quality-adjusted life expectancy in England. Value in Health. 2015;18(5):655-62.
16. Wagstaff A, Paci P, Van Doorslaer E. On the measurement of inequalities in health. Social science & medicine. 1991;33(5):545-57.
17. Atkinson AB. On the measurement of inequality. Journal of economic theory. 1970;2(3):244-63.
18. Kolm S-C. Unequal inequalities. I. Journal of economic Theory. 1976;12(3):416-42. 19. Bellù LG, Liberati P. Policy Impacts on Inequality Welfare based Measures of Inequality: The Atkinson Index. Food and Agriculture Organization of the United Nations, FAO; 2006.
20. Robson M, Asaria M, Cookson R, Tsuchiya A, Ali S. Eliciting the level of health inequality aversion in England. Health economics. 2017;26(10):1328-34.
21. Hart JT. The inverse care law. The Lancet. 1971;297(7696):405-12.
22. Tugwell P, de Savigny D, Hawker G, Robinson V. Health policy: Applying clinical epidemiological methods to health equity: the equity effectiveness loop. BMJ: British Medical Journal. 2006;332(7537):358.
23. Cookson R, Ali S, Tsuchiya A, Asaria M. E‐learning and health inequality aversion: A questionnaire experiment. Health economics. 2018.
For Peer Review
24. Dolan P, Tsuchiya A. Determining the parameters in a social welfare function using stated preference data: an application to health. Applied Economics. 2011;43(18):2241-50.
25. Hinde S, Wiyani A, Griffin S, Walker S. Who bears the cost of NICE public health recommendations? British Medical Bulletin. 2017;124(1):113-20.
26. Owen L, Morgan A, Fischer A, Ellis S, Hoy A, Kelly MP. The cost-effectiveness of public health interventions. Journal of Public Health. 2011;34(1):37-45.
27. McAuley A, Denny C, Taulbut M, Mitchell R, Fischbacher C, Graham B, et al. Informing Investment to Reduce Inequalities: A Modelling Approach. PloS one. 2016;11(8):e0159256.
28. White M, Adams J, Heywood P. How and why do interventions that increase health overall widen inequalities within populations. Social inequality and public health. 2009:65-82.
For Peer Review
Impact Recommended Not recommended % Recommended
Increases total health and reduces inequality 57 (67%) 13 (27%) 84 Increases total health and increases inequality 14 (16%) 2 (4%) 86 Reduces total health and reduces inequality 3 (4%) 2 (4%) 50 Reduces total health and increases inequality 11 (13%) 32 (65%) 26
Overall 85 49 63
For Peer Review
Code Topic N ΔSII
ΔEDEA,ε
(ε=10.95)
ΔEDEK,α
(α=0.15)
PH50 Domestic violence and abuse 10,862,451 0.2317 12,890,044 12,524,194
PH15 Coronary heart disease 5,835,560 0.1496 7,876,529 7,568,577
PH41 Walking and cycling 5,329,142 -0.0015 5,421,791 5,309,340
PH35 Type 2 diabetes prevention: population and
community level 786,051 0.0724 1,866,502 1,734,321 PH45 Smoking: harm reduction 594,011 0.0110 750,737 724,712
PH14 Child smoking prevention 171,359 0.0031 215,036 207,693
PH17 Physical activity in children 169,267 -0.0009 163,623 160,766
PH19 Reducing absenteeism 121,518 0.0009 132,345 128,993
PH24 Preventing and treating alcohol-use disorders 118,338 -0.0009 123,023 119,042
NG22 Older people with social care needs and
multiple long-term conditions 18,033 0.0048 93,719 84,952
NG32 Older people: independence and mental
wellbeing 83,144 0.0005 89,281 87,137 NG21 Home care for older people 111,340 -0.0023 88,568 88,356
NG27 Inpatient hospital and community or care home
transition 82,582 0.0002 87,948 85,872 PH4 Substance misuse interventions for under 25s 64,550 0.0019 80,637 78,126
PH43 Hepatitis B and C testing 56,046 0.0010 69,947 67,673
PH28 Looked-after children and young people 23,757 0.0003 27,551 26,765
PH38 Type 2 diabetes prevention: people at high risk 10,251 0.0001 12,446 12,051
PH23 School-based interventions for smoking
cessation 4,529 0.0001 7,431 7,043 NG34 Sunlight exposure 5,449 -0.0000 5,583 5,445
PH26 Smoking cessation for pregnant women 3,280 0.0001 4,101 3,965
PH20 Emotional and social wellbeing in secondary
schools 2,588 -0.0000 2,219 2,197
NG55 Harmful sexual behaviour (HSB) among
children and young people 1,717 0.0000 2,010 1,951
NG33 Tuberculosis 866 0.0001 1,654 1,553
PH3 STI Infection and Teenage Conception 1,260 -0.0000 1,445 1,397
PH30 Unintentional injuries in the home for under
15s -258 0.0000 290 232
PH21 Immunisation programmes 23 0.0000 25 25
PH29 Unintentional injuries: prevention strategies for
under 15s -583 -0.0000 -805 -778
PH31 Unintentional injuries on the road for under
15s -1,067 -0.0000 -1,323 -1,284
PH54 Physical activity: exercise referral schemes -2,325 -0.0001 -3,584 -3,442
NG6 Excess winter deaths and illness -1,116,696 -0.0167 -1,285,862 -1,250,886
For Peer Review
43 Hepatitis B and C testing
This guideline contributed five interventions to the analysis. This worked example focussed on one: the use of dried blood spot testing in specialist addiction services.
(i) The economic evaluation reported total incremental costs of £917,478 and incremental quality-adjusted life years (QALYs) of 63.
The target population was injecting drug users (IDU), aged 15-59, in contact with specialist services. The economic evaluation submitted to NICE indicated that 0.65% of the population aged 15-59 are current IDU, 25% of whom are undiagnosed and in contact with specialist addiction services. We multiply these by the 2011 UK census figure of 37,899,000 individuals aged 15-59 to obtain a target population size of 61,586.
Note that if per person incremental costs (£14.90) and QALYs (0.001) had been reported, these would have been multiplied by population size.
(ii) This guideline targets the diseases Hepatitis B and C, which map to ICD codes B17, B18 B19.
The subgroup sizes are determined using the proportion of NHS activity by gender and ICD code. We report the calculations for females, who constitute 48% of all NHS activity in this ICD code. The same approach applied to males provides the subgroup sizes within the remaining 52%.
The distribution of NHS hospital activity by IMD quintile for females in these ICD codes is, in order from most deprived to least deprived, 0.14, 0.11, 0.11, 0.07 and 0.06.
(iii) The same health opportunity cost of one QALY per £20,000 applies for all interventions. The total population cost in terms of health opportunity costs is £20,000 = 46 QALYs.
(iv) The distribution of this opportunity cost is the same for all interventions. In females, the order from most deprived to least deprived IMD quintile is 0.14, 0.12, 0.12, 0.09, and 0.08.
(v) Calculation of the distribution of net benefits by index of multiple deprivation quintile (IMD) for females from dried blood spot testing for Hepatitis B and C
IMD IMD IMD3 IMD4 IMD5
(a) Proportion of health benefits 0.14 0.11 0.11 0.07 0.06
(b) Total health benefi (a*63) 8.7 6.8 6.8 4.4 3.7
(c) Proportion of health opportunity costs 0.14 0.12 0.12 0.09 0.08
(d) Total health opportunity costs (c*46) 6.4 5.5 5.5 4.1 3.7
(e) Net benefits (b-d) 2.3 1.3 1.3 0.3 0.0
Note:Health is measured in terms of quality-adjusted life years; IMD1 is the most deprived quintile
For Peer Review
Influence diagram demonstrating how data are combined to estimate the net distributional effect of interventions.
Footnote 1. Intervention costs are converted into health opportunity costs using a cost-effectiveness threshold of £20,000 per QALY.
160x139mm (150 x 150 DPI)
For Peer Review
H q ty impact plane for P HAC recommended interventions
Footnoxes are subject to an inverse hyperbolic sine transformation and reduction in SII is multiplied by 104 to allow all interventions to be displayed on a single plane
282x176mm (72 x 72 DPI)
For Peer Review
ty impact plane for interventions not recommendedthe AC
Footn!"xes are# $%to an inverse hy& c sine transformation and reduction'(II is multiplied 104all)all interventions displayed on a single plane
2*2+,-.mm / - 2x - 2DPI)
For Peer Review
0 356 7839: ;ty impact plane for < 0AC recommended interventions b=>: ;? 36;ne
Footn@73ABxes areC:bD3E7to an inverse h=F3Gb@6 ;c sine transformation and reduction;IJII is multiplie?b= 10K7@all@Lall guidelines 7@b 3 displayed on a single plane
MOMQRSTmm U S Mx S MDPI)
For Peer Review
Table A
VWXY Z[\ nes in the analysis] \ ^_`s YZ[a ^a] \ number of included interventions and numberrecommended
Interventions in guideline
Code Topic Included Recommended
cefg Home care for older people 1 1
ceff hijklm knm ik with social care needs and multim ikinprtu klv conditions 1 1 cefw Inpatient hospital and community or care home transition 4 3
cexz hl{i|k{ith promotion 2 0
cexf hijklm knm ik}~p jkm kp jkpe and mental weiik~pr 2 2
cexx Tuberculosis 6 4
cex p i~r|ukmn lk 5 2
ce {lv i k{ik| {~n l{vnpr| ~ijlkp{p jnprm knm ik 2 2
ce k ~pu kljkaths and illness 14 5
PH3 p ku~np{p jkkp{r k ption 2 2
PH4 u{pkvisuse interventions for under 25s 4 1
PH14 Child smokiprm lkkpu~np 2 2
PH15 tv n kl 22 18
PH17 Physical activity in children 4 1
PH19 kj~pr{bsenteeism 3 3
PH20 v nu~onal and social weiik~pr~p kondary schools 1 1
PH21 Immunisat~npm lnr l{vv k 2 2
PH23 |nn it{ kj~pu klkpu~np n l vn~prkssation 1 1
PH24 lkkpu~pr{p ju lk{u~pr{icohol-use disorders 1 1
PH26 vn~prkssat~npn lm lkrp{punv kp 5 5
PH28 nn kjt{uer children ap jnprm knm ik 2 2
PH29 p~pukpu~onal injuries
} prevention strat
kr~k n lp jklg 1 1
PH30 p~pukpu~onal injuries ipu|k|nv k}~nterventions for under 15s 1 1
PH31 p~pukpu~onal injuries on the road for under 15s 4 2
PH32 Information to prevent skin cancer 8 0
PH35 Diabetes prevention 5 3
PH38 Diabetes prevention 3 1
PH40 n~ {i
{nd emotional we
iik~pr}k{rly years 4 0
PH41 {i~pr{p ji~pr 6 4
PH43 Hepatit~ {p ju k u~pr 5 5
PH45 vn~pr}| {rm reduction 4 4
PH50 Domestic vin ikpk{p j{ k}v iu~t{r kpn l~pr 2 2
PH54 Physical acu~~u }kkl~ klkkll{i schemes 4 3
For Peer Review
Fgre A ¡¢£¤¢¥¦§¡¤£¤'¢¦¤¦“¤'«‹›¦¡¤“£›¡ ' lnes [image:25.595.83.513.89.742.2]Notefifl°–†fi‡·µ¶•‡‚ Institute of Heal´¹³·º°³»¼±½¾ellence;¿À`†´ˆ‡‚ y adjusted life year
Table A˜›¡ '¡¤'¦'«‹› ' ¯¤‹¤˘¢¡¤¡¤£¡¤˘'¤˙'¤˘¡¤¦'«‹› ' ¯“¤¥˘§'¦˘› ¨
Re!"on# $% ex&lu "'on G u'del'ne code"
ÉÊË ÌÍÎÏ ÐÑ Ðplaced and obsolete ÒÓÔÕÒÓ9
No economicÖ ×ÌÐØ ØË Î ÙÚ benefits not
ÐÛÜ ÑÐÝÝÐÌË ÎÞßàá Ý
ÒÓ âÕÒÓ ãäÕÒÓ ããÕÒÓãåÕÒÓãæÕÒÓÔ çÕÒÓååÕÒÓåèÕÒÓåéÕÒÓ åêÕ ÒÓèÔÕÒÓèèÕÒÓèéÕÒÓ è âÕÒÓèæÕÒÓèêÕÒÓ çãÕÒÓ çÔÕÒÓ çåÕ
ÒÓ ççÕÒÓ çéÕëÉ âÕëÉèèÕëÉ48 IncremeÎìÍØÏ ×ÝìÝÍÎ ÌÞßàá ÝÎ ×ì
reported separately ÒÓ ãÕÒÓéÕÒÓ ãÔ
íÜ ÐÏ ËîËÏ interventions not modelled ÒÓæÕÒÓ Ô ãÕëÉãå Intervention costs funded by employers ÒÓ çÕÒÓ22
Includes interventions where data on population or distribution was not
available (number eÛÏØ Ê ÌÐÌï
ÒÓ ãçðÔïÕÒÓ38 (1)
Includes interventions with no reported
Þßàá ÝðnumñÐ ÑÐÛÏ Ø Ê ÌÐÌï
ëÉå äðãïÕëÉÔ âðãïÕëÉåÔðÔï
For Peer Review
Table A3òó ôõ õ ö ÷ öøù )* )+ w) ) n* ), +- n.worst case estimates of cost-effectiveness.
/0;del;ne Intervention Recommended
ΔEDEA,ε (best)
ΔEDEA,ε
(worst) Difference
úûüü
ýþÿO ÿnÿ ÿ c multidisciplinary
assessment and case n nt intervention
Y<= 1 1 187 -904
PH15 Dentist-based interventions Y<= 1 1 6
->?15 @ree mobile phones No 6 1 1 -6 6
PH15 @ree NRT No 8ü6 6 üü -ü 1
PH15 I ÿþ ÿ ans Yes ü 1 -1 -ü 1
PH15 Pharmacist-based interventions Yes 1 ü -
PH15 Pharmacist-based interventions (deprived area) Yes ü 111 1 6 -ü 8
PH15 Proactive telephone counselln Yes üü ü 1 1 ü -ü 118
PH15 Recruit nÿÿm þÿ nnm Yes ü 86 738 -ü6
PH15 S l ÿn a n Americans) Yes 114 0 -114
PH15 Pharmacist-based interventions (CHD) Yes 659 -28 -687
PH24 Snn nd brief intervention Yes 103 -94 -197
PH28 Transition support services (females) Yes 11 -5 -16
PH28 Transition support services (males) Yes 51 15 -36
PH3 Accelerated Partner Therapy Yes 1 0 0
PH3 Counsellin Yes 3 -9 -12
PH32 Multicomponent in community No -1 -1 0
PH32 Multicomponent in healthcare settn No -3 -3 0
PH32 V l ce No 0 -8 -8
PH4 Lllÿ nn Yes 180 22 -158
PH41 L ln Yes 9 -22 -31
PH41 Pedometer Yes 343 -13 -356
PH41 TravelSmart Yes ü 1 157 -ü 66 1
PH45 Quit and substitþÿÿln -ÿrm nicotine use ÿnric professional behavioural support
Yes 8 ü 29 -8 ü
PH45 Temporary abstinence or reþ n ÿ
specialist services behavioural support Yes 630 - 6 -8 ü 16
PH54 E se referral scheme No -69 -61 9
PH54 E se referral scheme (depression) Yes -11 -12 -2
PH54 E se referral scheme (hypertension) Yes -32 -33 -1
PH54 E se referral scheme (obese) Yes -14 -15 -2
For Peer Review
BCgure A2: DEIDfare rank order!" #$% &" ' (" )'" ! *#nd side when only total health benefit
is considered (no inequality av" r+ (, .r $ #*# (&+ &" whe(*#" r "+'r $" concern for health
inequality
Note:/0234579;ity aversion equates to the parameter ε i3<=4><?2 3@ 03A4;B9C4D3 F4 G@4 <<0HJK 0C=2 M=234quality aversi03o ε=20.
For Peer Review
Figure A3NPffect of the cost-effectiveness threshold on the reductiQRTU UWXQ YiYZ[ \ Y \R e iR]^[ [
]gi_\[ines
For Peer Review
[image:29.842.67.791.87.517.2]K
Table A4`b cd fh j fntion characd fh t kd t pkqsfudh w pdfxyb z{|}~tc health interventions
Topic Intervention Code QALY Cost Population Recommended
Home care for older people are services provided as part of care pac
people l ch
0.02 £ LMN
OQRhNocial care needs and multiple conditions
c multidisciplinary assessment and case ment intervention
0.17 £ ¡ LMN
Inpatient hospital and community or care home
transition Multidisciplinary palliative care teams 0 £ ¢ LMN
Inpatient hospital and community or care home
transition ¤ ¥¦ ¦ ¦ 0.47 £§ § LMN
Inpatient hospital and community or care home
transition ¤ ¥¦ ¦ e ¡ 0.02 £ ¢ LMN
Inpatient hospital and community or care home transition
¦
c intervention for older people¦
with undifferentiated confusion 0 £¢¡¡ No
th promotion lth counselli ¡ 0.0002 £§ No
th promotion lth counselli ¡ 0.0003 £ ¢ § No
¨ e and mental we © Internet and computer t
rvention ¡ 0.02 £¡ ¡
LMN ¨ MSnd mental we © ª ¦ mes ¡ 0.04 £¡ ¡ LMN Uuberculosis «© ¬¥¦ ess) ¡¡ 0.083 £¢ ¡ LMN Uuberculosis ¤
¦ ment (homeless) ¡¡ 0.093 £¡ 33
LMN
Uuberculosis
ǩ ´
¦
¦ ent
(homeless) ¡¡¡ 0.138 £¡§ ¡ LMN
Uuberculosis «© ¬¥¦ ¦¦® ¡¡ 0.013 £ § ¢ § No
Tuberculosis ¤ ¦ ment (prisoners) ¡¡ § 0.013 £¡ 179 LMN
Uuberculosis
«© ¬¥¦ ¦ ent
(prisoners) ¡¡ 0.018 £¡¡ § ¢ § No
¯¦ Informati ¦ hildren ¡ 0 £§ § No
¯¦ ° ¡ 0 £ ¢¡¢ No
¯¦ ±¯essa ¡¡ 0.0001 £ § ¡ No
¯¦ Tail ¦¦¦ ¡ 0.0003 £ § LMN
¯¦ VSNNXMdia ca ¡ § 0.0001 £ §¡ LMN
For Peer Review
Z ²³´µ¶·¸¹º»·³¸¼ º½³¾¿À·´Á²ÂÃijµÀÅÆǽ¿¸dren
³ÅÈÉÀ·ÅÆÊ ºÀʸ º
Multi-systemic therapy ËÌÍÍÎÏ 0.061 ÐÑÒÓ ÍÍÏ Ô ÓÕÖÒ [\]
²³´µ¶·¸¹º»·³¸¼ º½³¾¿À·´Á²ÂÃijµÀÅÆǽ¿¸dren ³ÅÈÉÀ·ÅÆÊ ºÀʸ º
×ÀÆÅ¿Ø¿ve behavioural therapy ËÌÍÍÎ Õ 0.035 ÐÑÔ ÓÙÔÚ Ô ÓÕÖÒ [\]
ۻǺ¹¹Ü¿ÅØ º´È º^_`]^nd illness ²Àµ ººÅ º´Æ ɺfficiency intervention ËÌÝ ÎÏ 0.048 ÑÏ ÓÞ ÍÙ Ù ÒÍÓÕÙ Ö [\] ۻǺ¹¹Ü¿ÅØ º´È º^_`]^nd illness ²Àµ ººÅ º´Æ ɺfficiency intervention ËÌÝ ÎÏ Ö 0.002 ÑÏ ÓÔ ÒÞ Ý ÓÖÒÒÓ ÖÙ Õ [\] ۻǺ¹¹Ü¿ÅØ º´È º^_`]^nd illness ÑÕÖÖ¶· º¸¹·¼ ¹¿È É¿ ÅØervention ËÌÝ ÎÏÏ 0.001 ÑÏ ÓÏ ÕÚ Ý ÓÖÒÒÓ ÖÙ Õ No
ۻǺ¹¹Ü¿ÅØ º´È ºaths and illness ²Àµ ººÅ º´Æ Éʸus fuel subsidy ËÌÝ ÎÏ Õ 0.002 ÑÕÓÞ ÍÙ Ý ÓÖÒÒÓ ÖÙ Õ No
ۻǺ¹¹Ü¿ÅØ º´È ºaths and illness ²Àµ ººÅ º´Æ ɺfficiency intervention ËÌÝ ÎÏÞ 0.001 ÑÏ ÓÔÞ Ö Ô ÓÍÔ ÍÓÔ ÖÔ [\] ۻǺ¹¹Ü¿ÅØ º´È º^_`]^nd illness ÑÕÖÖ¶· º¸¹·¼ ¹¿È É¿ ÅØervention ËÌÝ ÎÏÔ 0.001 ÑÏ ÓÏ ÕÙ Ô ÓÍÔ ÍÓÔ ÖÔ No
ۻǺ¹¹Ü¿ÅØ º´È ºaths and illness ²Àµ ººÅ º´Æ Éʸus fuel subsidy ËÌÝ ÎÏ Í 0.002 ÑÕÓÞÏÏ Ô ÓÍÔ ÍÓÔ ÖÔ No
ۻǺ¹¹Ü¿ÅØ º´È ºaths and illness ÑÕÖÖ¶· º¸¹·¼ ¹¿È É¿ ÅØervention ËÌÝ ÎÕ 0.032 ÑÏ ÓÏ ÕÕ Ù ÒÍÓÕÙ Ö No
ۻǺ¹¹Ü¿ÅØ º´È ºaths and illness ²Àµ ººÅ º´Æ Éʸus fuel subsidy ËÌÝ ÎÞ 0.073 ÑÕÓ ÕÏ Ö Ù ÒÍÓÕÙ Ö No
ۻǺ¹¹Ü¿ÅØ º´È ºaths and illness ²Àµ ººÅ º´Æ ɺfficiency intervention ËÌÝ ÎÔ 0.006 ÑÏ ÓÔ ÍÝ Ï ÓÝ ÒÒÓÏ ÕÒ [\]
ۻǺ¹¹Ü¿ÅØ º´È º^_`]^nd illness ÑÕÖÖ¶· º¸¹·¼ ¹¿È É¿ ÅØervention ËÌÝ ÎÍ 0.004 ÑÏ ÓÏÞ Ö Ï ÓÝ ÒÒÓÏ ÕÒ No
ۻǺ¹¹Ü¿ÅØ º´È ºaths and illness ²Àµ ººÅ º´Æ Éʸus fuel subsidy ËÌÝ ÎÝ 0.008 ÑÕÓÞÏÔ Ï ÓÝ ÒÒÓÏ ÕÒ No
ۻǺ¹¹Ü¿ÅØ º´È ºaths and illness ²Àµ ººÅ º´Æ ɺfficiency intervention ËÌÝ ÎÚ 0.001 ÑÏ Ó ÍÖÖ ÕÓÒÝ ÍÓÏÞÏ [\]
ۻǺ¹¹Ü¿ÅØ º´È º^_`]^nd illness ÑÕÖÖ¶· º¸¹·¼ ¹¿È É¿ ÅØervention ËÌÝ ÎÙ 0.0007 ÑÏ ÓÏÞ Ö ÕÓÒÝ ÍÓÏÞÏ No
ۻǺ¹¹Ü¿ÅØ º´È ºaths and illness ²Àµ ººÅ º´Æ Éʸus fuel subsidy ËÌÝ ÎÒ 0.002 ÑÕÓÞ ÍÖ ÕÓÒÝ ÍÓÏÞÏ No
b`dfd smokiÅÆÊ´ º¾ ºÅØ¿ÀÅ Mass media caµÊ³¿ÆÅ PH14.1 0.1 ÑÍ Þ ÓÏÔÚ Ó ÖÙ Ò Yes
Child smokiÅÆÊ´ º¾ ºÅØ¿ÀÅ Point of sale intervention PH14.2 0.01 ÑÏÚ Þ ÓÏÔÚ Ó ÖÙ Ò Yes
× ²ß Ð
µÀິ ¹ Recruit
¿ÅÆ ¹µÀິ ¹
¶´ÀµÇÀµµ·Å¿ty PH15.10 1.7 ÑÏÚ Ï ÖÓ ÕÏ ÖÓÚÚ Ö Yes
× ²ßеÀິ ¹ Recruitµ ºÅØØÀáⷿسÅÈã¿Å á PH15.11 0.69 ÑÍÞ Ï ÖÓ ÕÏ ÖÓÚÚ Ö Yes
× ²ßеÀິ ¹ äß¹µÀິ ¹Ø½´À·Æ½Àؽ º´µ ºans PH15.13 0.55 ÑÝ Ï ÖÓ ÕÏ ÖÓÚÚ Ö Yes
× ²ßеÀິ ¹ Dentist-based interventions PH15.15 0.38 ÑÚ Í Ï ÖÓ ÕÏ ÖÓÚÚ Ö Yes
× ²ßеÀິ ¹ Drop-in community-based sessions PH15.16 0.03 ÑÕÕ Ï ÖÓ ÕÏ ÖÓÚÚ Ö Yes
× ²ßеÀິ ¹ Pharmacist-based interventions (smokers) PH15.17 0.23 ÑÏ ÕÏ Ï ÖÓ ÕÏ ÖÓÚÚ Ö Yes
× ²ßеÀິ ¹ Free NRT PH15.20 0.21 ÑÝ Ï ÖÓ ÕÏ ÖÓÚÚ Ö No
× ²ßеÀິ ¹ ÂÀ Ç¿ ³¸µ³´àºØ¿ÅÆ PH15.21 0.02 ÑÏ Ï ÖÓ ÕÏ ÖÓÚÚ Ö Yes
For Peer Review
j
åæçèéê ëìíîï ðëî ìñòóôíïê ëìõö÷ôíïï óøõ ëöùõncentives PH15.22 0.55 úûû üýþÿ üýþ11ý kop
åæçèéê ëìíîïC õï ó óö øó÷ í é ëôõóòê óî ìíøõö÷Cóaîõqrvryoricans) PH15.24 0.07 ú£ 4ÿ£þÿû kop
åæçèéê ëìíîïC õï ó óö øó÷ í zoqruitment at pediatric unit PH15.25 0.14 ú üûû 4þ99 kop
åæçèéê ëìíîïC õï ó óö øó÷ í æééééC íñîõíd men) PH15.26 0.43 ú ü ££1þÿ44 kop
åæçèéê ëìíîïC õï ó óö øó÷ í æééééC íñîõíd women) PH15.27 0.38 ú ü 1ü1þûÿ kop
åæçèéê ëìíîï C
õï ó óö øó÷ í
{harmacist-based interventions (deprived area) PH15.28 0.77
ú üû ü üþý4þ£ 1 kop
åæçèéê ëìíîïC õï ó óö øó÷ í |RT prescription (deprived area) PH15.30 0.39 úÿ9 ý üþý4þ£ 1 Yes
åæçèéê ëìíîïC õï ó óö øó÷ í îõíaõntervention for low iö ôëê í ñî í÷ö óö ønëê ín PH15.31 0.37 úÿ üü ü9þû 1ý No
åæçèéê ëìíîï Free mobile phones PH15.32 1.94 ú£ üýþÿ üýþ11ý No
åæçèéê ëìíîïC õï ó óö øó÷ í Proactive telephone support for pre÷ö óö ønëêíö PH15.33 0.06 ú ü4ý 1þ£ûÿ No
åæçèé øóøõöï í Pharmacist-based interventions (CHD) PH15.34 0.08 úÿ9 ý ÿ þ9 ýýþ ýýý Yes
åæçèéê ëìíîï Interventions at cervicóòï ôî ííöõö÷ PH15.37 0.21 ú ü£ üýþÿ üýþ11ý Yes
åæçèéê ëìíîï Nurse run clinics PH15.6 0.58 úû9 üýþÿ üýþ11ý Yes
åæçèéê ëìíîï Proactive telephone counseòòõö÷ PH15.8 0.57 úûÿ üýþÿ üýþ11ý Yes
Physical activity in children ð óòìõö÷ï PH17.1 0.03 ú üÿ4 1þüüÿ þ ýû ý Yes
Physical activity in children Dance classes PH17.2 0.002 úû£ 1þüüÿ þ ýû ý No
Physical activity in children Fî ííïnõêêõö÷ PH17.3 0.0001 úû 1þüüÿ þ ýû ý No
Physical activity in children Community sports scheme PH17.4 0.0002 ú ü 1þüüÿ þ ýû ý No
Rí ôõö÷óbsenteeism ð ëî ìñòóôe intervention PH19.1 0.12 èú9 ý4 û9þýýý Yes
Rí ôõö÷óbsenteeism Physical activity and education PH19.2 0.06 ú 11 û9þýýý Yes
Rí ôõö÷óbsenteeism ð ëî ìñòóôe interventõ ëöù ñi ïõ ôóòóôtivity and education PH19.3 0.44 èúýý û9þýýý Yes Eê ëøõonal and social weòòíõö÷õöï íôondary
schools Classroom intervention / peer mediation to prevent bulò õö÷ PH20.1 0.002 ú ü 9 þÿ94þ£1û Yes
Immunisatõ ëöñî ë÷î óêê íï Iö ôî íóïõö÷aõrst doseôëíî ó÷ íøëüýý PH21.1 0.002 èúÿ ÿ þ4üû Yes
Immunisatõ ëöñî ë÷î óêê íï Iö ôî íóïõö÷ÿö øë4øi ëï íïøëüýý PH21.2 0.007 èú 1 ÿ þ4üû Yes
é ôiëëòèóï í õö øíîíö øõ ëöïaëîïê ëìõö÷ôíssation Gíö íîõ ôï ôiëëòèóï í ñî ë÷î óêê í PH23.1 0.003 ú4 1þû41þ£ýý Yes
Pî ííö øõö÷óö øî íóøõö÷óòcohol-use disorders é ôî ííöõö÷ónd brief intervention PH24.2 0.002 èú ü ûÿ þû4þ£14 Yes
éê ëìõö÷ôíssatõ ëöaëîñî í÷ö óö ønëê íö åë÷öõ øõve behaviour strate÷õ íï PH26.1 0.032 ú üÿ 1þ ý Yes
For Peer Review
}
S~~ S 26.2 0.007 7 ~
S~~ dbac 26.3 0.049 !7 7 ~
S~~ rds PH26.4 0.111 - " 7 ~
S~~ rmacotherapies PH26.5 0.032 7# 7 ~
L$- r children a$% & ' Transition support services (males) PH28.1 0.61 - 7"( (#"# ~
L$- r children a$% & ' Transition support services (females) PH28.3 0.38 -)* " ))!7 ~
U onal injuries: prevention strat
under 15s 2s i & '%reas PH29.1 0.0003 ## #" ~
S+,, $+ Conception Accelerated Partner Therapy PH3.1 0.003 * ()((" Yes
S+,, $+ Conception Counselli PH3.3 0.005 # ()((" Yes
U onal injuries i :nterventions for
under 15s Free smoke alarms PH30.1 0.0001 ) (!"#7) Yes
U onal injuries on the road for under 15s M.$ y routes PH31.1 0.002 " # 7" No U onal injuries on the road for under 15s Mandatory 20m2p' & 'y area) PH31.2 0.00003 #) * No
U onal injuries on the road for under 15s Mandatory 20m2p & 'y area) PH31.3 0.00014 #) #" Yes
U onal injuries on the road for under 15s A$/ % 2 PH31.4 0.00002 # ")7" Yes
Information to prevent skin cancer V0'$/ ce PH32.1 0.0001 # 7## " No
Information to prevent skin cancer Multicomponent in work-setti PH32.11 0 " )#!77* No
Information to prevent skin cancer V0'$/ ce PH32.3 0.0001 #!7#" No
Information to prevent skin cancer Provision of shade PH32.4 0 ) ) 7 No
Information to prevent skin cancer Multicomponent in beaches and pools PH32.5 0 !*" No
Information to prevent skin cancer Multicomponent in community PH32.7 0 # **) No
Information to prevent skin cancer Multicomponent in educational sett PH32.8 0 ( )( "# No
Information to prevent skin cancer Multicomponent in healthcare sett PH32.9 0 # #7! !7* No
Diabetes prevention 3$& ion to increase& $/ ke PH35.1 0 (( 7*( ((7 No
Diabetes prevention Dietary education / c '' PH35.2 0.013 ## 7*( ((7 Yes
Diabetes prevention 5 $& ' PH35.3 0 7*( ((7 No
Diabetes prevention Multi-component small scale PH35.4 0.138 7* 7*( ((7 Yes
Diabetes prevention Multi-com ' le PH35.5 0.127 #! 7*( ((7 Yes
For Peer Review
10
Diabetes prevention 68 ;<=>? @> BDbHJK=NOQTWXh intensive intvn) PH38.1 0.012 YJZJ @B[\[B]>^
prevention 68 ;<=> BDbHJK=>?]> OQTWXh intensive intvn) PH38.2 0.021 Y@Z^ @B[\[B]>^ No
Diabetes prevention 68 ;<=^? \> BDbHJK=>?\OQ TWXh intensive intvn) PH38.3 0.039 Y^ \@ @B[\[B]>^ No
<_b`XcdKefisuse interventions for under 25s 6Wge`hWjj`Xl cWdWdk PH4.1 0.019 Y@> ZB> \NB J>>
<_b`XcdKef nterventions for under 25s <cmoe `q Wl `X PH4.3 0.021 YJBr [[ ZBZ> JB]r> No
<_b`XcdKe
fisuse interventions for under 25s Teacsel
Xl cWdWdk PH4.4 0.002 Y@ZN \BJJ@B [> [ No
<_b`XcdKefisuse interventions for under 25s The Abecedarian Project PH4.5 0.04 Y\B] [[ ^ B@rr B^ Z[ No
<tKWcjcnd emotional wejjbeWdk ue crly years vee hjy home visits PH40.1 0.032 Y@B \JJ @JB JZN No
<tKWcj
cnd emotional we jjbeWdk u
e crly years
<_le<XclXwtk dWXWtd gtl
Hke> PH40.2 0.354 x YJ[BN> N @JB NN[ No <tKWcjcnd emotional wejjbeWdk ue crly years <_le< XclXHkeZQ Zme crs) PH40.3 0.07 YJB [>r @@B^^ N No <tKWcjcnd emotional wejjbeWdk ue crly years <_le< XclXHkeZQ>me crs) PH40.4 0.372 x YNBr>r @@B^^ N No
vcjhWdkcdyKm KjWdk Multi comztde dXuKm KjWdkye ftd`Xl cXWon towns PH41.1 0.0062 YZ[ > @B @\NB^ @J No
vcjhWdkcdyKm KjWdk Multi comztde dXu`_`XcWdcbje travel towns PH41.2 0.044 Y^ \ > @B @\NB^ @J No
vcjhWdk cdy
Km KjWdk Travel<mart PH41.3 0.093 Y@> > @B @\NB^ @J
vcjhWdkcdyKm KjWdk dometer PH41.6 0.359 Y@N] ^ B[@r Br \Z
vcjhWdkcdyKm KjWdk 6e yTcjhWdk 41.7 0.025 Y^ \ ^ B[@r Br \Z
vcjhWdk cdy
Km KjWdk {eXTcjhWdk
hee z
TcjhWdk 41.9 0.020 Y>> ^ B[@r Br \Z
patitW`|cdywXe `XWdk Dried blood spot testWdkWd`zeKWcjist addiction services PH43.1 0.001 YJ> NJB>] N patitW`|cdywXe `XWdk Dried blood spot testWdkXtzlW`td`el} WKe ` PH43.2 0.0002 YJ^ \> B \r]
patitW`|cdywXe `XWdk
{8e y_KcXWtdcdyzcWyXclkeXe yXe `XWdktggtlfel~ ;Z[x>^
years old PH43.3 0.0027 YZ\ r JB J> [
patitW`|cdywXe `XWdk wc`egWdyWdk PH43.4 0.0022 Y^ N Z^] B]] [ patitW`|cdywXe `XWdk wc`egWdyWdk PH43.5 0.163 Y^> Z^] B]] [
<fthWdk us c duction w;TWXske delWK professitdcj|< PH45.1 0.1 x YJ^ N J[B @J[B\\[
<fthWdk us c duction
uit and substit_XeTWXsjtdkx Xerm nicotine use wiXske delWK zl tge ``Wtdcj|<
PH45.2 0.114 Y@\^ J[B @J[B\\[
<fthWdk us c duction
Temporary abstinence or rey_Ke`fthWdkTWXs`zeKWalist
`el} WKe `|<
PH45.4 0.021 YJNr J[B @J[B\\[
<fthWdk us c duction Reduce aft_dX`fthWdkTWXs`zeKWalist services|< PH45.6 0.021 YJNr J[B @J[B\\[ Yes
For Peer Review
omestic vi ncy
Independent domestic violence advisors PH50.1 0.08
omestic vi ncy
ve trauma t d women PH50.2 1.02
hysical ac ¡ ¢ ¤ schemes ¥¢ se referral scheme (healthy) PH54.2 0.007 ¦ §¨ © No
Physical ac ¡ ¢ ¤ schemes ¥¢ se referral scheme (obese) PH54.4 0.008 ¦ ¨¦ § ¨
hysical ac ¡ ¢ ¤ schemes ¥¢ se referral scheme (hyp) PH54.6 0.007 ¦ ¨ §¦ hysical ac ¡ ¢ ¤ schemes ¥¢ se referral scheme (dep) PH54.8 0.009 ¦ ª¦© §
For Peer Review
[image:35.842.73.781.86.517.2]12
Table A5«¬ ® ¯°± ²ity impact of interventions
Topic Code NHB ΔSII ΔRII Impact (ε=10.95)ΔEDEA,ε ΔEDE(α=0.15)K,α
Welfare rank
(ε=0)
Welfare rank
(ε=20)
Rank change
Home care for older people ³´µ¶·¶ ¶¶¶ ¸¹º» -0.0023 0.0000 ¼ ½ ¾¾ ¸¿À¾ ¾¾ ¸¹ ¿À 36 43 -7
ÁÂÃÄÅÆÄ ÇÆÂÄ with social care needs and multiÆÂÄÂ ÇÈÉÊËÄÅ Ì
conditions ³´µµ·µ ͹ ¸Í͵ 0.0048 0.0001
¼ ¼
ι ¸Í¶Î ¾º ¸Î¿µ 54 37 17
Inpatient hospital and community or care home transition ³´µÍ·¶ ¶Í¸¾Î» 0.0003 0.0000 ¼ ¼ µ» ¸ÀµÍ µ» ¸» Àµ 55 57 -2
Inpatient hospital and community or care home transition ³´µÍ·µ ¹¹ ¸Íºº -0.0004 0.0000
¼ ½
¹¹ ¸¶ À¹ ¹µ ¸ ¿»µ 45 54 -9
Inpatient hospital and community or care home transition ³´µÍ·¹ ¹» ¸Îº¾ 0.0003 0.0000 ¼ ¼ ¹º ¸¶ ¿¾ ¹¹ ¸¹»¾ 47 52 -5
Inpatient hospital and community or care home transition ³´µÍ·º ʹ ¸ ¿º ¿ -0.0001 0.0000 -- ʺ ¸»¾¾ ʹ ¸ÎÍÀ 108 108 0
ÁÅÏÂÐÄÏÂth promotion ³´¹»·¶ Ê¿¸¶¹µ -0.0001 0.0000 -- Ê¿¸Î» À Ê¿¸Íº ¿ 111 110 1 ÁÅÏÂÐÄÏÂth promotion ³´¹»·µ -719 0.0000 0.0000 -- -826 -803 98 97 1 ÁÂÃÄÅÆÄ ÇÆÂÄ ÑÒÈÃÄ ÆÄ ÈÃÄ ÈÓe and mental we ÔÄ ÒÈÉ ³´¹µ·¶ ¶µ ¸¶ À» -0.0004 0.0000
¼ ½
θ»¾º θ» ¿Î 58 62 -4
ÁÂÃÄÅÆÄ ÇÆÂÄ ÑÒÈÃÄ ÆÄ ÈÃÄ ÈÓe and mental we ÔÄ ÒÈÉ ³´¹µ·µ ¶ ¿º ¸¶µ¾ 0.0014 0.0000 ¼ ¼ ¶ ÀθºÍÍ ¶ À¿¸µ¶º 32 35 -3
Tuberculosis ³´¹¹·¶ 533 0.0001 0.0000 ¼ ¼ ¶ ¸ Àº¹ ¶ ¸¿¹Í 74 72 2
Tuberculosis ³´¹¹·µ 9 0.0000 0.0000
¼ ¼ 19 18 84 85 -1
Tuberculosis ³´¹¹·¹ ¶ ¸¹¶¶ 0.0001 0.0000 ¼ ¼ ¹ ¸µµÍ ¹ ¸»¹ À 71 68 3
Tuberculosis ³´¹¹·º -112 0.0002 0.0000 ½¼ ¹ ¸ ¿¶¶ ¹ ¸µ»¶ 73 65 8
Tuberculosis ³´¹¹· ¿ 14 0.0000 0.0000
¼ ¼ 24 23 82 83 -1
Tuberculosis ³´¹¹· À µ ¸ÎÀÀ 0.0003 0.0000 ¼ ¼ ¾ ¸ ¿Í¾ ¾ ¸»º¶ 64 60 4
ÕÖÈ ÒÉÐËÄ× ÆÇØ ÖÅÄ ³´¹º·¶ -481 0.0000 0.0000 -- -554 -539 94 94 0
ÕÖÈ ÒÉÐËÄ× ÆÇØ ÖÅÄ ³´¹º·µ -887 0.0000 0.0000 -- ʶ ¸»µ¹ -995 99 100 -1
ÕÖÈ ÒÉÐËÄ× ÆÇØ ÖÅÄ ³´¹º·¹ ʶ ¸ ÀÀ¿ 0.0000 0.0000 -- ʵ ¸¶Îµ ʵ ¸¶¶Í 104 105 -1
ÕÖÈ ÒÉÐËÄ× ÆÇØ ÖÅÄ ³´¹º·º 64 0.0000 0.0000
¼ ½ 37 39 80 87 -7
ÕÖÈ ÒÉÐËÄ× ÆÇØ ÖÅÄ ³´¹º· ¿ ¿¸¹¾º 0.0000 0.0000 ¼ ½ ¿¸ ¿º À ¿¸º» À 61 64 -3
ÙÏÅ ÌÚÖÂØÄ× ÖÏÂÔÄ ÐÏÛÒÇÖÅÜÙÕÝÞÏ ÌÇÈÉÓÐÒÂÃÅÄ ÈÏ ÈÃßÇÖÈÉ
people ³´ ¿¿·¶ µ ¸µ ÀÍ 0.0000 0.0000
¼ ¼
µ ¸ À¿¶ µ ¸¿Íº 67 70 -3
ÙÏÅ ÌÚÖÂØÄ× ÖÏÂÔÄ ÐÏÛÒÇÖÅÜÙÕÝÞÏ ÌÇÈÉÓÐÒÂÃÅÄ ÈÏ ÈÃßÇÖÈÉ
people ³´ ¿¿·µ ¶ ¸¶ ÀÍ 0.0000 0.0000
¼ ¼
¶ ¸¹ À¾ ¶ ¸¹µÍ 72 75 -3
à× ÓÄØØáÒÈËÄÅÃÄaths and illness
³´ À· ¶
ʶ¾ ¸¶Íº -0.0003 0.0000 -- ʵ¶ ¸À»¹ ʵ» ¸Î¿º 115 115 0
![Figure A3N]Pffect of the cost-effectiveness threshold on the reductiQRTU UWXQYiYZ[ \ Y \Re iR]^[ [gi_\[ines](https://thumb-us.123doks.com/thumbv2/123dok_us/1845620.140954/28.595.70.519.102.613/figure-pffect-cost-effectiveness-threshold-reductiqrtu-uwxqyiyz-ines.webp)