Int. J. Electrochem. Sci., 10 (2015) 1274 - 1291
International Journal of
ELECTROCHEMICAL
SCIENCE
www.electrochemsci.org
Synthesis and Characterization of Electrochromic Films Based
on 2,5-Bis (2-(3,4-ethylenedioxy)thienyl)pyridine
D.Triantou1*, C.S. Asaftei1, S. Soulis2, A. Skarmoutsou2, E. Milioni2, C. Charitidis2, S. Janietz1
1
Fraunhofer Institute for Applied Polymer Research, Department ‘Polymer Electronics’, Geiselbergstrasse 69, 14476 Potsdam, Germany
2
National Technical University of Athens. School of Chemical Engineering, Research Unit of Advanced, Composite, Nano Materials & Nanotechnology, Heroon Polytechniou 9, 15773, Athens, Greece
*
E-mail: [email protected], [email protected]
Received: 20 October 2014 / Accepted: 29 November 2014 / Published: 16 December 2014
2,5-bis(2-(3,4-ethylenedioxy)thienyl)pyridine was synthesized by Stille coupling. This monomer having D-A-D structure was successfully electropolymerized by cyclic voltammetry. The electrochemical, optical, electrochromic, nanomechanical properties of the films, as well as their stability and morphology were studied. The polymer films exhibit a multi coloured behaviour, i.e. their colour changed upon oxidation form red (in the neutral state) to purple and sky blue (doped state). In the reduced state are pale blue. Based on the nanomechanical properties, the films synthesized under low number of scans (2 or 5 scans) are well adhered on the ITO electrodes, whereas a higher number of scans (20 scans) results to a thicker, more elastic and more soft film. The poly(2,5-bis(2-(3,4-ethylenedioxy)thienyl)pyridine) films synthesized under few scans are proposed for application in mulicoloured electrochromic devices, since they are well adhered on the ITO, they reversible switch their colour from red to sky blue and they are stable during the potential switch.
Keywords: EDOT copolymers, electropolymerization, cyclic voltammetry, electrochromism,
nanomechanical properties.
1. INTRODUCTION
1960s. Nowadays, this effect has been observed not only in inorganic materials but also, and more importantly, in organic compounds such as dyes and conducting polymers (CPs) [1,2,4]. A variety of CPs has colours both in the oxidized and reduced states, since their band gap is in the visible region. By oxidation, the intensity of the π-π* transition decreases, and low energy transitions emerge to produce a second (or even more) colour [3,5]. By comparing CPs with inorganic EC materials, the former have many advantages over the latter, such as ease of processing, high optical contrast, faster switching times, cost effectiveness and hue modulability through functionalization [3,6,7]. These, combined with the fact that CPs can repeatedly undergo electrochemical doping/dedoping, makes them the most promising class of materials to be used in electrochromic devices (ECDs).
The value of the band gap of an EC polymer is the most important factor for controlling its optical properties. The most appropriate method for controlling the band gap is by using monomers that combine moieties with different electron affinities [8-10]. This can be achieved by copolymerization of appropriate comonomers or by electropolymerizing a monomer having electron donor-acceptor-donor (D-A-D) structure. The second way is more preferable, because it leads to more defined structures, avoiding defects [10-14]. Many multicoloured EC copolymers have been designed and synthesized. Usually, thiophene derivatives and especially 3,4-ethylenedioxythiophene (EDOT) are the one of the moieties. Specifically, copolymers with EDOT as electron donor moiety combined with various arylene units such as carbazole, benzene, napthalene, pyrene or pyridopyrazine, have been reported in the literature By changing the arylene unit, the band gap also changes and neutral copolymers with colours ranging from blue through purple, red, orange, green, and yellow have been obtained [1,10,12,13,15-21]. The electrochromic properties of these EDOT copolymers have received significant attention due to their wide range applications as result of their high electrical conductivity and high stability [3,10].
In the optoelectronic applications thin polymer films are used and their thickness still continues to decrease. However, the mechanical properties of these films have not been extensively studied, given that it is difficult to determine these properties with traditional testing techniques. Furthermore, in the most conventional applications of thin films (OPVs, OLEDs) the material do not carry any load (apart from its weight), thus the mechanical properties were considered of secondary importance. Nevertheless, there is a growing demand in applications where the devices will have to carry stresses (e.g. flexible plastic displays, e-paper), making necessary the estimation of the mechanical properties, such as elastic modulus and hardness. These properties of the deposited film depend on electropolymerization conditions, such as polymerization potential, electrolyte, number of scans, etc [22]. Apart from the theoretical studies, there are some methods for determining these properties based on bending of microbeams, but the most important technique is nanoindentation (NI) [23]. Through this method, it is possible to obtain the nanohardness (H) and Young’s modulus (E) values by indenting the film’s surface with a probe of a known geometry under various applied load.
properties of this copolymer have not been studied. The aim of this work was to synthesize stable polymer film that will switch its colour from red to sky blue for application in multicoloured ECDs. Additionally, given that EDOT is susceptible to oxidation due to its strong electron donor nature, the incorporation of a strong electron acceptor moiety (such as pyridine) into the macromolecules will lead to a more stable in air copolymer. Based on the electrochemical, electrochromic and nanomechanical properties the optimum conditions will be chosen for the construction of the device.
2. EXPERIMENTAL
2.1. Materials
2,5-bis(2-(3,4-ethylenedioxy)thienyl)pyridine, was synthesized starting from 3,4-ethylenedio-xythiophene (Sigma-Aldrich 483028). n-butyllithium solution (1.6 M in hexane, Sigma-Aldrich 18617), trimethyltin chloride (Sigma-Aldrich 146498) and 2,5-dibromopyridine were used as received.
Dichloromethane (DCM, anhydrous, Sigma-Aldrich 270997) and acetonitrile (ACN, anhydrous, Sigma-Aldrich 494445) were used directly without further purification. Tetrabutylammonium tetrafluoroborate (for electrochemical analysis, ≥ 99.0%, Fluka 86896) was dried at 120 oC under vacuum prior to use.
2.2. Instrumentation
Stille coupling was carried out in microwave oven (CEM Discover DU8107). The 2,5-bis(2-(3,4-ethylenedioxy)thienyl)pyridine was purified using ComniFlash (Teledyne ISCO) chromatography. High-resolution (500 MHz) 1H-NMR spectra were recorded on a UNITY INOVA 500 spectrometer from Varian at room temperature. Elemental analyses were obtained using a Thermo Scientific Flash EA 1112 CHNS/O Automatic Elemental Analyzer. The UV-Vis spectra were recorded by a Lambda 19-UV/VIS/NIR-spectrometer of PerkinElmer. Photoelectron spectroscopy was applied for the estimation of the HOMO energy levels using a Riken Keiki AC-2. The polymer was measured as film on ITO substrates in air. The scanning electron microscopy investigations (SEM) were carried out using a HITACHI S-4100 scanning electron microscope with a cold field emission cathode. The nanomechanical properties of the coatings were investigated by Hysitron Tribolab® nanomechanical test instrument.
2.3. Synthesis of 2,5-bis(2-(3,4-ethylenedioxy)thienyl)pyridine (2)
solution (1 M in hexane) were added dropwise and the resulting mixture was stirred at -50 °C for 1 h before allowing to warm to room temperature overnight. The solvent was removed by rotary evaporation and the residue was solved in dichloromethane and treated with saturated ammonium chloride solution. The organic layer was separated, washed with water, dried over MgSO4 and filtered.
The solvent was removed again to afford a yellow oil, which was stored at low temperature. This compound (1) was used without further purification (yield = 46.8 %).
The monomer 2,5-bis(2-(3,4-ethylenedioxy)thienyl)pyridine, Scheme 1, structure (2), (EPyrE) was synthesized by Stille coupling of (1) with 2,5-dibromopyridine. 610 mg (2 mmol) of (1), 189.5 mg (0.80 mmol) of 2,5-dibromopyridine and 24 mg (0.024 mmol) of tetrakis (triphenylphosphine)palladium were dissolved in anhydrous p-xylene in a glove box. Stille coupling was carried out in in a microwave oven with a heating step program (5 min at 120 oC, 5 min at 140 oC and 40 min at 170 oC). The resulting mixture was diluted by dichloromethane and washed with aqueous solution of sodium carbonate. The organic layer was separated, washed with water, dried over MgSO4 and filtered. The product was purified by Flash Chromatography using hexane and ethyl
acetate as eluent and the pure product is a yellowish white powder (yield = 38 %) with a melting point of 188 °C.
Scheme 1. Synthetic route of 2,5-bis(2-(3,4-ethylenedioxy)thienyl)pyridine and the corresponding polymer
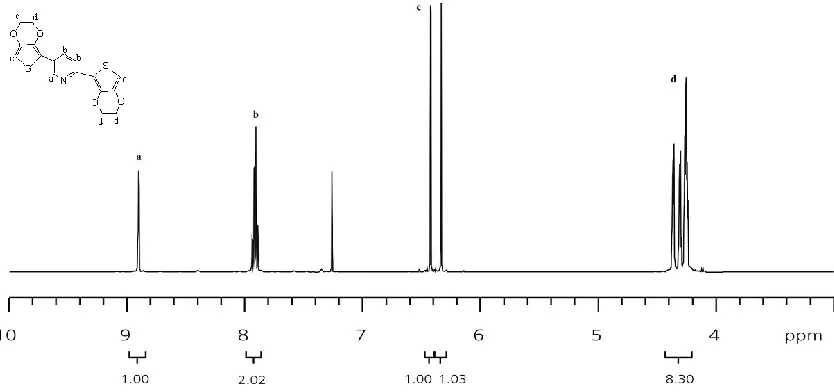
NMR spectrum of the monomer 2,5-bis(2-(3,4-ethylenedioxy)thienyl)pyridine (2), Figure 1 : δH
(ppm, CDCl3) : 8.87 (s, 1H), 7.92 (d, 2H), 6.42 (d, 2H) and 4.33 (t, 8H). The protons of thiophene ring
are at 6.42 ppm (α protons). The protons of pyridine are at 8.87 ppm (α protons) and at 7.92 ppm (β protons). Anal. calcd for C17H13NO4S2 (Mw 359.41 g/mol): C 56.81, H 3.65, N 3.90, O 17.81, S 17.84;
Figure 1.1H-NMR spectrum of monomer (2) in CDCl3.
2.4. Electrochemistry
Electrochemical synthesis (electropolymerization) and electrochemistry experiments were performed with a Cyclic EG&G Parc model 273 potentiostat controlled by an IBM P70 computer. An one-compartment electrochemical cell with a three electrode set up was used. An indium-tin oxide coated glass (ITO, Balzers, 30 nm fully oxidized ITO on SIO2 with a resistance 78 Ohm / sq, 2.5 x1.0
cm) or Pt plate (0.15 cm2) were used as working electrodes for the deposition of the films. A Pt wire or Pt mesh as counter electrode and Ag/AgCl (3M NaCl and sat. AgCl) as reference electrode. ITO electrodes were cleaned prior to use by sequential 10 min ultrasonication in acetone, water and isopropyl alcohol. After, they were further cleaned by exposure for 2 min on air plasma and were dried on a hot plate at 120 oC for 10 min.
The electropolymerization solution was a mixture of acetonitrile with dichloromethane (ACN:DCM = 1:1 v/v), with tetrabutylammonium tetrafluoroborate (TBABF4, 0.1 M) as supporting
electrolyte and the monomer 2,5-bis(2-(3,4-ethylenedioxy)thienyl)pyridine with concentration 1 mM. After the electropolymerization the polymer films were rinsed with ACN:DCM=1:1 v/v solution, in order to remove the residues of polymerization and the soluble oligomers and then they were dried with argon flow. The electrochemistry of the already formed films on ITO or Pt electrodes was carried out using the same electrode set-up in a monomer-free solution of TBABF4 (0.1 M) in acetonitrile. All
the electrochemistry experiments were performed at room temperature and prior to those, the solution was deoxygenated with nitrogen. The electrochemical cell was calibrated by the use of a ferrocene standard and the half-wave potential has been estimated to be 435 mV for this assembly.
2.5. Nanoindentation tests
indentation tests. The ability of the transducer to perform load is in the range of 1-10000 μΝ with a high load resolution of 1 nN. The limited penetration depth which can be recorded by the transducer is 3000 nm (μΝ) with a resolution of 0.04 nm. A three-sided pyramidal Barkovich diamond indenter (with an average radius of curvature about 100 nm) is used for the measurement of H and E values. A Scanning Probe Microscope (SPM) is integrated in the nanomechanical test instrument, in which a sharp probe tip moves in a raster scan pattern across a sample surface using a three-axis piezo positioner. The calibration process is conducted on fused quartz, prior to any experimental procedure. It is a standard material which is used to determine the tip radius (tip area function) [25]. The tests were carried out in a clean area environment with ~ 45% humidity and 23 oC ambient temperature [26]. The Oliver and Pharr method was used in order to specify the stiffness (S), hardness (H) and reduced modulus (Er) values, based on the half-space elastic deformation theory [27,28]. These
expressions for defining the elastic modulus from indentation tests are calculated by Sneddon’s elastic contact theory [29].
Indentation tests were performed on poly(2,5-bis(2-(3,4-ethylenedioxy)thienyl) pyridine films on ITO, deposited by cyclic voltammetry in the potential range 0 to 1.4 V with scan rate 50 mV/s for different number of scans (2, 5 and 20 scans). For the nanomechanical tests the displacement control mode was used since the film thickness was low, in order to measure the applied force needed for indenting the sample’s surface at certain displacements. The thickness of the film deposited by 2 scans (Film A) was low, approximately in the range of 10 nm (estimated by the charge during electropolymerization) and that of the film deposited by 5 scans (Film B) was 30 nm (estimated by SEM). In order to avoid the effect of the ITO substrate to the nanomechanical properties, a thicker film was synthesized under 20 scans (Film C) with 100 nm thickness (estimated by SEM).
2.6. Spectroelectrochemistry
Spectroelectrochemical data were recorded on an 8453 UV− 358 visible Spectophotometer (Agilent, Germany) connected to a computer. The potential was obtained with the potentiostat PGSTAT 302N from AUTOLAB, controlled by a PC running under GPES from Windows, version 4.9 (ECO Chemie B.V.). The polymers films on ITO electrodes were measured in a cell of 1 cm pathlengh. A three electrode cell assembly was used, where the working electrode was the ITO/polymer system, a Pt wire as counter and Ag/AgCl (2 M KCl / EtOH) as a reference electrode. The measurements were carried out at room temperature under Ar. The UV-Vis spectra were measured between 0 V to +1.8 V and the titration was recorded with + 0.1 mV and 20 sec equilibration time.
3. RESULTS AND DISCUSSION
3.1. Electropolymerization of 2,5-bis(2-(3,4-ethylenedioxy)thienyl)pyridine
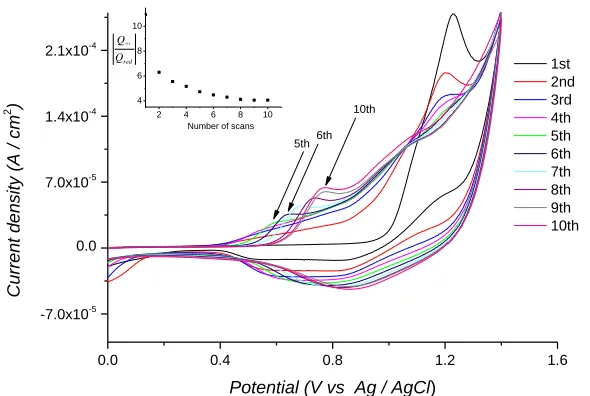
scan and onwards the oxidation due to the doping of the already formed polymer starts at 0.55 V and it can be clearly seen as a peak after the 4th scan. The reduction of the film (dedoping) is appeared as a broad peak at around 0.85 V. The oxidation peak of the polymer shifts in the anodic direction and the reduction peak also. This electrochemical behaviour indicates that a conducting polymer film was formed. The current of oxidation (anodic) and reduction (cathodic) peak of the film increases with increasing the number of scans. This indicates not only the formation of an electroactive polymer film on the surface of ITO electrode, but also an increase in the thickness of the film. The polymer growth was continued until the 30th scan and then is practically stops.
0.0 0.4 0.8 1.2 1.6
-7.0x10⁻⁵
0.0 7.0x10⁻⁵
1.4x10⁻⁴
2.1x10⁻⁴
2 4 6 8 10 4
6 8 10
Number of scans
red
Q
Qo x
10th 6th Curr en t d en sity
(A / cm
2 )
Potential (V vs Ag / AgCl)
1st 2nd 3rd 4th 5th 6th 7th 8th 9th 10th 5th
Figure 2. Cyclic voltammograms during the electropolymerization of (2) with 1 mM in 0.1 M TBABF4, in MeCN:CH2Cl2 (1:1 v/v) on ITO electrode (area: 1.5 cm2), scan rate 50 mV/s, vs.
Ag/AgCl
After the end of the 5th scan, a polymer deposition can be clearly seen, having red purple colour. The ratio of the oxidation to reduction charge (Qox/Qred) was calculated for each scan, inset figure in
Figure 1. Starting from a high value of Qox/Qred = 11 in the 1st scan, the reduction charge starts to
increases and at 5th scan reaches the value of 4.7, this indicates that the film formed is partially reduced.
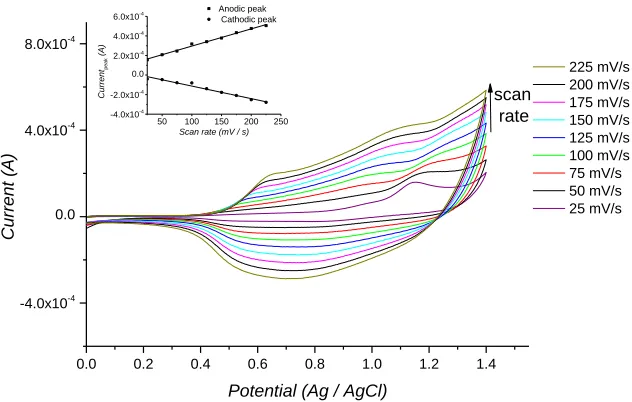
The effect of the potential scan rate in the electropolymerization of (2) was investigated using different scan rates, from 25 mV/s to 225 mV/s, Figure 3. In this figure the dependence of the redox couple due to oxidation (at 1.1 V) and reduction (0.7 V) of the monomer is shown. The current in the anodic peak, Ipa and in cathodic one, Ipc increase with the increasing the number of scans and their
current depend linearly on the scan rate, inset figure in Figure 3. For a reversible peak controlled by charge transfer, the difference between the anodic peak potential and cathodic peak one, ΔE= Epa-EpC
should be 59 mV/n, where n is the number of electron transferred (i.e. 59 mV for fast one electron process [30,31]. Moreover, the absolute value of the current in anodic peak to the corresponding cathodic c
p a p I I
[image:7.596.138.433.227.425.2]
not affected from the scan rate. In the case of (2), Epa-EpC is much higher than 59 mV, and the c
p a p I I is between 2 and 4. The Epa-Epc is associated with ion transport resistance involved in the redox reactions
doping-dedoping. It gives information about polymer thickness. Namely, if polymer thickness is high, electron transfer between the polymer and the electrolyte will be slow. The value ΔE value generally increases as the polymer deposition on the film increases [32]. Therefore, even though there is a linear dependence of Ipa and Ipc on the scan rate, the peak is not reversible. This means that the polymer
formed and doped during the anodic direction is stable on the electrode after dedoping (i.e. in the cathodic direction), as well as its thickness increases with the number of scans.
0.0 0.2 0.4 0.6 0.8 1.0 1.2 1.4
-4.0x10⁻⁴ 0.0 4.0x10⁻⁴
8.0x10⁻⁴
50 100 150 200 250 -4.0x10⁻⁴
-2.0x10⁻⁴
0.0 2.0x10⁻⁴
4.0x10⁻⁴
6.0x10⁻⁴ Anodic peak
Cathodic peak
Curre
ntpeak
(A)
Scan rate (mV / s)
225 mV/s 200 mV/s 175 mV/s 150 mV/s 125 mV/s 100 mV/s 75 mV/s 50 mV/s 25 mV/s Curr en t ( A)
Potential (Ag / AgCl)
scan rate
Figure 3. Cyclic voltammograms of the electropolymerization of (2) with concentration of 1 mM in 0.1 M TBABF4, in MeCN:CH2Cl2 (1:1 v/v) on ITO electrode (area: 1.5 cm2), under different
scan rates vs. Ag/AgCl. The inset Figure shows the dependence of the anodic (1.1 V) and the cathodic peak (0.7 V) currents versus the scan rate.
3.2 Electrochemistry of polymer films
For an application to ECDs, it is important to have a film that switches reversible between doping/dedoping process. Figure 4a shows the electrochemical behavior of an already formed film on ITO (synthesized by scanning the potential form 0 to 1.4 V, scan rate 50 mV/s, 5 scans,) at different scan rates from 25 to 300 mV/s. For these measurements, a solution of 0.1 M TBABF4 in acetonitrile
[image:8.596.142.458.248.449.2]
0.0 0.2 0.4 0.6 0.8 1.0 1.2 1.4 1.6 -3.0x10⁻⁴
-2.0x10⁻⁴ -1.0x10⁻⁴ 0.0 1.0x10⁻⁴ 2.0x10⁻⁴ 3.0x10⁻⁴
Curr
en
t (
A)
Potential (V vs Ag / AgCl)
300 mV/s 275 mV/s 250 mV/s 225 mV/s 200 mV/s 175 mV/s 150 mV/s 125 mV/s 100 mV/s 75 mV/s 50 mV/s 25 mV/s
scan rate
Figure 4a. Cyclic voltammograms of the (3) polymer film on ITO electrode at different scan rates between 25 mV/s and 300 mV/s. A monomer-free solution of 0.1 M TBABF4 in acetonitrile
was used. The ready film had synthesized by scanning the potential form 0 to 1.4 V, scan rate 50 mV/s, for 5 scans on ITO electrode.
This indicate that the electrochemical process of doping/dedoping is reversible and not diffusion limited [19,33], even at high scan rates. Concerning the ratio of c
p a p I I
is close to 1 (aprox 1.3) and the Epa-Epc= 150 mV, and not 59 mV, but it is normal for a ready film redox behavior.
0 50 100 150 200 250 300
-2.0x10⁻⁴ -1.0x10⁻⁴ 0.0 1.0x10⁻⁴ 2.0x10⁻⁴ 3.0x10⁻⁴
Curr
en
tpeak
(A)
Scan rate (mV/s)
[image:9.596.129.462.99.313.2]Anodic peak at 0.65 V Anodic peak at 1.0 V Cathodic peak at 0.85 V
[image:9.596.124.427.503.725.2]
3.3. Optical and electrochemical properties
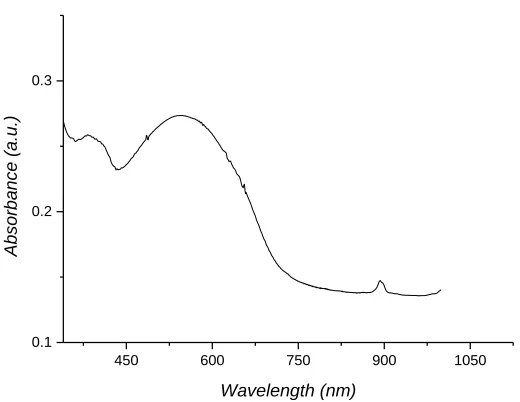
Figure 5 presents the UV-Vis spectra of the polymer film (3) deposited on ITO electrode. The film was synthesized by scanning the potential form 0 to 1.4 V, scan rate 50 mV/s, for 5 scans on ITO electrode and then dedoped in a monomer-free solution. The absorption maximum (λmax) for the
neutral polymer was centred at 540 nm, whereas for the monomer EPyrE (2) at 356 nm (Table 1). The optical band gap Eg of polymer was calculated from the onset absorption wavelength, λonset (680 nm)
1.82 eV.
450 600 750 900 1050
0.1 0.2 0.3
Absor
ba
nce
(a
.u.
)
[image:10.596.160.420.219.420.2]Wavelength (nm)
Figure 5. UV-Vis spectrum of polymer film deposited on ITO electrode at the neutral state (the film was synthesized by scanning the potential form 0 to 1.4 V, scan rate 50 mV/s, for 5 scans, on ITO electrode and then dedoped in a monomer-free solution).
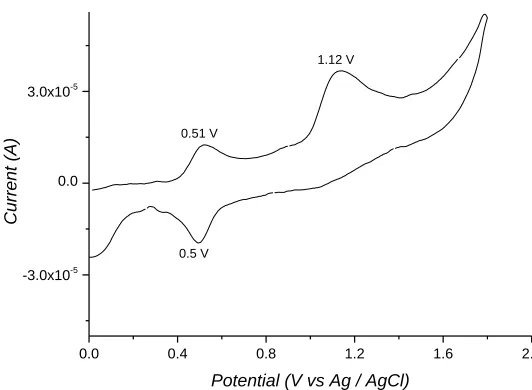
Cyclic voltammetry is a very well-known method to characterize the electron transfer activity of electroactive films. From the cyclic voltammograms the electrochemical redox behavior of the polymer film was studied and the HOMO and LUMO energy levels were estimated from the peaks [34]. Figure 6 shows the cyclic voltammogram of the already formed film on Pt electrode in monomer-free solution of 0.1 M TBABF4 in acetonitrile with scan rate 20 mV/s. The film had synthesized by
scanning the potential form 0 to 1.4 V, scan rate 50 mV/s, for 5 scans. Two oxidation peaks are shown, at 0.51 V and 1.12 V and the corresponding reduction peaks at 0.5 V and 1.03 V. The first redox couple seems to be reversible and can be attributed to p-doping of the molecule and its corresponding dedoping. The HOMO energy level was calculated as EHOMO = -5.31 eV.
0.0 0.4 0.8 1.2 1.6 2.0
-3.0x10⁻⁵
0.0 3.0x10⁻⁵
Curr
en
t (
A)
Potential (V vs Ag / AgCl)
0.51 V
1.12 V
[image:11.596.149.415.91.286.2]0.5 V
Figure 6. Cyclic voltammogrmas of polymer film (3) on Pt electrode in monomer-free solution of 0.1 M TBABF4 in acetonitrile, scan rate 20 mV/s. The ready film had synthesized by scanning the
potential form 0 to 1.4 V, scan rate 50 mV/s, for 5 scans, on Pt electrode. Only oxidation direction.
It is notice that the LUMO band could not be determined by cyclic voltammetry, given that after -1.5 V the film was peeled off from the electrode. Indirectly, the LUMO band determined using the optical band gap and the HOMO band from CV, as ELUMO= - 3.49 eV. All the data are summarized
in Table 1, where also the values for 1,4-bis(2-(3,4-ethylenedioxy)thienyl)benzene,(EBE) and the corresponding polymer, PEBE are presented [15].
Table 1. Absorption maximum λmax, onset absorption wavelength λonset, HOMO, LUMO energy levels
and optical band gap Eg of EPyrE, EBE and the corresponding polymers PEPyrE and PEBE
Material λmax
a
(nm)
λonset
a
(nm)
Eg b
(eV)
EHOMO
(eV)
ELUMO e
(eV)
EPyrE 356 400 3.10
EBE 347 445 2.79
PEPyrE 540 680 1.82 -5.31c
-5.41d
-3.49
PEBE Ref.15 511 645 1.92 -4.58c -2.66
a: UV-Vis of EPyrE and EBE were measured from solution of CHCl3 and CH2Cl2, respectively and
PEPyrE and PEBE as solid films b: Estimated from λonset
c: Estimated by cyclic voltammetry
d: Estimated by Photoelectron spectroscopy, AC-2.
Comparing the polymers PEPyrE and PEBE, they have the same electron donor structure, i.e. EDOT, and the first one has an electron acceptor, i.e. pyridine and the second one benzene, which is neutral (neither electron donor neither electron acceptor properties). The influence of the introduction of pyridine as an acceptor in comparison to the neutral benzene in the molecule is drastically shown in the HOMO and LUMO energy levels. In the case of the pyridine ring the HOMO energy level is shifted of about 0.7 eV to more negative values and the LUMO energy level of about 0.8 eV also to more negative values. That means in the case of oxidation the donation of electrons is hindered but accepting of electrons is relieved.
3.4. Electrochromic properties: Spectroelectrochemistry
Spectroelectrochemistry is a really useful tool to investigate the changes in optical properties of an electrochromic polymer upon voltage changes. The polymer film on ITO electrode (synthesized by scanning the potential form 0 to 1.4 V, scan rate 50 mV/s, for 5 scans) was underwent a stepwise potential scan from -1 up to +1.8 V in a monomer free solution of 0.1 M TBABF4 in acetonitrile. The
in situ UV-Vis spectra were recorded and they are presented in Figure 7. At the neutral state the polymer exhibits the main band at 544 nm due to the π-π* transitions. As the potential increases, the typical evolution spectra for p-doping are formed. It is well known that the oxidation of an electrochromic material will produce radical cations (polarons) and further oxidation produce dications (bipolarons), allowing new electronic transition thereby changing absorption spectra.
450 600 750 900 1050
0.0 0.1 0.2 0.3 0.4 0.5 0.6 0.7
- 1 V -0.9 V -0.7 V -0.5 V 1.8 V 1.7 V 1.6 V 1.5 V 1.4 V 1.3 V 1.2 V 1.1 V 0.9 V 0.8 V 0.7 V 0.6 V 0.4 V 0.3 V 0.1 V 0 V
Absor
ba
nce
[image:12.596.154.459.435.635.2]Wavelenght (nm)
Figure 7. Spectroelectrochemical spectra of polymer film (3) on ITO in the neutral and oxidized states, in 0.1 M TBABF4 in acetonitrile at several potential from -1.0 to 1.8 V.
[image:13.596.156.422.176.478.2]
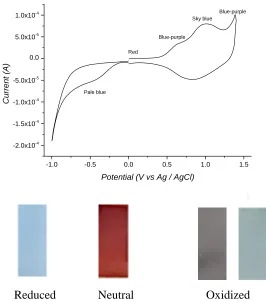
and reduction and this trend is a significant trait of CPs in electrochromic devices and displays. Starting form red (in the neutral) state, become blue-purple at 0.6 V and sky blue at around 1 V (intermediate oxidized, doped states) and after 1.2 V deep blue purple. In the reduced state is pale blue, Figure 8.
-1.0 -0.5 0.0 0.5 1.0 1.5
-2.0x10⁻⁴
-1.5x10⁻⁴
-1.0x10⁻⁴ -5.0x10⁻⁵
0.0 5.0x10⁻⁵
1.0x10⁻⁴
Pale blue Red
Blue-purple
Curr
en
t (
A)
Potential (V vs Ag / AgCl)
Sky blue Blue-purple
Reduced Neutral Oxidized
Figure 8. Cyclic voltammograms of polymer film (3) on ITO, in 0.1 M TBABF4 in acetonitrile, scan
rate 50 mV/s. The ready film had synthesized by scanning the potential form 0 to 1.4 V, scan rate 50 mV/s, for 5 scans, on ITO electrode
3.5. Stability
The stability of the electrochromic polymer film for many switchings between oxidized and neutral states is very important for an application. In order to investigate the stability, a polymer film deposited on ITO electrode (by scanning the potential form 0 to 1.4 V, scan rate 50 mV/s, for 5 scans) was switched very fast, with a scan rate of 500 mV/s between 0 and 1.4 V in a monomer free solution of 0.1 M TBABF4 in acetonitrile. The charge involved during the doping-dedoping process was
3.6. Morphology and nanomechanical properties of the films 3.6.1. Morphology
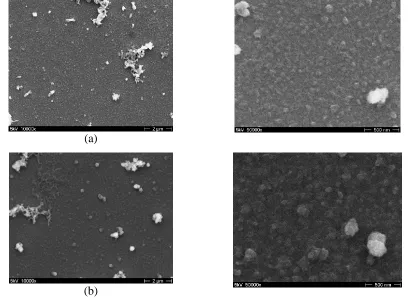
The morphology of the films examined by SEM, Figure 9. The films have an accumulation state of clusters of granules and shows porous structure. The porous structure of the film facilitates the contact with the electrolyte for the doping/dedoping process, thus it enhance the electrochromic properties [15]. Film B is more uniform than Film C and macroscopically seems to have a good adhesion on the electrode.
(a)
[image:14.596.103.269.226.521.2] [image:14.596.94.506.228.526.2](b)
Figure 9. SEM micrographs of film deposited on ITO by scanning the potential form 0 to 1.4 V, scan rate 50 mV/s, for (a) 5 scans, Film B and (b) 20 scans, Film C
3.6.2. Load-unload curves
scans results to a thicker, more elastic and more soft film (lower hardness and elastic modulus values) film.
0 5 10 15 20 25 30 35
0 50 100 150 200
0 5 10 15 20 25 30 35
0.0 0.5 1.0 1.5 2.0 2.5 Film A Film B
Indentation depth (nm)
Load
(
μΝ
)
(a)
Indentation depth (nm)
Load
(
μΝ
)
Film C
0 20 40 60 80 100 120 140
0 500 1000 1500
0 20 40 60 80 100 120 140 160
0 5 10 15 20
25 Film A
Film B
Indentation depth (nm)
Load
(
μΝ
)
(b)
Indentation depth (nm)
Lo ad ( μΝ ) Film C
Figure 10. Load-unload curves at (a) 30 and (b) 130 nm for Film A, B and C. The films were deposited on ITO electrodes by scanning the potential form 0 to 1.4 V, scan rate 50 mV/s, for 2, 5 and 20 scans (Film A, B, C, respectively)
3.6.3. Hardness and elastic modulus values
In Figure 11a,b the H and E values of the films are presented as a function of indentation depth. It is observed that Film A and B have higher H and E values compared to Film C. Similarly low values have been reported for EDOT depositions with thickness of some μm [35]. It should be noticed that the H and E values for low indentation depths contains the error due to the surface roughness that affect the calculation of the real contact area. Inset in Figure 11a,b presents SPM images the films, where the roughness surface of Film A at low indentation depths can be observed.
[image:15.596.57.530.133.295.2]
Figure 11. (a) Hardness (H), (b) elastic modulus (E) values, (c) H/E and (d) H3/E2 ratios of the deposited films as a function of indentation depth. Inset to the graphs SPM images of Film A and Film C are presented.
4. CONCLUSION
The monomer having D-A-D structure, 2,5-bis(2-(3,4-ethylenedioxy)thienyl)pyridine, was successfully synthesized and electropolymerized onto ITO electrodes by cyclic voltammetry in the potential range 0 to 1.4 V (vs Ag/AgCl). The electrochemical, optical, electrochromic, nanomechanical properties, as well as the stability and morphology of the films were studied. The polymer film exhibits two oxidation peaks, at 0.65 V and at 1.0 V and one reduction at 0.80 V. These peaks depend linearly on the scan rate, indicate that the electrochemical process of doping/dedoping is reversible. This trait is important for an application in ECDs. The HOMO energy level of the films was estimated as EHOMO = -5.31 eV, the ELUMO= - 3.49 eV and the band gap Eg as 1.82 eV. At the neutral state the
[image:16.596.73.501.72.368.2]
thin films, following substrate’s deformation mode, whereas a higher number of scans (20 scans) results to a thicker, more elastic and more soft film (lower hardness and elastic modulus values) film. Moreover, the thin films have higher wear resistance compared to the thick one (deposited under 20 scans) and especially for a low indentation depths.
The poly(2,5-bis(2-(3,4-ethylenedioxy)thienyl)pyridine) films synthesized under few scans are well adhered on the ITO electrode, they reversible switch their colour from red to sky blue, are stable and they will be a good candidate for application in mulicoloured electrochromic device.
ACKNOWLEDGEMENTS
This research is a part of the NEMEDES project which is funded by the European Commission in the framework of a Marie Curie Scholarship (Fellow : Dr. Despina Triantou), FP7-PEOPLE-2011-IEF, Marie Curie Actions, Intra-European Fellowships (IEF),
http://www.iap.fraunhofer.de/de/Forschungsbereiche/Funktionale_Polymersysteme/polymere_und_ele ktronik/elektroaktive_polymere1.html
References
1. P.M.S. Monk, R.J. Mortimer and D.R. Rosseinsky, Conjugated conducting polymers. In Electrochromism and Electrochromic Devices, Cambridge University Press. Cambridge UK (2007).
2. I.F. Perepichka, D.F. Perepichka, M.A. Invernale, M. Acik and G.Y. Sotzing, Thiophene-based electrochromic materials. In Handbook of Thiophene-Based Materials: Applications in Organic Electronics and Photonics, ed. eds I.F. Perepichka and D.F. Perepichka, John Wiley & Sons, Ltd, Chichester, UK. (2009), doi: 10.1002/9780470745533.ch20.
3. L. Beverina, G.A. Pagani and M. Sassi, Chem. Commun, 50 (2014) 5413. 4. W.M. Kline, R.G. Lorenzini and G.A. Sotzing, Color Technol, 130 (2014) 73.
5. K. Wang, T. Zhanga, H. Hua, W. Yanga and Y. Shiba, Electrochim. Acta, 130 (2014) 46. 6. S. Toksabay, S.O. Hacioglu, N.A. Unlu, A. Cirpan and L. Toppare, Polymer,22 (2014) 3093. 7. G. Sonmez, Chem. Commun, 42 (2005) 5251.
8. P. Ledwon, A. Brzeczek, S. Pluczyk, T. Jarosz, W. Kuznik, K. Walczak and M. Lapkowski, Electrochim. Acta, 128 (2014) 420.
9. G. Xu, J. Zhao, C. Cui, Y. Hou and Y. Kong, Electrochim. Acta, 112 (2013) 95.
10.L.B. Groenendaal, F. Jonas, D. Freitag, H. Pielartzik and J.R. Reynolds, Adv. Mater. 12 (2000) 481. 11.Q. Du, Y. Wei, J. Zheng and C. Xu, Electrochim. Acta, 132 (2014) 258.
12.I. Yagmur, M. Ak and A. Bayrakceken, Smart Mater. Str. 22 (2013) 115022(9p) 13.K. Kawabata and H. Goto, Synth. Met. 160 (2010) 2290.
14.K. Zhang, B. Tieke, J.C. Forgie, F. Vilela and P.G. Skabara, Macromolecules, 45 (2012) 743. 15.W. Yang, J. Zhao, C. Cui, Y. Kong, X. Zhang, P. Li, J. Solid State Electrochem. 16 (2012) 3805. 16.S. Tarkuc, E.K. Unver, Y.A. Udum and L. Toppare, Europ. Polym. J. 46 (2010) 2199.
17.C. Xu, J. Zhao, J. Yu and C. Cui, Electroch. Acta, 96 (2013) 82. 18.C.J, DuBois and J.R. Reynolds, Adv. Mat. 14 (2002) 1844.
19.D. Irvin, C.J. Dubois and J.R. Reynolds, Chem. Commun. 20 (1999) 2121. 20.G. Sonmez, H. Meng, Q. Zhang and F. Wudl, Adv. Funct. Mater. 13 (2003) 726.
21.E.K. Unver, S. Tarkuc, Y.A. Udumd, C. Tanyeli and L. Toppare, Org. Electronics. 12 (2011) 1625. 22.P. Herrasti, L. Dıaz, P. Ocón, A. Ibáñez and E. Fatas, Electrochim. Acta, 49 (2004) 3693.
24.C. Wang, J.L. Schindler, C.R. Kannewurf and M.G. Kanatzidis, Chem. Mater. 7 (1995) 58. 25.H. Bei, E.P. George, J.L. Hay and G.M. Pharr, Phys. Rev. Let. 95 (2005) 045501.
26.C. Charitidis, E.P. Koumoulos, V. Nikolakis and D.A. Dragatogiannis, Thin Solid Films, 526 (2012) 168.
27.R.B. King, Inter. J. Solid Struct. 23 (1987) 1657. 28.W.C. Oliver and G.M. Pharr, J. Mat. Res. 7 (1992) 1564.
29.I.N. Sneddon, Mathem. Proceedings Cambridge Philosophical Soc. 44 (1948) 492. 30.P.H. Rieger, Electrochemistry, 2nd ed Chapman & Hall, New York (1994).
31.R. Greef, R. Peat, L.M. Peter, D. Pletcher and J. Robinson, Instrumental methods in
electrochemistry, ed. Kemp TJ, Southampton electrochemistry group, Ellis Horwood Limited, Chichester (1985).
32.S. Sezgin, M. Ates, E. Parlak and S. Sarac, Int. J. Electrochem. 7 (2013) 1093. 33.U. Abaci, H.Y. Guney and U. Kadiroglu, Electrochim. Acta, 96 (2013) 214.
34.S. Admassie, O. Inganas, W. Mammo, E. Perzon and M.R. Andersson, Synth. Met. 156 (2006) 614. 35.J. Jang and D.C. Martin, J. Mater. Res. 5 ( 2006) 1124.
36.T.L. Oberle, J. Metal, 3 (1951) 438.
37.C. Rebholz, A. Leyland, J.M. Schneider, A.A. Voevodin and A. Matthews, Surf. Coat. Technol, 120-121 (1999) 412.