Int. J. Electrochem. Sci., 11 (2016) 5877 – 5890, doi: 10.20964/2016.07.77
International Journal of
ELECTROCHEMICAL
SCIENCE
www.electrochemsci.org
Corrosion Behavior of Two cp Titanium Dental Implants
Connected by Cobalt Chromium Metal Superstructure in
Artificial Saliva and the Influence of Immersion Time
Ala’a AlOtaibi1,2
, El-Sayed M. Sherif1,3,4, Spiros Zinelis5,1, Youssef S. Al Jabbari1,2,*
1
Dental Biomaterials Research and Development Chair, College of Dentistry, King Saud University
2
Department of Prosthetic Dental Science, College of Dentistry, King Saud University, P.O. Box: 60169, Riyadh 11545, Saudi Arabia
3
Center of Excellence for Research in Engineering Materials (CEREM), Advanced Manufacturing Institute (AMI), King Saud University, P.O. Box: 800, Riyadh 11423, Saudi Arabia
4
Electrochemistry and Corrosion Laboratory, Department of Physical Chemistry, National Research Centre (NRC), Dokki, 12622 Cairo, Egypt
5
Department of Biomaterials, School of Dentistry, National and Kapodistrian University of Athens, Athens, Greece.
*
E-mail: [email protected]
Received: 21 March 2016 / Accepted: 17 May 2016 / Published: 4 June 2016
In this study, we invistegate the effect of connecting two similar cp titanium implant fixtures and the immersion time on the electrochemical behavior of these implant fixture system using Straumann® (Institute Straumann, Basel, Switzerland) coupled with cobalt chrome framework in artificial saliva. The two implant fixtures had the same composition, diameter, length and surface treatment. The corrosion measurements were carried out using open-circuit potential, cyclic potentiodynamic polarization, electrochemical impedance spectroscopy, and chronoamperometric current-time measurements. The surface morphology and the elements analysis for the corroded samples were investigated using scanning electron microscope and energy dispersive X-ray analyzer. The effect of prolonging the period of immersion time on the corrosion of the couple in the saliva from 1 to 24 and further to 48 h before measurements was also reported. It has been found that the tested implant system has high passivation against corrosion and the intensity of its uniform corrosion increases with increasing the immersion time in the artificial saliva from 1 to 24 and further to 48 h. This was confirmed by the remarkable increase in the values of corrosion current and the decrease in the polarization resistance values over time. On the other hand, the severity of pitting corrosion was noticed to decrease with time, which was indicated via decreasing the area of hysteresis loop and shifting the values of the protection potential to more positive direction.
1. INTRODUCTION
The use of dental implant in replacing missing teeth becomes an integral treatment modality in dentistry. Different materials have been employed for dental implants. Commercially pure titanium (CP Ti) and titanium-aluminum-vanadium alloy (Ti-6Al-4V) are most widely used biomaterial [1]. Those materials became popular due to chemical resistance, mechanical strength, low toxicity, lightness and excellent biocompatibility [2]. Ti and its alloys have the tendency to react with oxygen to form a stable oxide layer (TiO2) [3]. This oxide layer is responsible for chemical stability and
corrosion resistance of titanium [4]. The types of corrosive reactions that occur in the oral cavity are electrochemical (wet corrosion). Electrochemical corrosion requires the presence of water or other electrolytes. In the oral cavity saliva plays that role. There are various types of corrosion that can be developed in the oral cavity such as galvanic, fretting, pitting and uniform corrosion [5]. Galvanic corrosion is a phenomenon attributed to a potential difference between two different metallic materials connected through a circuit and current flows from more active metal (anode) to the more noble metal (cathode) in a corrosive environment like saliva. Titanium is anodic to noble alloys and cathodic to base metal alloys [5].
Titanium implants coexist with different metallic dental superstructures and other dental restorations in a patient mouth. This complexity can be linked to the occurrence of galvanic corrosion creating galvanic current, which passes through the surrounding tissues causing sharp pain when exceeds 20 mA [6]. Extensive release of metal ions from a prosthetic device can result in adverse biological reactions and can lead to mechanical failure of the device itself [7]. According to Geis-Gerstorfer et al., the galvanic corrosion of dental devices may adversely affect the surrounding tissues in two mechanisms: 1) the biological effects, which may result from the dissolution of alloys 2) the galvanic cell that causes current flow and could also cause bone destruction [8]. Venugopalan and Lucas [9] found that noble alloys such as gold, silver, and palladium-based alloys coupled to titanium are least susceptible to galvanic corrosion.
A study in 2013 [10] evaluated and compared the electrochemical corrosion behavior CP Ti and Ti6Al4V when coupled to the following commercially available noble dental alloys (Au alloys Ag alloys and Pd alloys) It was found that metallic coupling between Au-based alloys and CP Ti delivered the lowest galvanic currents (4μA cm-2
), while coupling Ag alloys with CP Ti delivered currents that was 10times higher (44 μA cm-2) [10].
Additionally, materials such as Pontallor (Au-based), Ternary Ti, R800 (Co-Cr alloy) and Jelstar (Ag-Pd alloy), respectively were found to have the highest galvanic corrosion resistant alloys when coupled with titanium implant abutment. On the other hand, RCS (Ni–Cr) alloy was found to be highly susceptible to galvanic corrosion [11]. Those findings have been supported by many other studies [12-15]. Additional other studies evaluated the electrochemical properties of superstructures coupled to a titanium implant. Photomicrographs after electrochemical testing showed crevice or pitting corrosion at the junctional gap as well as at the superstructure surface [13].
implant is used for treatment the single missing tooth. However, in most of the partially edentulous dental patient and complete edentulous patient a prosthodontist will treat a patient by connecting two or more implant fixtures utilizing a single metal superstructure. In such scenario, alteration of corrosion properties of the two implants may occur. Corrosion and electrochemical properties have not been studied previously for two implants connected by single metal superstructure.
This study aims at evaluating the corrosion behavior in artificial saliva of the couple between two Straumann® implant fixture, which were connected by a single Co-Cr metallic superstructure.
2. MATERIALS AND METHODS
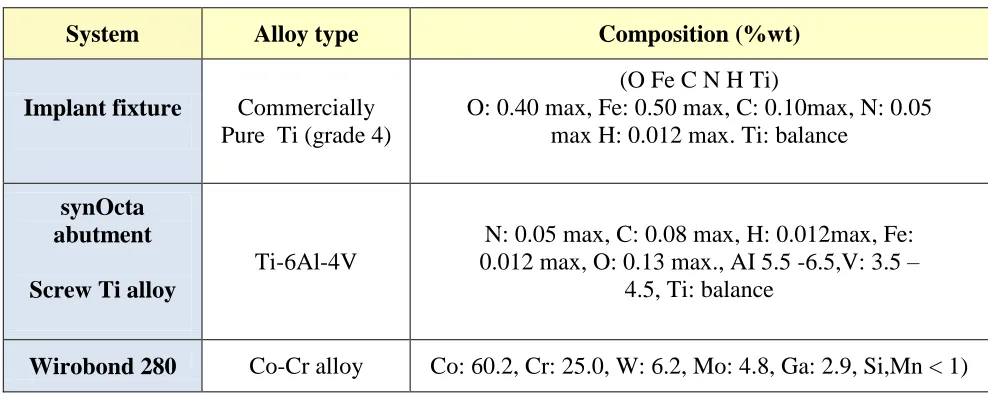
Two dental implant fixutres made of Tapered effect Straumann® (Institut Straumann, Basel, Switzerland) with SLA® surface were investigated in this study. The diameter, length, and surface treatment selected for the fixtures were to simulate the commonly used dimensions in routine clinical procedures. The nominal elemental composition for the implant fixture, screw, abutment and superstructure are presented in Table 1.
2.1. Fabrication of Master Models and Framework:
Resin blocks were made in the following dimensions: 20 mm in height, 30 mm in width and 10 mm in thickness. Two 2mm deep holes drilled using a 2mm bur (Ferraro Engineering, Hereford, AZ). Two of them were placed parallel to each other with a distance of 10 mm between the two holes indicates the location of implants. A custom-made rubber model former (Deguform plus, Dentsply company, Germany) of the resin block was fabricated. The model former was lubricated with Vaseline (Equate Nursery Jelly, Wal-Mart Stores. Inc) and autopolymerizing acrylic resin (Orthoresin Clear, DeguDent GmbH, Germany) was poured into it and allowed to set. Twelve resin blocks poured using the same custom rubber former.
The resin blocks were held in a vertical milling machine (Ferraro Engineering, Hereford, AZ), and holes matching the depth, diameter and angulations of the implants were made. A 4mm twist drill (Ferraro Engineering, Hereford, AZ) was used to prepare the holes (4x10mm). The two implants were placed at 50 RPMs (Motor unit Nobel Biocare USA, Yorba Linda, CA) into the resin block leaving only 3 exposed threads (2mm).[S1]
[image:4.596.53.547.237.434.2]
casting process, an asbestos liner was laid out on the inner surface of the casting rings. All bars were cast using Co-Cr alloy via 2-stage burnout cycle; i.e., heating up to 300ºC held for 30 minutes then heating again up to 650ºC held for 90 minutes. Conventional lost wax technique, which is used with centrifugal casting machines, was performed. Cooling down the specimens to room temperature after casting was allowed. Air chisel was used to remove the bulk of investment followed by ultrasonic cleaning, air abrasion and polishing. The cast bar screwed to the implants using titanium Occlusal screw (SCS Occlusal screw, institute Straumann, Basel, Switzerland).
Table 1. Alloys composition in wt% for implant system component and the Co-Cr metal bar.
System Alloy type Composition (%wt)
Implant fixture Commercially Pure Ti (grade 4)
(O Fe C N H Ti)
O: 0.40 max, Fe: 0.50 max, C: 0.10max, N: 0.05 max H: 0.012 max. Ti: balance
synOcta abutment
Screw Ti alloy
Ti-6Al-4V
N: 0.05 max, C: 0.08 max, H: 0.012max, Fe: 0.012 max, O: 0.13 max., AI 5.5 -6.5,V: 3.5 –
4.5, Ti: balance
Wirobond 280 Co-Cr alloy Co: 60.2, Cr: 25.0, W: 6.2, Mo: 4.8, Ga: 2.9, Si,Mn < 1)
2.2. Test solution
The employed electrolyte in this study was artificial saliva with a temperature of 37 °C and pH of 6.70. The chemical composition of the artificial saliva is shown in Table 2. The composition given in Table 1 is based on ISO/CD 10271 “Dental Metallic Materials-Corrosion Test Methods'' (ISO 2011). The pH value was determined by using pH meter and adjusted to pH 6.7 by adding drops of lactic acid when needed and diluted with distilled deionized water to a final volume of 1000 ml. The employed pH meter was calibrated by using a series of known buffer solutions prior to testing. The temperature of the solution was controlled by the use of a thermostat. The artificial saliva was freshly prepared every time before running the experiment.
Table 2. Chemical compositions of the artificial saliva.
Compound Urea NaHCO3 KCl NaCl KSCN Na2HPO4 K2HPO4 Lactic acid
2.3. Corrosion test measurements
A conventional three-electrode electrochemical cell was used in this study. An Ag/AgCl acted as a reference electrode, the platinum foil as a counter electrode and our samples as the working electrode. An Autolab Potentiostat (Metrohm, Netherlands) run via the general purpose electrochemical software version 4.9 was used to perform the electrochemical. The open-circuit potential was measured versus time over a certain period of time. The cyclic potentiodynamic polarization (CPP) measurements were carried out by scanning the potential from -800 mV in the anodic direction to 1000 mV at a scan rate of 3mV/s.
The potential was rescanned again in the reverse direction till the backward current intersects with the forward one. The electrochemical impedance spectroscopy (EIS) measurements were performed at corrosion potentials over a frequency range of 100 kHz to 100 mHz, with an ac wave of 5 mV peak-to-peak overlaid on a dc bias potential, and the impedance data were collected using Powersine software at a rate of 10 points per decade change in frequency. Potentiostatic current–time experiments were carried out by applying a potential value of 500 mV versus Ag/AgCl for 60 minutes. All electrochemical measurements were carried out after immersing the samples in the artificial saliva for 1, 24, and 48 h at room temperature. All experiments were performed 3 times using a new portion of the solution and a fresh surface of the implant fixtures. For morphology studies, SEM micrographs were collected using a scanning electron microscope (JEOL, Japan) at several defined areas of the two implant fixtures and at different magnifications. The elemental analysis of the corroded surface was done using an energy dispersive X-ray analyzer coupled to the SEM device.
3. RESULTS AND DISCUSSION
3.1. Open circuit potential (OCP) measurements
0 600 1200 1800 2400 3000 3600 4200 4800 -400
-350 -300 -250 -200 -150
E / mV (Ag/AgCl)
time / s
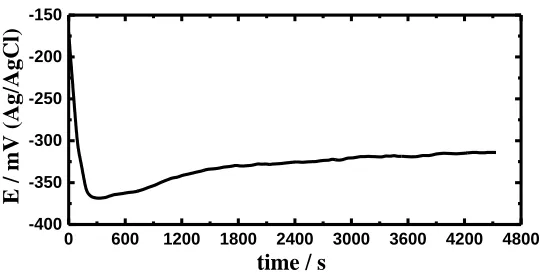
Figure 1. Change of the open-circuit potential versus time for the couple in the artificial saliva.
[image:5.596.165.435.504.643.2]
dissolution of a per air oxide film that was formed on the exposed surface of the implant fixtures to the atmosphere [16]. Increasing the immersion time allowed the potential to slightly shift in the less negative direction as a result of oxide film and/or corrosion product formation on the surface of the implant systems. The potential continues decreasing with a slight shift in the less negative direction with increasing time of immersion until it gets stabilized before the end of the run. This is because the occurrence of equilibrium between the dissolution and formation of an oxide layer. Tang et al. [17] have reported a similar potential behavior for Ti coupled to Co-Cr framework that were immersed in artificial saliva.
3.2. Cyclic potentiodynamic polarization (CPP) measurements
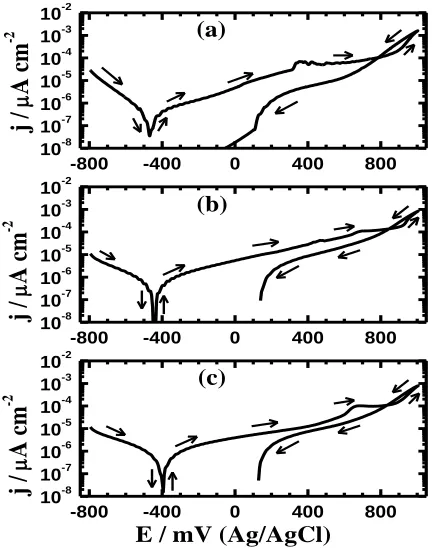
In order to assess the kinetics of corrosion processes and to report the effect of immersion time on the corrosion behavior of the two implants, the CPP measurements were carried out after varied exposure periods of time. Figure 2 presents a set of polarization curves obtained for the two dental implant fixtures after its immersion in artificial saliva for (a) 1, (b) 24 and (c) 48 h, respectively. The corrosion parameters obtained from the curves are listed in Table 3. These parameters are the cathodic Tafel slope (βc), anodic Tafel slope (βa), corrosion potential (ECorr), the corrosion current (jCorr),
protection potential (EProt), and polarization resistance (RP). The values of βc and βa were obtained
from the slopes of cathodic and anodic lines drawn by extrapolating a tangent to the linearized current regions. The values of jCorr and ECorr were obtained from the intersection of the extrapolated anodic and
cathodic Tafel lines located next to the linearized current regions. The values of RP were calculated
from the values of βc, βa, and jCorr using Stern–Geary equation as follows [18-20]: (1) ) ( 2.3 j 1 = Rp c c
Corr
a a
It is seen from Figure 2a that upon applying the negative potential the current decreases in the cathodic branch due to the reduction reaction that takes place at surface of the exposed implant fixtures. It has been reported [21-26] that the cathodic reaction of metals and alloys in aerated neutral solutions is the oxygen reduction, which can be expressed as follows;
(2) 4OH 4e O 2H
O2 2 -
-The electrons consumed at the cathode resulted from the anodic reaction, which is the dissolution of the active metals in the implant system alloy. The current slightly increased with increasing and over a wide range of the applied potential in the positive direction due to the high corrosion resistance of the coupled implants. It is also noted that the current in the backward direction is higher than the current in the forward one at the highest values of the applied potential, which indicates on the occurrence of pitting corrosion. The appearance of a hysteresis loop gives also another indication on the occurrence of pitting attack. The value of EProt listed in Table 3 for the coupled
-800 -400 0 400 800 10-8 10-7 10-6 10-5 10-4 10-3 10-2
-800 -400 0 400 800 10-8 10-7 10-6 10-5 10-4 10-3 10-2
-800 -400 0 400 800 10-8 10-7 10-6 10-5 10-4 10-3 10-2 (c) (b) j / A cm -2 (a) j / A cm -2 j / A cm -2
E / mV (Ag/AgCl)
Figure 2. Cyclic potentiodynamic polarization curves obtained for the implant fixtures after its immersion in artificial saliva for (a) 1, (b) 24, and (c) 48 h, respectively.
Table 3. Corrosion parameters of the assembly after different exposure periods of time in the saliva test solution, which were obtained from the polarization curves.
Immersion period (Hours)
Corrosion parameters βc / mV/dec-1 ECorr / mV βa / mVdec-1
jCorr /
µA cm-2 EProt / mV
Rp /
kΩ cm2
1 140 -475 240 0.27 782 14.238
24 168 -445 210 0.30 838 13.266
48 155 -440 180 0.35 842 10.194
Prolonging the exposure time to 24 h, Figure 2b, increased the cathodic and anodic currents as well as, the value of jCorr. This effect also decreased the value of RP and shifted ECorr to the less
negative value as can be seen from Table 3. The latter is in accordance to previous findings where the ECorr values shifted towards noble potentials after prolonged immersion [27-28]. This indicates that the
increase of immersion time to 24 h increases the uniform corrosion of the implants surface. On the other hand, the pitting corrosion decreased because the value of EProt was shifted to 838 mV (Ag/AgCl)
and also the decrease in the area of the hysteresis loop compared to that obtained for the implants after its immersion for only 1.0 h. Increasing the immersion time to 48 h (Figure 2c) further increased the intensity of uniform corrosion of the implant surface through increasing the value jCorr and decreasing
the value of RP (see also Table 3). The increase of time to 48 h also decreased the severity of pitting
corrosion via decreasing the area of the hysteresis loop and shifting the value of EProt to the most
[image:7.596.187.403.87.361.2] [image:7.596.33.565.468.560.2]
3.3. Electrochemical impedance spectroscopy (EIS) measurements
0 2 4 6 8 10 12
0 4 8 12 16 20 24
-Z
' / k
cm
2
Z" / k
cm
23
2
1
Figure 3. Typical Nyquist plots obtained for the implant fixtures after its immersion in the artificial saliva for 1(1), (b) 24(2) and 48 h (3), respectively.
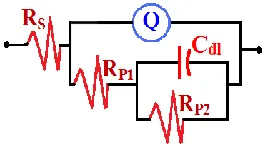
EIS technique has been successfully used to explain the kinetic parameters for electron transfer reactions at the implant/salvia interface and to understand the mechanism of corrosion and passivation phenomena for metallic materials in various media conditions [297-363]. Figure 3 shows the typical Nyquist plots obtained for the implant after its immersion in artificial saliva for 1(1), (b) 24(2) and 48 h (3), respectively. The data obtained from Figure 3 were inserted to professional software and was found to be best fitted to the equivalent circuit model presented in Figure 4. This equivalent circuit refers to the presence of a duplex oxide layer; the inner barrier film represented by RP2 and Cdl but the
outer layer is due to the presence a wall capacitance, which is represented by Q and a polarization resistance RP1 inside the pores. The overall solution resistance is represented by Rs. The values of all
these impedance parameters are displayed in Table 4.
Figure 4. The equivalent circuit model used to fit the EIS experimental data.
[image:8.596.166.431.109.257.2] [image:8.596.232.364.528.600.2]
the values of Q (CPEs) with their n values close to unity represent double layer capacitors, which indicate that the outer layer formed on the exposed surface of the dental implants contains some pores from which the corrosion takes place. In addition to that the recorded values for Q and Cdl increased
with the increase of immersion time and confirm also that the corrosion of the implants increased with the increase of immersion time.
Table 4. Electrochemical impedance spectroscopy parameters obtained the couple after different exposure periods of time in the saliva test solution.
Immersion period (Hours)
EIS Parameter RS
(Ω cm2
)
Q
RP1
(Ω cm2
)
Cdl(µF
cm-2)
RP2
(Ω cm2
) YQ
(µF cm-2) n
1 56.78 0.6526 0.83 5460 2.827 8296
24 49.6 0.9035 0.82 3764 2.936 6302
48 44.15 1.0391 0.83 4482 3.012 5304
10-1 100 101 102 103 104 105
101
102
103
104
|Z
| /
c
m
2
Frequency / Hz
3
2 1
Figure 5. Bode impedance (|Z|) plots obtained for the sample after its immersion in artificial saliva for (1) 1, (2) 24 and (3) 48 h respectively.
[image:9.596.52.544.223.566.2]
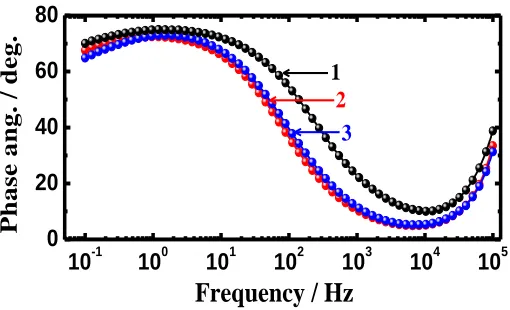
region were recorded for the implant fixtures that were immersed for only 1h. Increasing the immersion time is noticed to decrease the values of |Z|. It has been reported [34] that the higher the values of |Z|, especially at lower frequency range, the higher the corrosion resistance of the sample under investigation. Moreover, the decrease in the value of Ф at its maximum at low frequency values with the increase of immersion time period as seen from Figure 6 are due to the decrease of corrosion resistance. This confirms that the highest corrosion resistance is recorded for the sample that was immersed in the saliva for only 1 h and that the increase of immersion time decreases the corrosion resistance.
10-1 100 101 102 103 104 105
0 20 40 60 80
P
h
a
s
e
a
n
g
.
/
d
e
g
.
Frequency / Hz
3
2
1
Figure 6. Bode phase angle (Φ) plots obtained for the sample after its immersion in artificial saliva for (1) 1, (2) 24 and (3) 48 h respectively.
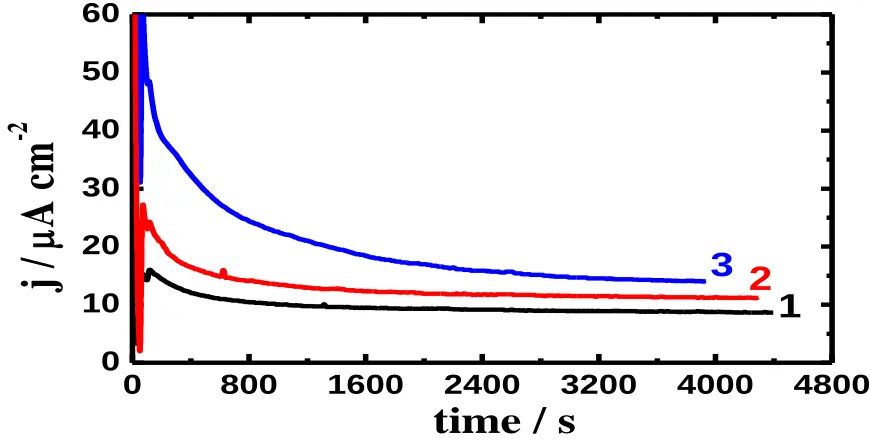
3.4. Chronoamperometric current-time measurements
[image:10.596.183.438.235.390.2]
implants have high corrosion resistance.
0
800
1600
2400
3200
4000
4800
0
10
20
30
40
50
60
2
1
j
/
A
c
m
-2
time / s
3
Figure 7. Chronoamperometric current-time curves obtained for the couple after its immersion in artificial saliva for (1) 1, (2) 24and (3) 48 h, respectively before stepping the potential to 500 mV vs. Ag/AgCl.
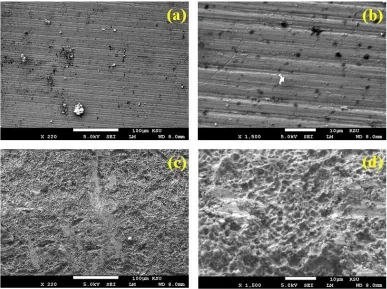
3.5. Scanning electron microscope (SEM) and X-ray energy dispersive spectroscopy (EDX) analysis
[image:11.596.84.519.116.337.2]
Figure 8. The obtained SEM micrographs (a) and (b) for Right Straumann® implant; and (c) and (d) for the left Straumann® implant in the couple, respectively after immersing the whole assembly for 48 h in the artificial saliva before stepping the potential to 500 mV for 1h.
Figure 9. The EDX spectra obtained for the surfaces shown in Figure 6 for (a) the Right Straumann® implant and (b) the left Straumann® implant, respectively.
The weight percentages (wt. %) for the elements obtained from the EDX analysis of the Right Struamann implant (Figure 9a) were 95.69 Ti and 4.31 C. The high percentage of Ti indicates that the alloy did not suffer any dissolution and is fully protected while Cis mainly appended to suface contamination.
[image:12.596.114.485.454.600.2]
composition of the left implant indicates that its surface developed a layer of corrosion products as a result of the dissolution of the alloy. The left Straumann implant suffered corrosion phenomena compared to the Right implant of the couple. Si ions might leach from the connecting superrastructure Co-Cr bar. Denoting The SEM and EDX results thus are in good agreement with the chronoamperometric current-time curves shown in Figure 7 (curve 3) from which the increase of the absolute current values was corrosponding to the increase of uniform corroison of the left implant in the sample.
4. CONCLUSION
The effect of increasing immersion time from 1 h to 48 h in artificial saliva on the corrosion of two coupled Straumann® alloys has been investigated. The open-circuit potential indicated that the couple showed a less negative potential shift with increasing the time of immersion. Polarization data revealed that the increase of immersion time increases the uniform corrosion of the implants surface via increasing its corrosion current and corrosion rate and decreasing its corrosion resistance. This effect was found to decrease the severity of pitting corrosion by shifting the protection potential of the couple towards the more positive values. EIS measurements confirmed also that the increase of time of immersion decreases the solution and polarization resistances of the implants as a result of the increased corrosion attack of the saliva on the surface of the two coupled Straumann® implants. The results obtained from chronoamperometric current-time showed that the pitting corrosion does not occur at 500 mV vs. Ag/AgCl and the absolute current values increase with increasing the immersion time as a result of the corrosiveness and harsh attack of the saliva onto the exposed surface of the implant fixtures. SEM and EDX investigations confirmed also that only one of the two Straumann® implant gets corroded, while the other one gets more protected. All results were in good agreement with each other showed clearly that the corrosion of the implant system increases with increasing the immersion time.
ACKNOWLEDGMENTS
This research project was financially supported by King Saud University, Vice Deanship of Research Chairs.
References
1. M. Geetha, A.K. Singh, R. Asokamanii, A.K. Gogia, Prog. Mater. Sci., 54 (2009) 397-425. 2. G. Ciurescu, J. Izquierdo, J. Santana D. Mareci, D. Sutiman, S. González, R.M. Souto, Int. J.
Electrochem. Sci., 7 (2012) 7404-7424.
3. Young-Taeg Sul, Carina B. Johansson, Sarunas Petronis, Anatol Krozer, Yongsoo Jeong, Ann Wennerberg, Tomas Albrektsson, Biomaterials, 23 (2002) 491-501.
4. Halit Arslan, Hüseyin Çelikkan, Nisa Örnek, Oğuz Ozan, A. Ersan Ersoy, M. Levent Aksu, J. Appl. Electrochem., 38 (2008) 853-859.
7. Chae-Heon Chung, Hee-Jung Kim, Yong-Tae Jeong, Mee-Kyoung Son, Yong-Hoon Jeong, Han-Cheol Choe, Trans. Nonferrous Metals Soc. China, 19 (2009) 846-851.
8. J. Geis-Gerstorfer, H. Weber, k. Sauer, Int. J. Oral Maxillofac. Implants, 4 (1989) 119-123. 9. R. Venugopalan, L.C. Lucas, L. C, Dent. Mater., 14 (1998) 165-172.
10. Cristina Solá, Armanda Amorim, Ángel Espías, Sofia Capelo, João Fernandes, Luís Proença, Luis Sanchez, Inês Fonseca, Int. J. Electrochem. Sci., 8 (2013) 406-420.
11. N.M. Taher, A.S. Al Jabab, Dent. Mater., 19 (2003) 54-59.
12. M. Cortada, L. Giner, S. Costa, F.J. Gil, D. Rodriguez, J.A. Planell, J. Mater. Sci. Mater. Med., 11 (2000) 287-293.
13. K.T. Oh, K.N. Kim, J. Biomed. Mater. Res. B Appl. Biomater., 70 (2004) 318-331. 14. L. Reclaru, J.M. Meyer, J. Dent., 22 (1994) 159-168.
15. M. Yamazoe, Dent. Mater, 29 (2010) 542-553.
16. El-Sayed M. Sherif, Mater. Chem. Phys., 129 (2011) 961.
17. Tang Ya. Wang Guo-ping, Journal of clinical Rehabilitative tissue Engineering Research, 15(2011) 8917-8920.
18. El-Sayed M. Sherif, Abdulhakim A. Almajid, J. Chem., 2014 (2014) 7 pages. 19. El-Sayed M. Sherif, Int. J. Electrochem. Sci., 6 (2011) 2284.
20. El-Sayed M. Sherif, Mahmoud S. Soliman, E.A. El-Danaf, A.A. Almajid, Int. J. Electrochem. Sci., 8 (2013) 1103.
21. B. Grosgogeat, L. Reclaru, M. Lissac, F. Dalard, Biomaterials, 20 (1994) 933-941. 22. E.J. Calvo, N. Mozhzhukhina, Electrochem. Commun., 31 (2013) 56.
23. K. A. Khalil, El-Sayed M. Sherif, A. A. Almajid, Int. J. Electrochem. Sci., 6 (2011) 6184. 24. El-Sayed M. Sherif, A. A. Almajid, K. A. Khalil, H. Junaedi, F. H. Latief, Int. J. Electrochem.
Sci. 8 (2013) 9360.
25. El-Sayed M. Sherif, Int. J. Electrochem. Sci. 7 (2012) 3077.
26. Shyam Kattel, Plamen Atanassov, Boris Kiefer, Phys. Chem. Chem. Phys., 15 (2013) 148. 27. A.K. Shulka, R Balasubramaniam Corros. Sci. 48 (2006) 1969-1720.
28. A.K. Shulka, R Balasubramaniam, S Bhargava Intermetallics 13 (2005) 631-637.
28.29. M. A. Alam, El-Sayed M. Sherif and S. M. Al-Zahrani, Int. J. Electrochem. Sci., 8 (2013) 3121.
29.30. D. Gopi, El-Sayed M. Sherif, V. Manivannan, D. Rajeswari, M. Surendiran, L. Kavitha, Ind. Eng. Chem. Res., 53 (2014) 4286–4294.
30.31. J. R. Macdonald, “Impedance Spectroscopy,” Wiley, New York, 1987. 31.32. El-Sayed M. Sherif, Ind. Eng. Chem. Res., 52 (2013) 14507–14513.
32.33. M. Gopiraman, N. Selvakumaran, D. Kesavan, I. S. Kim and R. Karvembu, Ind. Eng. Chem. Res., 51 (2012) 7910.
33.34. El-Sayed M. Sherif, H.S. Abdo, K.A. Khalil, A.M. Nabawy, Metals, 5 (2015) 1799.
34.35. El-Sayed M. Sherif, J. A. Mohammed, H. S. Abdo, A. A. Almajid, Int. J. Electrochem. Sci., 11 (2015) in press.
36. El-Sayed M. Sherif, H.S. Abdo and A.A. Almajid, Materials, 8 (2015) 2127.
37. Hanawa T, Kohayama Y, Hiromoto S, and Yamamoto A. Mater Trans, 45 (2004) 1635 - 1639 38. de Souza M, Oliveira N, Kuromoto N, and Marino C. Revista Materia 19 (2014) 53-60