Int. J. Electrochem. Sci., 10 (2015) 34 - 45
International Journal of
ELECTROCHEMICAL
SCIENCE
www.electrochemsci.org
Electrochemical Corrosion Behavior of API X-70 5L Grade
Steel in 4.0 wt. % Sodium Chloride Solutions after Different
Immersion Periods of Time
El-Sayed M. Sherif1,2,* and Abdulhakim A. Almajid1 1
Department of Mechanical Engineering, College of Engineering, King Saud University, P.O. Box 800, Al-Riyadh 11421, Saudi Arabia
2
Electrochemistry and Corrosion Laboratory, Department of Physical Chemistry, National Research Centre (NRC), Dokki, 12622 Cairo, Egypt
*
E-mail: esherif@ksu.edu.sa; emsherif@gmail.com
Received: 2 August 2014 / Accepted: 19 October 2014 / Published: 17 November 2014
The effect of increasing the immersion time form 1 h to 24 h on the corrosion behavior of API X-70 pipeline steel in 4.0 wt. % NaCl solution was reported using different electrochemical and spectroscopic techniques. The cyclic potentiodynamic polarization (CPP) measurements indicated that increasing the time of immersion decreases the anodic, cathodic and corrosion currents. Chronoamperometric current-time (CCT) experiments at -0.5 and -0.35 V vs. Ag/AgCl showed that the absolute current of the steel decreases with increasing immersion time and that pitting corrosion occurs only at -0.35 V as indicated also by scanning electron microscope images. Electrochemical impedance spectroscopy (EIS) confirmed the results obtained by CPP and CCT that the increase of immersion time from 1 h to 24 h increases both the solution and polarization resistances. Results together were consistent with each other confirming that the corrosion of API X-70 5L pipeline steel in 4.0 wt. % NaCl solution decreases with increasing time due to the formation of oxide and/or corrosion product layers on the surface.
Keywords: corrosion; chloride solution; chronoamperometry; EIS; pipeline steel; polarization
1. INTRODUCTION
equipment, oil / gas storage tanks, and transportation pipelines [4,5]. In addition, structures such as pipelines, off-shore rigs, agitators, pumps, and tanks are mostly made of these steels [5-9]. The fact that the majority of these steels are exposed to corrosive environments its severe corrosion takes place. The corrosion and corrosion control of API pipeline steels in several corrosive environments have been investigated by many researchers [1-3,5-7]. The influence of microstructure on the protective properties of the corrosion product layer generated on the welded API X-70 steel in sodium chloride solutions was reported [2]. The outcome of this work [2] was that the corrosion resistance for the steel increases after heat treatment due to formation of fine and compact corrosion product layer with fewer defects. The effect of microstructure alteration on corrosion behavior of welded joint in API X-70 pipeline steel was also investigated [10]. The corrosion of welded X-70 pipeline steel in near-neutral pH solution was also characterized by using the micro-electrochemical technique and confirmed that the resistance of corrosion product layer of the steel decreases with hydrogen charging, and heat-affected zone has the largest dissolution current upon hydrogen-charging [11]. The anodic dissolution of the X-70 steel in H3PO4 solution with the halide-ion perturbation at the interface was also reported [12]. It was found that the way how the halide ions affect the anodic dissolution is related to the types of the ions and the property of the film formed on the surface of the steel electrode [12].
We have been studying corrosion and corrosion prevention of metals and alloys in harsh environments [13-16]. In our previous study [1], the effects of immersion time on the corrosion of API X-70 in Arabian Gulf seawater were reported using different electrochemical and spectroscopic techniques. It was reported that the steel suffers both uniform and pitting corrosion. The uniform corrosion was found to decrease with increasing the exposure intervals, while the pitting corrosion increases. The present work aims at investigating the corrosion of the API X-70 5L pipeline steel after its immersion for 1 h and 24 h in a highly concentrated sodium chloride (4.0 wt.% NaCl) solution. The study was carried out at room temperature and in a stagnant chloride solution using traditional electrochemical methods like cyclic potentiodynamic polarization, open-circuit potential, and chronoamperometric current-time at constant potential (-0.5 and -0.35 V vs. Ag/AgCl). The study was complemented by the nontraditional electrochemical impedance spectroscopy technique along with the scanning electron microscopy investigations.
2. EXPERIMENTAL DETAILS
2.1. Materials and chemicals
2.2. Electrochemical cell
An electrochemical cell with a three-electrode configuration was used; the API X-70 5L pipeline steel rod; a platinum foil, and an Ag/AgCl electrode (in 3.0 M KCl) were used as the working, counter, and reference electrodes, respectively. The working electrode for electrochemical measurements was prepared by welding a copper wire to a drilled hole was made on one face of the rod; the rod with the attached wire were then cold mounted in resin and left to dry in air for 24 h at room temperature. Before measurements, the other face of the working electrode, which was not drilled, was first grinded successively with metallographic emery paper of increasing fineness up to 1200 grit. The electrode was then cleaned using doubly-distilled water, degreased with acetone, washed using doubly-distilled water again and finally dried with dry air.
2.3. Electrochemical test measurements
The electrochemical measurements were carried out using an Autolab Potentiostat (PGSTAT20 computer controlled) operated by the general purpose electrochemical software (GPES) version 4.9. The cyclic potentiodynamic polarization curves were obtained between -1.2 to 0.25 potential rang at a scan rate of 3mV/s vs. Ag/AgCl. Potentiostatic current-time experiments were carried out by stepping the potential of the steel samples at -0.5 and -0.35 V vs. Ag/AgCl. The electrochemical impedance spectroscopy (EIS) tests were performed at the open-circuit potentials (OCP) after 1 h and 24 h immersion over a frequency range of 100 kHz to 100 mHz, with an ac wave of 5 mV peak-to-peak overlaid on a dc bias potential, and the impedance data were collected using Powersine software at a rate of 10 points per decade change in frequency. All experiments were carried out using a fresh electrode surface at room temperature in a cell contains 200 ml of the test solutions.
2.4. Scanning Electron Microscope (SEM) Investigations
The SEM images were obtained by using a JEOL model JSM-6610LV (Japanese made) scanning electron microscope with an energy dispersive X-ray analyzer attached for acquiring the EDX analysis.
3. RESULTS AND DISCUSSION
3.1. Cyclic potentiodynamic polarization (CPP) measurements
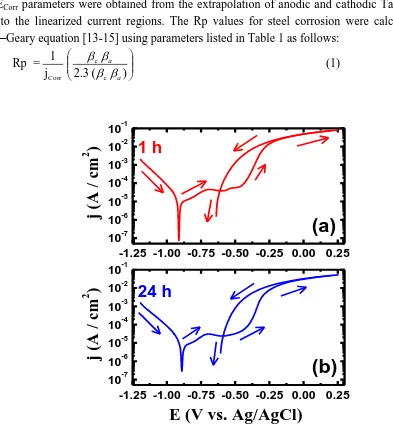
density (jPit), protection potential (EProt), polarization resistance (Rp), and corrosion rate (RCorr) obtained for the API X-70 5L pipeline steel rod curves shown in Figure 1 are listed in Table 1. The jCorr and ECorr parameters were obtained from the extrapolation of anodic and cathodic Tafel lines located next to the linearized current regions. The Rp values for steel corrosion were calculated from the Stern–Geary equation [13-15] using parameters listed in Table 1 as follows:
(1) ) ( 2.3 j 1 = Rp c c
Corr
a a
-1.25 -1.00 -0.75 -0.50 -0.25 0.00 0.25 10-7 10-6 10-5 10-4 10-3 10-2 10-1
(b)
(a)
24 h
j
(
A
/
cm
2
)
1 h
-1.25 -1.00 -0.75 -0.50 -0.25 0.00 0.25 10-7 10-6 10-5 10-4 10-3 10-2 10-1
j
(
A
/
cm
2)
E (V vs. Ag/AgCl)
Figure 1. Cyclic potentiodynamic polarization curves for API 5L grade X-70 pipeline steel after its immersion for (a) 1 h and (b) 24 h in 4.0 wt.% NaCl solutions.
The values of the corrosion rate (milli inches per year, mpy) were calculated according to the following equation [15,16]:
(2) j =
RCorr Corr
A d E k W
[image:4.596.75.468.110.534.2]
It is well known that the cathodic reaction of metals and alloys in freely aerated near neutral solution is the oxygen reduction reaction as follows [17-21]:
(3)
4OH
4e O 2H
O2 2 -
-On the other hand, the anodic branch for the API X-70 steel shows an active-passive anodic behavior in the potential range between -0.88 and -0.45 V vs. Ag/AgCl, as can be seen from Figure 1. The active region is probably due to the dissolution of iron of the steel into ferrous cations according to the following reaction:
Fe = Fe2+ + 2e− (4)
The ferrous cations are not stable and get rapidly oxidized to ferric cations as follows: Fe2+ = Fe3+ + e− (5)
These reactions could lead to the formation of FeCl2 and FeC13 in the solution as has been previously reported and according to the following equations [22]. Fe (surf) + 2Cl− (aq) = FeCl2 (surf) + 2e− (6)
FeCl2 (surf) = FeCl2 (interface) = FeCl2 (aq) (7)
FeCl2 (surf) + Cl− (aq) = FeCl3 (surf) + e− (8)
FeCl3 (surf) = FeC13 (interface) = FeCl3 (aq) (9)
The passive region in turn starts when the current decreases to show a large passive area with increasing potential due to the formation of oxide layers and/or corrosion products on the steel surface. The appearance of such region was most probably due to the formation of an oxide film and/or corrosion products [1]. This passive region does not last long and breaks down leading to the dissolution of steel and the occurrence of its pitting corrosion by increasing the values of the applied potential towards the noble direction. This was indicated by the rapid increase in the recorded current values. The occurrence of pitting corrosion was further indicated by reversing the potential in the backward direction, which resulted in an increase in the output currents. The difference between the forward and backward currents led to the appearance of a hysteresis loop, which not only confirms the occurrence of pitting corrosion but also gives indication on the intensity pitting attack, where the bigger the size of the hysteresis loop, the stronger the pitting corrosion on the API X-70 5L pipeline steel.
Table 1. Corrosion parameters obtained from the CPP curves shown in Figure 1 for the API X-70 5L pipeline steel after its immersion for 1 h and 24 h in 4.0 wt.% NaCl solution.
Medium
Parameter ECorr/ mV
jCorr/
µAcm-2 βc/mV dec-1
βa/mV dec-1
EPit/ mV
EProt/ mV
Rp/
kΩcm2 RCorr/ mmy-1
NaCl (1 h) -890 9 95 230 -440 - 610 3.25 0.104
NaCl (24 h) - 870 8 105 190 -430 -590 3.76 0.093
Fe + ½ O2 + H2O → Fe(OH)2 (10)
Where, the long immersion time allows this formed ferrous hydroxide to react further and to build up a layer of magnetite (Fe3O4) as the final corrosion product, if an excess of oxygen is present according to the following reaction [22];
3Fe(OH)2 + ½ O2 → Fe3O4 + 3H2O (11)
This indicates that the intensity of the dissolution reactions (Eq. 4 ‒ Eq. 9) seem to be decreasing with increasing time as a result of the formed oxide, Fe3O4,layers on the X-70 steel surface. The values the corrosion parameters recorded in Table 1 also confirmed that the increase of immersion time from 1 h to 24 h decreased the dissolution of steel through lowering jCorr, and RCorr values and increasing the value of Rp.
3.2. Chronoamperometric current-time (CCT) experiments and SEM investigations
0 1000 2000 3000 4000 0.0
0.1 0.2 0.3 0.4 0.5
(b)
24 h
j
(
m
A
c
m
-2
)
1 h
0 1000 2000 3000 4000 0
2 4 6 8 10 12
(a)
j
(
m
A
c
m
-2
)
time (sec)
24 h
1 h
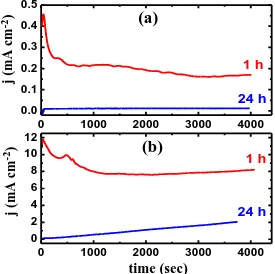
Figure 2. Chronoamperometric current-time curves obtained at (a) -500 mV and (b) -350 mV vs. Ag/AgCl, respectively for the API 5L grade X-70 pipeline steel electrode after 1 h and 24 h immersions in 4.0 wt.% NaCl solutions.
[image:6.596.152.427.303.577.2]
The increase of current was resulted from the dissolution of an oxide film was formed on the surface due to the contact with the solution before applying the potential. While, the decrease in the current values was due to the formation of corrosion products on the steel surface, which partially protect it from the severe chloride ions attack. Elongating the immersion time to 24 h at -0.5 V almost eliminated the effect of chloride ions, where the absolute current recorded very low values across the whole time of the experiment and confirms that the increase of immersion time decreases the corrosion of steel in the chloride test solution.
Applying a potential value of -0.35 V (Figure 2b), which is more anodic led to a drastic increase in the absolute current values after 1 h immersion of the steel in the test solution. On the other hand and after 24 h immersion, the initial current starts from very low values and slightly increases with increasing the time of the applied potential till the end of the experiment. This current-time behavior indicates that the pitting corrosion of steel takes place at these conditions.
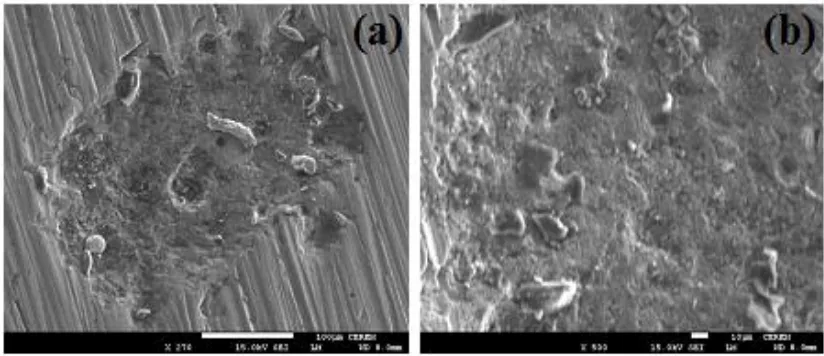
This was confirmed by the scanning electron microscopy (SEM) images, which were obtained from the steel surface after its immersion for 24 h before applying -0.35 V vs. Ag/AgCl and shown in Figure 3b (blue curve). It is clearly seen from the SEM images that the surface of the steel suffers sever pitting corrosion. Where, chloride ions from the solution attack the flawed areas of the accumulated corrosion products on the steel surface. This confirms the fact that the increase of immersion time decreases the uniform corrosion of the steel and on the other side increases the possibility of the occurrence of pitting attack. The data obtained by chronoamperometric current-time are in good agreement with those obtained by the polarization measurements.
Figure 3. SEM micrographs obtained on the API 5L grade X-70 pipeline steel electrode after its immersion for 24 h in 4.0 wt.% NaCl solution then stepping the potential to -0.35 V vs. Ag/AgCl for 1 h; (a) a small magnification for a pit and (b) a large magnification inside the pit.
3.3. OCP and EIS measurements
[image:7.596.92.504.441.619.2]
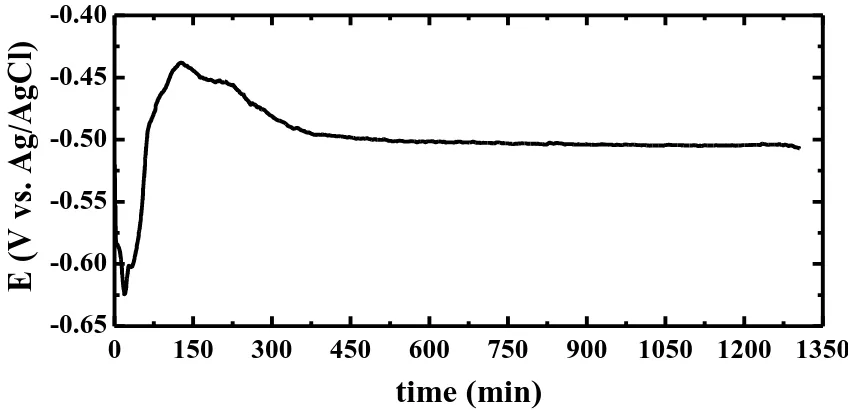
the more negative values from the first moment of electrode immersion as a result of the dissolution of a peroxide film was formed on the steel before its immersion in the chloride solution. After almost 30 min, the potential of the steel abruptly shifted from circa -0.625 to -0.440 V in about other 30 min indicating that the steel surface rapidly developed an oxide film and/or corrosion product layer that partially protects the steel from the chloride ions attack to the steel surface. The potential then slightly shifted towards the more negative direction before finally stabilized till the end of the experiment. The variation of OCP vs. time results thus confirm that the steel corrodes at its initial immersion in the NaCl solution then its corrosion slows down with time as a result of oxide film thickening and/or the formation of certain corrosion products on its surface. The presence of these layers on the surface protects it from being severely attacked by the corrosive chloride ions present in the test solution.
0 150 300 450 600 750 900 1050 1200 1350 -0.65
-0.60 -0.55 -0.50 -0.45 -0.40
E
(
V
v
s.
A
g
/A
g
C
l)
time (min)
Figure 4. Open-circuit potential curves obtained for the API 5L grade X-70 pipeline steel in 4.0 wt.% NaCl solutions.
[image:8.596.78.502.276.481.2]
0 400 800 1200
0 400 800 1200
-Z
"
(
cm
2
)
Z'
(
cm
2)
24 h
1 h
Figure 5. EIS Nyquist obtained for the API 5L grade X-70 pipeline steel after its immersion for 1 h and 24 h in 4.0 wt.% NaCl solutions.
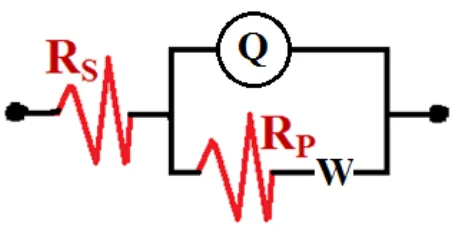
[image:9.596.153.442.83.277.2]The EIS spectra of Figure 5 show only one semicircle, whether the measurements were taken after 1 h or 24 h immersion in the test chloride solution. It is seen that the diameter of the semicircle is higher in the case of immersing the steel in 4.0 wt.% NaCl solution for 24 than that obtained for the steel after only 1 h immersion. Increasing the immersion time thus decreases the corrosion of the API X-70 5L pipeline steel in the neutral chloride solution. The EIS parameters recorded in Table 2 also indicated that increasing the immersion time from 1 h to 24 h increased the value of Rs and Rp, which gives another prove on the decrease of corrosion and the increase of corrosion resistance for the steel with time. The constant phase elements (CPEs, Q) with their n values close to unity for 1 h and 24 h immersion represent double layer capacitors with some pores that allow the dissolution of the steel. The low value of the CPEs with increasing the immersion period to 24 h reveals also that elongating time lowers the corrosion of the steel. Another prove, is the presence of W in the equivalent circuit, which indicates that the mass transport from surface of the steel is limited by an oxide film and/or corrosion products [27,28].
[image:9.596.181.408.599.713.2]
Table 2. EIS parameters obtained by fitting the Nyquist plots with the equivalent circuit for API X-70 5L pipeline steel after 1 h and 24 h immersion in 4.0 wt.% NaCl solutions.
Medium
Parameter
RS / Ω cm2 Q (CPEs) RP / Ω cm2 W
YQ / F cm ─2 n
NaCl (1 h) 12.42 0.0006654 0.90 520.1 0.00215 NaCl (24 h) 14.13 0.0003526 0.83 2598 4.47E-5
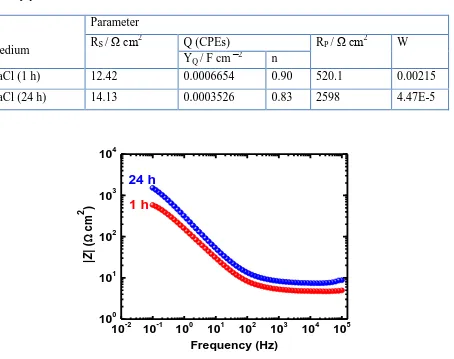
10-2 10-1 100 101 102 103 104 105 100
101 102 103 104
1 h
|
Z
|
(
cm
2
)
[image:10.596.154.455.192.451.2]Frequency (Hz) 24 h
Figure 7. Bode phase angle plots obtained for the API 5L grade X-70 pipeline steel after its immersion for 1 h and 24 h in 4.0 wt.% NaCl solutions.
In order to confirm the data obtained by the Nyquist plots, the Bode impedance of the interface and the Bode phase angle were plotted for the API X-70 5L pipeline steel in 4.0 wt.% NaCl solutions after 1 h and 24 h as shown in Figure 7 and Figure 8, respectively. Is clearly seen from Figure 7 that the impedance of the interface (|Z|) of the steel increases with increasing the immersion time before measurement across the entire frequency range. It has been reported [27] that the surface gets more protected when shows higher |Z| values, particularly at the low frequency region. This means that increasing the exposure time increases the corrosion resistance of the X-70 pipeline steel in 4.0 M NaCl solution. At this condition, the impedance of a CPE can be defined as following [29];
ZCPE = (1/Y0) (j)-n (12)
measurements that increasing the exposure period for the API X-70 pipeline steel increases its resistance against corrosion in the 4.0 wt.% sodium chloride test solution.
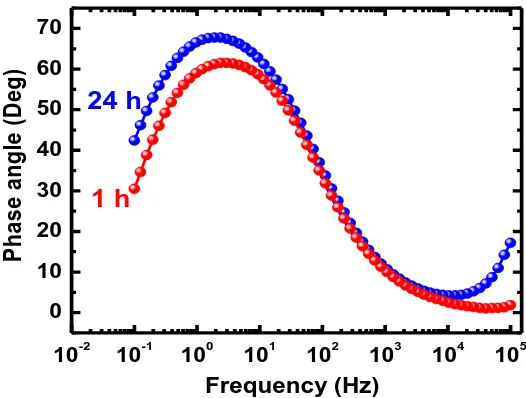
10-2 10-1 100 101 102 103 104 105
0 10 20 30 40 50 60 70
24 h
P
h
a
s
e
a
n
g
le
(
D
e
g
)
Frequency (Hz)
1 h
Figure 8. Bode phase angle plots obtained for the API 5L grade X-70 pipeline steel after its immersion for 1 h and 24 h in 4.0 wt.% NaCl solutions.
4. CONCLUSIONS
The electrochemical corrosion behavior of API X-70 5L pipeline steel after its immersion for 1 h and 24 h in 4.0 wt.% NaCl solution was investigated. The study was reported using different electrochemical techniques such as CPP, CCT, OCP, and EIS and further complemented by SEM analysis. It has been found that the increase of immersion time from 1 h to 24 h decreases the corrosion current density and corrosion rate, while increases the polarization resistance for the steel in the test solution as indicated by the CPP measurements. The increase of immersion time highly decreased the absolute currents at -0.5 V and -0.35 V vs. Ag/AgCl as reported by CCT experiments. The SEM images confirmed that the steel suffers pitting corrosion at -0.35 V after 24 h immersion due to the breakdown of the formed oxide film and/or corrosion products. Moreover, the solution and polarization resistances of the steel got enhanced with the increase of immersion time as indicated by the EIS data. All results were in good agreement and collectively proved that the corrosion of the API X-70 corrodes faster upon its immersion in the chloride solution but its corrosion slows down with increasing time to 24 h via the formation of oxide film and corrosion products.
ACKNOWLEDGEMENTS
The authors would like to extend their sincere appreciation to the Deanship of Scientific Research at
King Saud University for its funding of this research through the Research Group Project No.
[image:11.596.168.431.136.335.2]
References
1. El-Sayed M. Sherif, Abdulhakim A. Almajid, J. Chem., 2014 (2014) 7 pages. 2. Mostafa Alizadeh and Sajjad Bordbar , Corros. Sci., 70 (2013) 170.
3. El-Sayed M. Sherif, Abdulhakim A. Almajid, Khalil Abdelrazek Khalil, Harri Junaedi and F. H. Latief, Int. J. Electrochem. Sci. 8 (2013) 9360.
4. A. Yakubtsov, P. Poruks and J. D. Boyd, Mater. Sci. Eng. A, 480 (2008) 109–116. 5. M. C. Zhao, K. Yang and Y. Y. Shan, Mater. Lett., 57 (2003) 1496.
6. M. A. Hegazy, H. M. Ahmed and A. S. El-Tabei, Corros. Sci., 53 (2011) 671. 7. A. Hernández-Espejel and M. A. Domínguez-Crespo, Corros. Sci., 53 (2010) 2258.
8. A. Guenbour, M. A. Hajji, E. M. Jallouli and A. Ben Bachir, Appl. Surf. Sci., 253 (2006) 2362. 9. A. Bellaouchou, B. Kabkab, A. Guenbour and A. Ben Bachir, Prog. Org. Coat., 41 (2001) 127. 10. S. Bordbar and M. Alizadeh, Mater. Design, 45 (2009) 597.
11. G. A. Zhang and Y. F. Cheng, Corros. Sci., 51 (2009) 1714.
12. Liang Li, Chao Wang and Han Lu, Electrochim. Acta, 104 (2013) 295. 13. E.M. Sherif and S.-M. Park, Electrochim. Acta, 51 (2006) 6556. 14. E.M. Sherif and S.-M. Park, Electrochim. Acta, 51 (2006) 4665. 15. E.M. Sherif and S.-M. Park, Corros. Sci., 48 (2006) 4065. 16. El-Sayed M. Sherif, J. Appl. Surf. Sci., 252 (2006) 8615.
17. E.J. Calvo and N. Mozhzhukhina, Electrochem. Commun., 31 (2013) 56.
18. El-Sayed M. Sherif, Mahmoud S. Soliman, E.A. El-Danaf and A.A. Almajid, Int. J. Electrochem. Sci., 8 (2013) 1103.
19. El-Sayed M. Sherif and A.H. Ahmed, Synth. React. Inorg. Metal-Org. Nano-Metal Chem., 40 (2010) 365.
20. Shyam Kattel, Plamen Atanassov and Boris Kiefer, Phys. Chem. Chem. Phys., 15 (2013) 148. 21. El-Sayed M. Sherif, R. M. Erasmus and J. D. Comins, J. Colloid Interface Sci., 309 (2007) 470. 22. El-Sayed M. Sherif, Mater. Chem. Phys,.129 (2011) 961.
23. M. Gopiraman, N. Selvakumaran, D. Kesavan, I. S. Kim and R. Karvembu, Ind. Eng. Chem. Res., 51 (2012) 7910.
24. M. A. Alam, El-Sayed M. Sherif and S. M. Al-Zahrani, Int. J. Electrochem. Sci., 8 (2013) 3121. 25. J. R. Macdonald, “Impedance Spectroscopy,” Wiley, New York, 1987.
26. K. A. Khalil, El-Sayed M. Sherif and A. A. Almajid, Int. J. Electrochem. Sci., 6 (2011) 6184. 27. F. Mansfeld, S. Lin, S. Kim and H. Shih, Corros. Sci., 27 (1987) 997.
28. P.C. Okafor, C.B. Liu, X. Liu, Y.G. Zheng, F. Wang, C.Y. Liu and F. Wang, J. Solid State Electrochem., 14 (2010) 1367.
29. Zhe Zhang , Shenhao Chen, Yanhui Li, Shuhuan Li and Liang Wanga, Corros. Sci., 51 (2009) 291.