Int. J. Electrochem. Sci., 8 (2013) 8236 - 8251
International Journal of
ELECTROCHEMICAL
SCIENCE
www.electrochemsci.org
Suppressing Methanol Crossover with Nanometer-Sized Pt
3Sn
Particles Self-Assembled on a Nafion Membrane Surface
Chien-Heng Lin1, Chieh-Hao Wan2*, Weite Wu1**
1
Department of Materials Science and Engineering, National Chung Hsing University, Taiwan. 250 Kuo Kuang Rd., Taichung 402, Taiwan.
2
Department of Electro-Optical and Energy Engineering, MingDao University, Taiwan. 369, Wen-Hua road, Peetow, 52345, Changhua, Taiwan.
*
E-mail: [email protected]; [email protected]
**
E-mail: [email protected]
Received: 6 April 2013 / Accepted: 16 May 2013 / Published: 1 June 2013
In this paper, 5 and 10 poly(allylamine hydrochloride) (PAH)/poly(styrene sulfonic acid sodium salt) (PSS) bi-layers with dispersed Pt3Sn alloy nano-particles are self-assembled onto both sides of the
Nafion-117 membrane to suppress methanol crossover. The Pt3Sn alloy in PAH/PSS bi-layers are
synthesized by the reduction of Pt and Sn ions in PSS with NaBH4. The UV-visible spectroscopy was
used to monitor the PAH/PSS self-assembly bi-layers. The methanol crossover in membrane electrode assembly (MEA) was determined by measuring the CO2 concentration at cathode exhaust using a CO2
sensor. The results confirm that the Pt and Sn deposited in PAH/PSS bi-layers exist in a Pt-Sn alloy phase with atomic ratio of 3:1 (Pt:Sn). The layer thicknesses of 5 and 10 PAH/PSS bi-layers containing Sn alloy are 150nm and 300nm, respectively. The MEA, with 5 PAH/PSS bi-layers containing Pt-Sn alloy nano-particles (average particle size is 17 nm) catalyst, suppress methanol crossover by 50% and slightly improve the output current by 6% (@0.40V). This is because the presence of Pt-Sn alloy and PAH/PSS bi-layers itself functions like a catalytic active layer and methanol barrier that react and block the crossed-over methanol. These dual roles contribute to the suppression of methanol crossover and performance improvement. However, the thickness effect is evident for the 10 PAH/PSS bi-layers sample and results in the decrease of cell performance by 19%, while suppressing methanol crossover by 50%.
Keywords:methanol crossover, self-assembly layer, proton conductivity, Platinum-Tin alloy, nano-particles
1. INTRODUCTION
of the DMFC is relatively low as compared to the proton exchange membrane fuel cell (PEMFC), mainly due to the weak reaction kinetic of anode catalyst and methanol crossover. A possible strategy to meet the first challenge is to develop a new catalyst with high catalytic activity toward methanol oxidation. The quaternary Pt-based catalyst, such as Pt-Ru-Ir-Os, could achieve several times higher power density than the Pt50Ru50 catalyst. However, the difficulties of the synthesis of this catalyst limit
the wide use of this catalyst for commercialization. A possible strategy for the second challenge is to prevent methanol crossover. Methanol crossover is a process in which the un-reacted methanol diffuses from anode to cathode. It thus reduces the cell performance and stability of DMFC due to the poisoning of the Pt catalyst and mixed potential effect at cathode as well as the decreasing of fuel utilization [1-5]. Therefore, it is essential to improve the stability and cell performance of the DMFC before this technology can be commercially viable.
Many approaches have been proposed to mitigate the methanol crossover during the last decades. The first approach concerned the adding of second species such as Ce4+ [6], SiO2 [7-8] and
Zr(HPO4)2∙nH2O [9] into the Nafion membrane to form a composite Nafion membrane with low
methanol permeability. This approach can drastically reduce the methanol permeability and slightly decrease the proton conductivity. The second approach focused on the development of a new membrane with low methanol permeability and high proton conductivity [10-14], i.e. acid-doped polybenzimidazole (PBI), sulfonated-poly(arylene ether ketone)s (SPAEKs), etc. This approach can drastically reduce the methanol permeability and retain or increase the proton conductivity of the membrane. However, the problems remain with the chemical, mechanical, and thermal stability of this new membrane. The third approach concerns the deposition of the Pd layer onto the Nafion membrane to form a sandwich structure to block the crossed-over methanol [15]. This approach reduces the methanol crossover and cell performance at the same time. The fourth approach addresses the deposition of the double Pt-Ru layer, a Pt-Sn layer or a Pt layer [16-18] onto the Nafion membrane surface to react with and block the crossed-over methanol. This approach can drastically suppress methanol crossover and improve cell performance due to the deposited layer, which functions like a catalytically active layer, an electrode, and a methanol barrier.
assembly of PDAC with phosphotungstic acid (H3PW12O40) (PWA) onto the Nafion-212 membrane to
mitigate methanol crossover. The results showed that the composite Nafion-212 membrane with 4 PDAC/PWA bi-layers drastically reduces the methanol permeability by 87% and enhances the power density by 103%, although the proton conductivity of this composite Nafion-212 membrane had been reduced by 41%. They indicated that the reduction of performance from the adding of PDAC/PWA self-assembly bi-layers itself on to the Nafion membrane surface is lower than the performance improvement attributed to the reduced mixture’s potential effect at cathode by the effective suppression of methanol crossover. Deligöz’s team [22-24] studied the self-assembly of poly(allylamine hydrochloride) (PAH) and PSS onto the Nafion-117 membrane surface to mitigate methanol crossover. The results demonstrated that the composite Nafion membrane with 10 PAH/PSS bi-layers reduced the methanol permeability by 26% and the proton conductivity by 82% at the same time. When decreasing the bi-layers number to 5, the reduction of methanol permeability and proton conductivity are down to 19% and 56%, respectively. They recently changed the PSS to poly(vinyl sulfate potassium salt) (PVS) [25] to produce the self-assembly PAH/PVS bi-layers onto the Nafion-117 membranes surface. The proton conductivity has been improved by 107% while the methanol permeability has been reduced by 43% as compared to the un-treated Nafion membrane. However, there is no further cell performance result with those composite Nafion membranes to confirm the actual output performance and suppression of methanol crossover.
Another approach reported by Pan’s team [26] concerned the self-assembly of the PDAC containing Pd metal on the Nafion-112 membrane to suppress methanol crossover. They demonstrated that 3 bi-layers of PDAC containing Pd metal suppress methanol crossover by 99% and retain 84% proton conductivity as compared with pristine Nafion membrane. The methanol blocking effect of the self-assembly of the PDAC containing Pd metal on the Nafion membrane surface that reduces the mixed potential effect at cathode contributes to the suppression of methanol crossover. A similar approach had been reported by Jiang’s team, too [27]. The only different is in the metal deposited in PDAC, i.e. Pt in Jiang’s study vs. Pd in [26]. The Pt has the catalytic ability toward methanol oxidation. This means that the Pt reacts with the crossed-over methanol and thus reduces the amount of methanol crossover. This composite Nafion-1135 membrane with a PDAC layer containing Pt catalyst suppresses methanol crossover by 20% and improves power density by 34%.
According to the Deligöz’s results [22], the composite Nafion membrane with self-assembly PAH/PSS bi-layers suppresses methanol crossover while drastically reducing the proton conductivity at the same time. Therefore, the adding of Pt-Sn alloy catalyst in PAH/PSS bi-layers is expected to improve the cell performance while retaining the suppression of methanol crossover. The selection of Pt-Sn alloy is two-fold [28-29]: 1) the catalyst activity of Pt3Sn alloy toward methanol oxidation comes
after the Pt-Ru alloy catalyst; 2) the Sn is a cheaper raw metal as compared with the Ru metal. In this study, the Pt-Sn alloy nano-particles are introduced to the self-assembly PAH/PSS bi-layers by reducing the Pt and Sn ions in PSS to mitigate methanol crossover and improve cell performance. The designed membrane electrode assembly (MEA) structure is shown in figure 1. The effects of the 5, 10 PAH/PSS bi-layers with Pt3-Sn alloy nano-particles on the suppression of methanol crossover and
Figure 1. Diagram of the proposed MEA.
2. EXPERIMENTAL
2.1 Preparation of self-assembly layers composed of Pt-Sn nano-particles
N a fi o n -1 1 7
SO3 -SO3 -SO3 -SO3 -SO3 -SO3 -SO3 -SO3
-SO3
-PAH PSS+Pt+Sn+
NaBH4 Na
fi o n -1 1 7
SO3 -SO3 -SO3 -SO3 -SO3 -SO3 -SO3 -SO3
-SO3
-N a fi o n -1 1 7
SO3 -SO3 -SO3 -SO3 -SO3 -SO3 -SO3 -SO3
-SO3
-Polystyrene sulfonicacid sodium salt (PSS)
CH2 CH2
SO3-Na+
CH2 CH2
SO3-[Pt(NH3)4]2++ [Sn]2+
Poly (allylamine hydrochloride)(PAH)
CH2 CH2
CH2
NH3+Cl
-PAH: PSS: Pt Pt Pt Sn Pt Pt Pt Sn Pt Pt Pt Sn Pt Pt Pt Sn Pt Pt Pt Sn Pt Pt Pt Sn Pt Pt Pt Sn Pt Pt Pt Sn
Figure 2. An idealized scheme of layer-by-layer deposition of the anionic and cationic polyelectrolytes on the Nafion-117 membrane.
We prepared the aqueous solution of poly(allylamine hydrochloride) (PAH) (Mw 15,000) and poly(sodium 4-styrenesulfonnate) (PSS) (Mw 70,000) in a concentration of 10-2M separately. The
GDL GDL
Pt/C catalyst layer Pt50Ru50
catalyst layer
PAH/PSS-Pt3Sn self-assembly
[image:4.596.116.461.376.650.2]
[Pt(NH3)4]Cl2 and SnCl2∙2H2O were added into the PSS solution to form the PSS solution with Pt and
Sn ions. The pH of PSS and PAH was adjusted to 1.80 by adding the HCl into these two solutions. After drying the Nafion-117 membrane in an oven at 60°C, the membrane was alternately dipped into PAH and PSS solutions at an appropriate time. The excess PSS and PAH solution was rinsed with ultra-pure water after each dipping process. These procedures were repeated until the desired number of layers on the Nafion membrane surface was obtained. This sample is denoted as PAH/PSS-Pt+-Sn+. To obtain the Pt-Sn alloy in PAH/PSS, the samples were put into NaBH4 solutionsto carry out the
reduction reaction at 60°C for 1 hour. After the treatment of 0.50M H2SO4 at 80°C for 1 hour, the
sample was rinsed with ultrapure water. Finally, the sample with Pt-Sn metal on the Nafion membrane surface was obtained, which is denoted as the PAH/PSS-Pt-Sn sample. Figure 2 shows the diagram of PAH/PSS self-assembly layer containing Pt and Sn alloy on Nafion membrane surface.
2.2 Characterization of self-assembly layers with Pt-Sn
The UV-visible spectroscopy was used to monitor the coating of PAH/PSS self-assembly layers on Nafion membrane with a scan rate of 400 nm min-1. The pristine Nafion-117 membrane is used as the reference. A field emission-scanning electron microscope (FESEM) (JEOL, JSM-6700F) was adopted to characterize the morphology, composition and cross-sectional view of PAH/PSS bi-layers with Pt-Sn catalyst. The morphology and composition of resulting Pt-Sn particles was examined by a field emission-transmission electron microscope (FE-TEM) (JEM-2100F) with an energy dispersive X-ray spectrometer (EDS) (an Oxford INCA Energy TEM 200 system). The crystalline phase analysis was performed by comparison of the selected area diffraction (SAD) patterns of the catalyst particles to those of standard compounds reported in the JCPDF file. The X-ray diffraction (XRD) pattern of Pt-Sn was obtained by an X-ray diffractometer (BRUKER, D8 Discover) using a CuKα radiation source operating at 40kV and 30 mA. The proton conductivity of composite Nafion membrane was measured by a two-probe AC method using an AC impedance analyzer (EG&G, model 5210 lock in amplifier). The sample was cut in 3.50 cm x 3.50 cm dimensions and impedance measurements were performed in 95% RH at 60°C.
2.3 Preparation of anode (Pt50Ru50)、cathode(Pt/C ) and MEA
Anode or cathode catalyst ink was prepared by mixing Pt50Ru50 or 40%Pt/C, 5% Nafion
solution, n-butyl acetate and isopropanol (IPA) by homogenizer for 10 minutes. The catalyst ink was sprayed onto the carbon cloth, which served as a gas diffusion layer (GDL), and Nafion membrane surface to form the Pt50Ru50 anode and Pt/C cathode. The anode and cathode loadings were 4 mg
Pt50Ru50 cm-2 and 4 mg Pt cm-2, respectively. The MEA was formed by hot-pressing the sandwich
bi-layers sample, while the 10 represents the 10 self-assembly bi-layers sample. The MEA without any self-assembly layer on the Nafion membrane is denoted as MEA-N-117.
2.4 Measurement of performance and methanol crossover
The MEAs (5 cm2) were tested with 1M methanol as anode fuel (1cc/min) and pure oxygen as cathode fuel (400 sccm) at cell temperature of 80°C by a fuel cell test station, manufactured by Fuel Cell Technology, USA. Since the amount of methanol crossover is proportional to the CO2
concentration of cathode exhaust, we used the CO2 sensor (Testo 535) to monitor the amount of
methanol crossover. This was because most of the crossed-over methanol entering the cathode reacts with O2 to produce the CO2. Due to the CO2 concentration, output current remains steady 45 minutes
into the test for one corresponding voltage. The current and CO2 concentration were measured after 45
minutes. The polarization curve was obtained after collecting the output current and voltage from open circuit voltage (OCV) to 0.30V with a total measuring time of 360 minutes.
3. RESULTS AND DISCUSSION
3.1 Characterization of PAH/PSS self-assembly layer with Pt-Sn
[image:6.596.52.545.399.732.2]
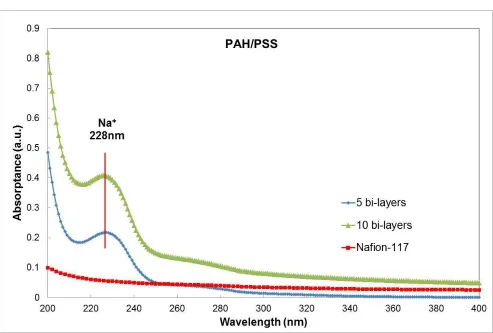
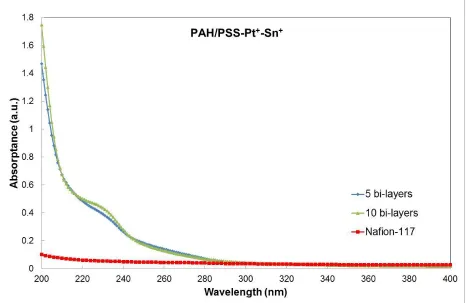
Figure 4. UV-vis absorption spectra of PAH/PSS-Pt+-Sn+ samples with 5 and 10 bi-layers.
Figure 5. XRD patterns of PAH/PSS-Pt-Sn sample with 5, 10 bi-layers and PAH/PSS-Pt sample with 10 bi-layers.
[image:7.596.184.404.440.615.2]
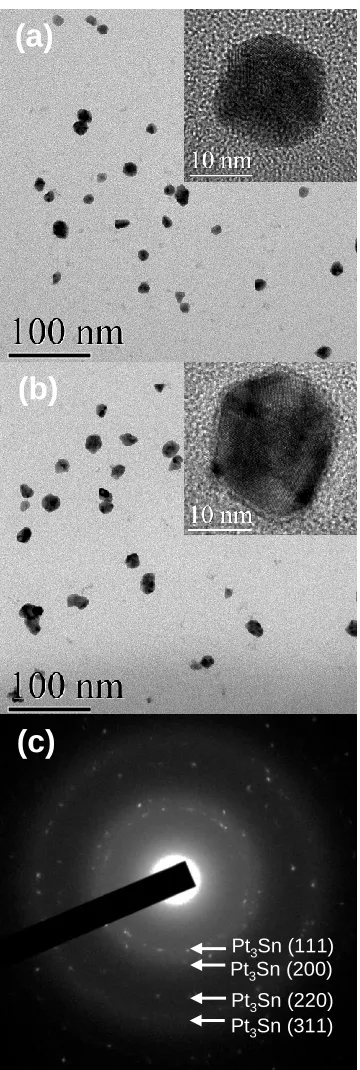
Figure 6. TEM micrographs of prepared Pt3Sn nanoparticles with (a) 5 bi-layers in bright field images;
(b) 10 bi-layers in bright field images and (c) 5 bi-layers in SAD patterns (the SAD patterns for 5 and 10 bi-layers are same to each other).
On contrast, the peak at 228 nm almost disappears when Na ion ion-exchanged by Pt and Sn ions (as shown in figure 4). However, it still has a small absorbance at 228nm for the sample containing Pt and Sn ions. This implies that a small portion of Na ions still exists in PSS. Due to the fact that the peaks of Pt and Sn ions cannot be observed in the range of UV-visible spectra we measured, the existence of Pt and Sn alloy were verified by XRD and TEM analysis.
(a)
(b)
(c)
Pt3Sn (200)
Pt3Sn (220) Pt3Sn (111)
Figure 5 shows the XRD patterns of the PAH/PSS-Pt-Sn and PAH/PSS-Pt samples. In order to verify the Pt element and alloy phase in the PAH/PSS-Pt-Sn sample, we also prepared the PAH/PSS-Pt sample with only the Pt element that was fabricated by the same conditions as in the PAH/PSS-Pt-Sn sample. The XRD pattern of the PAH/PSS-Pt sample is shown in figure 5(a). That the characteristic peaks at 39.84°, 46.56° and 67.88° indicates the existed phase is Pt element. Similar peak positions are obtained for the PAH/PSS-Pt-Sn sample. Consequently, the PAH/PSS-Pt-Sn sample has the Pt element. The peak of Pt(111) face is selected as the reference peak to verify the alloy phase by comparing the lattice constant of Pt and Pt-Sn. Bragg’s equation yields lattice constants of 3.928 Å for 5 bi-layers and 3.930 Å for 10 bi-layers, respectively, which are slightly longer than that of pure Pt, i.e. 3.920 Å. Since the lattice constant of pure Sn in FCC structure is greater than that of the pure Pt [30-31], the lattice constant is expected to become longer when the Sn atom is incorporated into the Pt FCC structure. However, the lattice constant of the PAH/PSS-Pt-Sn sample is slightly longer than that of Pt, indicating that Pt-Sn may exist in alloy phase. To confirm this, the TEM diffraction analysis is used to verify the alloy phase in the PAH/PSS-Pt-Sn sample. Figures 6(a) and 6(b) show the bright field morphology of PAH/PSS-Pt-Sn samples with 5 and 10 bi-layers, respectively. The nano-particles and lattice spacing can be clearly observed. The EDS results confirm the nano-particles containing the Pt and Sn elements, and the atomic ratio of Pt to Sn is 3:1. The average particle sizes are 17 nm for 5 bi-layers and 23 nm for 10 bi-bi-layers of the PAH/PSS-Pt-Sn samples, respectively. The d spacing obtained from the SAD pattern (Figure 6c) is 2.345 Å, which corresponds to the (111) reflection of the Pt3Sn
alloy phase (based on the data in JCPDF file No.: # 351360). Accordingly, the Pt-Sn in the PAH/PSS-Pt-Sn sample exists in alloy phase with atomic ratio of 3:1 (Pt:Sn).
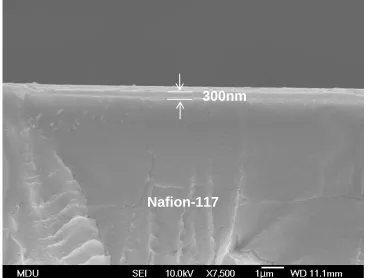
Figure 7. Cross-sectional SEM picture of 10 bi-layers of PAH/PSS containing Pt-Sn.
300nm
[image:9.596.115.483.452.730.2]
Figure 7 shows the cross-sectional SEM view of the PAH/PSS-Pt-Sn sample with 10 bi-layers. Two morphologies are observed. The upper layer is the PAH/PSS self-assembly layer with Pt-Sn nano-particles, implying that the self-assembly layer is concentrated on the Nafion-117 membrane surface. The corresponding thickness is 300 nm. Accordingly, the thickness of a PAH/PSS bi-layer containing Pt3Sn alloy is 30 nm. Therefore, the thickness of a PAH/PSS-Pt-Sn sample with 5 bi-layers is 150nm.
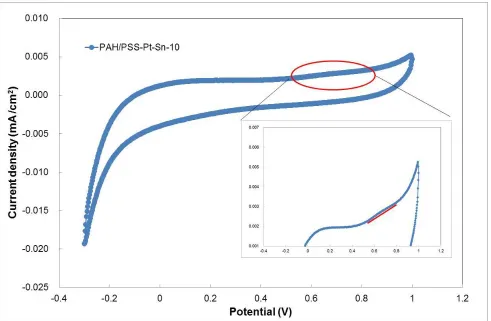
Figure 8. CV profile for PAH/PSS-Pt-Sn sample with 5 bi-layers. (Testing in 0.50 M CH3OH and 0.50
M H2SO4 solution at 25 °C).
Figure 8 presents the cyclic voltammograms (CV) profile for 5 bi-layers of PAH/PSS-Pt-Sn samples measured in a solution of 0.50 M methanol and 0.50 M H2SO4 at a scanning rate of 50 mV s-1.
A small peak of methanol oxidation is found at the potential range of 0.54-0.78 V when carefully examined (as shown in an enlarged picture on the right hand side in figure 8). The peak current density at 0.66 V is 2.7 x 10⁻³ mA cm-2. This result indicates that the Pt3Sn alloy deposited in the PAH/PSS
bi-layers can oxidize methanol and functions like a catalyst and an electrode with even a low Pt-Sn loading of 23μg cm-2 for 5 bi-layers and 38 μg cm-2 for 10 bi-layers, respectively.
[image:10.596.55.546.181.502.2]
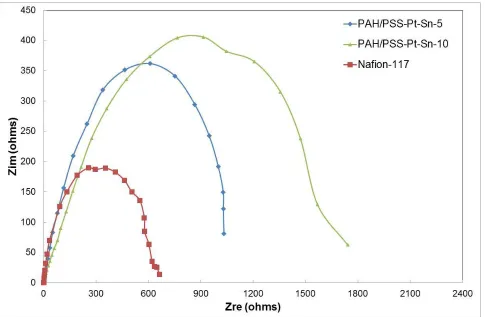
Figure 9. Nyquist plots of the PAH/PSS-Pt-Sn samples with 5,10 bi-layers and the pristine Nafion-117 membrane.
These results imply that the self-assembly of PAH/PSS with Pt3Sn alloy on Nafion membrane
surface increases the resistance of Nafion membrane and will reduce the cell performance.
3.2 Methanol crossover and cell performance
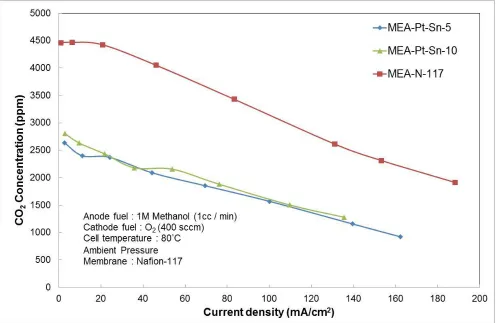
Figure 10 shows the CO2 concentrations at cathode exhaust varied with current density at 80°C.
The square, triangle and diamond symbols represent the curves for MEA-N-117, MEA-Pt-Sn-10 and MEA-Pt-Sn-5, respectively. According to the result of H. T. Liu and coworkers [32], the amount of methanol crossover is proportional to CO2 concentrations at cathode exhaust. Therefore, the CO2
concentrations at cathode exit are used to monitor the rate of methanol crossover. The CO2
concentrations of MEA-Pt-Sn samples with 5 and 10 bi-layers are lower than those of MEA-N-117 by 50%. Figure 11 indicates the OCVs of MEA-Pt-Sn with 5 and 10 bi-layers are 0.82V and 0.83V, respectively, which are higher than the OCV of MEA-N-117 (i.e. 0.72V) by about 0.10V and 0.11V, respectively. It is known that the OCV increases as methanol crossover decreases [32]. Therefore, the increments of OCV of 0.10V and 0.11V are attributed to the suppression of methanol crossover due to the existence of the PAH/PSS bi-layers with Pt3Sn alloy deposited on Nafion membrane surface. This
Figure 10. Steady-state CO2 concentrations at the cathode exhaust vs. current density at cell
temperature of 80°C.
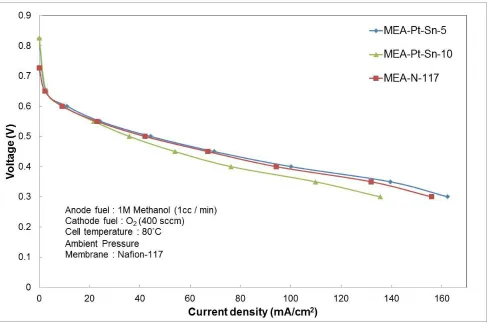
Figure 11 shows the polarization curves of MEA-Pt-Sn with 5 and 10 bi-layers and MEA-N-117. The current density of MEA-Pt-Sn with 5 bi-layers is slightly higher than that of MEA-N-117 by 6% (@0.40V), while the current density of MEA-Pt-Sn with 10 bi-layers is 19% (@0.40V) lower than that of MEA-N-117. There is a contrary result between 5 and 10 bi-layers. This is because the layer thickness and proton conductivity for 10 bi-layers of PAH/PSS with Pt-Sn catalyst are thicker and lower than those of the 5 bi-layers sample (i.e. 300nm vs. 150nm, 3.62 mS cm-1 vs. 5.55 mS cm-1).
In order to clarify the suppression mechanism of methanol crossover for MEA with self-assembly PAH/PSS bi-layers containing Pt-Sn alloy nano-particles, we applied the mechanism reported in [33] for this study due to the fact that the two MEAs have a similar structure and composition. The only difference lies on the deposited layer in PAH/PSS self-assembly bi-layers, i.e. Pt3Sn in this study vs. Pt35Ru65 in [33]. We propose that the crossed-over methanol reaches the Pt3Sn
deposited layer and reacts to form the CO2, electros and proton. The reaction over Pt3Sn nano-particles
reduces the amount of methanol crossover and mixed potential effects at cathode. Furthermore, the produced electrons conduct to cathode through the Pt50Ru50 anode catalyst layer via external circuit,
while the protons transfer from anode to cathode through the Nafion membrane. The combination of electrons and protons at cathode generate an extra current that improves the cell performance. Moreover, the solid Pt3Sn alloy particles in PAH/PSS bi-layers provide a barrier to block the
[image:12.596.51.549.70.393.2]
itself could suppress methanol crossover as well [22]. Due to these four reasons, the MEA with deposited Pt3Sn alloy particles in PAH/PSS bi-layers suppresses methanol crossover by 50%. In fact,
[image:13.596.56.545.157.481.2]the current density of this MEA has been increased by only 6% for 5 bi-layers and dropped by 19% for 10 bi-layers.
Figure 11. Polarization curves of MEA-Pt-Sn-5, MEA-Pt-Sn-10 and MEA-N-117 at 80°C.
This is due to two reasons. Firstly, both of the depositions of Pt3Sn alloy particles in PAH/PSS
bi-layers and the PAH/PSS self-assembly layer itself reduce the proton conductivity of Nafion membrane about one-seventh times and thus reduce the cell performance. Secondly, due to the good dispersion of Pt3Sn alloy particles in PAH/PSS bi-layers, the generated electrons are difficult to
transfer to cathode due to the high resistance between Pt3Sn alloy particles and the anode catalyst
Pt50Ru50 layer. The generated extra current is thus limited. This means that the performance
improvement offered by the Pt3Sn alloy particles is limited. Therefore, for 5 bi-layers, the performance
improvement attributed to 1) the oxidation reaction of crossed-over methanol over the Pt3Sn alloy
particles, and 2) the reduction of mixed potential effect at cathode is slightly higher than the increasing resistance of PEM from producing solid Pt3Sn alloy particles in PAH/PSS bi-layers and the PAH/PSS
self-assembly layer itself. Accordingly, MEA with deposited Pt3Sn alloy particles in 5 PAH/PSS
reaction over the Pt-Sn alloy particles and reduced mixed potential effect at cathode is thus lower than the increasing resistance of PEM resulting from solid Pt3Sn alloy particles in PAH/PSS bi-layers and
the PAH/PSS self-assembly layer itself. Consequently, MEA with 10 PAH/PSS bi-layers containing Pt3Sn alloy particles suppresses methanol crossover and reduces the cell performance.
To clarify the effect of deposited Pt-Sn in PAH/PSS, we compare the reduction of proton conductivity and methanol permeation rate for 5 and 10 bi-layers between our samples and the sample in reference [22] (as shown in table 1).
Table 1. Comparison of reduction of proton conductivity and methanol permeation rate for 5 and 10 bi-layers between ours samples and reference [18] (concentration of polyelectrolytes are 10-2 monomole).
Polyelectrolytes Number of deposited bi-layers
Reduction of proton conductivity1 (%)
Reduction of methanol permeation rate2 (%)
PAH/PSS [18] 5 56% 19%
10 82% 26%
PAH/PSS-Pt3Sn 5 60% 50%
10 74% 50%
1
Reduction of proton conductivity = [(proton conductivity of Nafion-117 - proton conductivity of sample) / proton conductivity of Nafion-117] x 100%
2
Reduction of methanol permeation rate = [(methanol permeation rate of Nafion-117 - methanol permeation rate of sample) / methanol permeation rate of Nafion-117] x 100%
The only different between these two samples is in the deposited Pt-Sn layer in this study. For 5 bi-layers, the reduction percentages of methanol permeation rate and proton conductivity for our sample are higher than those of the sample reported in [22], i.e. 50% vs. 19% and 60% vs. 56%, respectively. This indicates that our sample has a lower amount of methanol crossover and cell performance as compared with Deligöz’s sample. In fact, the actual output current density of our sample has been improved. This is because the deposited Pt-Sn nanoparticle oxides the crossed-over methanol to produce an extra current and thus improve output current density, although the proton conductivity is low. In contrast, the thickness of the 10 bi-layers sample is 2 times thicker than that of the 5 bi-layer sample and the 10 bi-layers sample shows an increasing resistance of composite Nafion membrane. The resistance increment of this composite membrane from increasing thickness is higher than the performance improvement due to the oxidation reaction of crossed-over methanol over the deposited Pt-Sn. Therefore, the output cell performance decreases while suppressing methanol crossover for our 10 bi-layers sample. This analysis supports the above inference.
Jiang’s team [27] studied the self-assembly of PDAC containing the Pt on the Nafion-1135 membrane surface to mitigate methanol crossover. They showed that this composite Nafion-1135 membrane with a PDAC layer containing Pt nano-particles has improved the power density by 34% and reduced methanol crossover by 19%. Comparing our sample with Jiang’s sample, our sample with 5 bi-layers of PAH/PSS containing Pt3Sn alloy nano-particles has a low power density increment than
crossover than Jiang’s sample, i.e. 50% vs. 19%. This is because the thickness effect of 5 bi-layers of PAH/PSS with Pt-Sn in our sample is more significant than that of a layer of PDAC with Pt in Jiang’s sample. This increases the resistance of composited Nafion membrane and reduces methanol crossover in our sample. Furthermore, the presence of Pt3Sn nano-particles in PAH/PSS self-assembly layer
oxides the crossed-over methanol and reduce methanol crossover. Therefore, our sample greatly mitigate methanol crossover while slightly improve power density as compared with the Jiang’s sample. Indeed, the presence of Pt3Sn nano-particles in the PAH/PSS self-assembly layer has better
CO tolerance than the Pt nano-particles.
4. CONCLUSION
5 and 10 PAH/PSS bi-layers containing Pt3Sn alloy nano-particles are self-assembled on both
sides of Nafion-117 membrane under the designed conditions. The layer thicknesses of 5 and 10 PAH/PSS bi-layers with Pt-Sn alloy are 150nm and 300nm, respectively. This self-assembly layer with Pt3Sn alloy nano-particles functions like a catalytic active layer and a methanol barrier that react and
block the crossed-over methanol. These two roles contribute to the suppression of methanol crossover and improved performance. Therefore, the composite Nafion membrane with 5 PAH/PSS bi-layers containing the Pt3Sn alloy suppresses methanol crossover by 50% and improved current density by 6%
(@0.40V). In contrast, the composite Nafion membrane with 10 PAH/PSS bi-layers containing the Pt3Sn alloy mitigates methanol crossover by 50% while decreasing performance by 19% (@0.40V).
This is because, for 5 PAH/PSS bi-layers, the performance improvement is attributed to 1) oxidation reaction of crossed-over methanol over the Pt3Sn alloy particles, and 2) reduction of mixed potential
effect at cathode, which is slightly higher than the increasing resistance of PEM from producing solid Pt3Sn alloy particles in PAH/PSS layers and the PAH/PSS self-assembly layer itself. For 10
bi-layers, the thickness effect significantly decreases the cell performance. Hence, the MEA with 10 PAH/PSS bi-layers with Pt3Sn alloy particles decreases current density by 19% while suppressing
methanol crossover. In short, the suppression of methanol crossover and the performance improvement of MEA with the existence of deposited catalyst layer in self-assembly layer are affected by the kinds, morphology and loading of the deposited catalyst layer and the self-assembly layer itself.
ACKNOWLEDGMENTS
We greatly thank the National Science Council of Taiwan (R.O.C) for the financial support under the NSC Project No. NSC 99-2221-E-451-014-MY2 and NSC 101-2221-E-451 -003 -MY2.
References
1. A. Heinzel, V. M. Barragán, J. Power Sources, 84 (1999) 70
2. G. T. Burstein, C. J. Barnett, A. R. Kucernak, K. R. Williams, Catal. Today, 38 (1997) 425 3. T. Frelink, W. Visscher, J. A. R. van. Veen, Surf. Sci., 335 (1995) 353
5. T. Frelink, W. Visscher, A. P. Cox, J. A. R. van. Veen, Electrochim. Acta, 40 (1995) 1537 6. V. Tricoly, J. Electrochem. Soc., 145 (1998) 3798
7. N. Miyake, J.S. Wainright, R.F. Savinell, J. Electrochem. Soc., 148 (2001) A905
8. P. Staiti, A.S. Aricò, V. Baglio, F. Lufrano, E. Passalacqua, V. Antonucci, Solid State Ionics, 145 (2001) 101
9. C. Yang, S. Srinivasan, A.S. Arico`, P. Creti, V. Baglio, V. Antonucci, Electrochem. Solid-State Lett., 4 (2001) A31
10.J. S.Wainright, D.Wang, R. F.Weng, M. Savinell, J. Electrochem. Soc., 142 (1995) 121 11.M.Weng, J. S.Wainright, U. Landau, R. F. Savinell, J. Electrochem. Soc., 143 (1996) 1260 12.J. T.Wang, S.Wasmus, R. F. Savinell, J. Electrochem. Soc., 143 (1996) 1233
13.S.Wasmus, J. T.Wang, R. F. Savinell, J. Electrochem. Soc., 142 (1995) 3825
14.P. Xing, G.P. Robertson, M.D. Guiver, S.D. Mikhailenko, S. Kaliaguine, Polymer, 46 (2005) 3257 15.C. Pu,W. Huang, K. L. Ley, E. S. Smoktin, J. Electrochem. Soc., 142 (1995) L119
16.C. H. Wan, J. M. Wei, M. T. Lin, C. H. Lin, Int. J. Electrochem. Sci., 6 (2011) 889 17.C. H. Wan, C. L. Chen, Int. J. Hydrogen Energy, 34 (2009) 9515
18.H. Uchida, Y. Mizuno, M. Watanabe, J. Electrochem. Soc., 149 (2002) A682 19.A. A. Argun, J. N. Ashcraft, P. T. Hammond, Adv. Mater., 20 (2008) 1539 20.S. P. Jiang, Z. Liu, and Z. Q. Tian, Adv. Mater., 18 (2006) 1068
21.M. Yang, S. Lu, J. Lu, S. P. Jiang and Y. Xiang, Chem. Commun., 46 (2010) 1434
22.H. Deligöz, S. Yılmaztürk, T. Karaca, H. Özdemir, S. Naci Koc, F. Öksüzömer, A. Durmus¸ M. Ali Gürkaynak, J. Membr. Sci., 326 (2009) 643
23.S. Yılmaztürk, H. Deligöz, M. Yılmazoğlu, H. Damyan, F. Öksüzömer, S. N. Koç, A. Durmuş, M. A. Gürkaynak. J. Membr. Sci., 343 (2009) 137
24.H. Deligöz, S. Yılmaztürk, M. Yılmazoğlu, H. Damyan, J. Membr. Sci., 351 (2010) 131
25.S. Yılmaztürk, H. Deligöz, M. Yılmazoğlu, H. Damyan, F. Öksüzömer, S. N. Koç, A. Durmuş, M. A. Gürkaynak, J. Power Sources, 195 (2010) 703
26.H. L. Tang, M. Pan, S. P. Jiang, Z. H. Wan, R. Z. Yuan, Colloids Surf., A :Physicochem. Eng. Aspects, 262 (2005) 65
27.S. P. Jiang, Z. Liu, H. L. Tang, M. Pan, Electrochim. Acta, 51 (2006) 5721
28.W. Zhou, Z. Zhou, S. Song, W. Li, G. Sun, P. Tsiakaras, Q. Xin, Appl. Catal., B: Environmental, 46 (2003) 273
29.S. C. Zignani, V. Baglio, J. J. Linares, G. Monforte, E. R.Gonzalez, A. S. Aricò, Electrochim. Acta, 70 (2012) 255
30.H. Li, G. Sun, L. Cao, L. Jiang, Q. Xin, Electrochim. Acta, 52 (2007) 6622
31.J. M. Leger, S. Rousseau, C. Coutanceau, F. Hahn, C. Lamy, Electrochim. Acta, 50 (2005) 5118 32.J. H. Han, H. T. Liu, J. Power Sources, 164 (2007) 166
33.C. H. Wan, M. T. Lin, J. Power Sources, 222 (2013) 470