This is a repository copy of Phenotypic variation in Heliconius erato crosses shows
iridescent structural colour is sex-linked and controlled by multiple genes
.
White Rose Research Online URL for this paper:
http://eprints.whiterose.ac.uk/138181/
Version: Accepted Version
Article:
Brien, M., Enciso Romero, J. orcid.org/0000-0002-4143-3705, Parnell, A.
orcid.org/0000-0001-8606-8644 et al. (7 more authors) (2018) Phenotypic variation in
Heliconius erato crosses shows iridescent structural colour is sex-linked and controlled by
multiple genes. Interface Focus, 9. 20180047. ISSN 2042-8898
https://doi.org/10.1098/rsfs.2018.0047
© 2018 The Royal Society. This is an author-produced version of a paper accepted for
publication in Interface Focus [http://rsfs.royalsocietypublishing.org/]. Uploaded in
accordance with the publisher's self-archiving policy
[email protected] https://eprints.whiterose.ac.uk/
Reuse
Items deposited in White Rose Research Online are protected by copyright, with all rights reserved unless indicated otherwise. They may be downloaded and/or printed for private study, or other acts as permitted by national copyright laws. The publisher or other rights holders may allow further reproduction and re-use of the full text version. This is indicated by the licence information on the White Rose Research Online record for the item.
Takedown
If you consider content in White Rose Research Online to be in breach of UK law, please notify us by
Phenotypic variation in Heliconius erato crosses shows iridescent structural colour is
sex-linked and controlled by multiple genes
Melanie N. Brien
1, Juan Enciso Romero
1,2, Andrew J. Parnell
3, Patricio A. Salazar
1,4, Carlos
Morochz
5, Darwin Chalá
5, Hannah E. Bainbridge
1, Thomas Zinn
6, Emma V. Curran
1, Nicola
J. Nadeau
11Department of Animal and Plant Sciences, The University of Sheffield, Alfred Denny Building, Western Bank, Sheffield, S10 2TN, United Kingdom;
2Biology Program, Faculty of Natural Sciences and Mathematics, Universidad del Rosario, Bogota, Colombia;
3Department of Physics and Astronomy, The University of Sheffield, Hicks Building, Hounsfield Road, Sheffield, S3 7RH, United Kingdom;
4Centro de Investigación en Biodiversidad y Cambio Climático (BioCamb), Universidad Tecnológica Indoamérica, Quito, Ecuador;
5Mashpi Reserve, Ecuador;
6ESRF - The European Synchrotron, 38043, Grenoble Cedex 9, France.
Abstract
Bright, highly reflective iridescent colours can be seen across nature and are produced by the
scattering of light from nanostructures. Heliconius butterflies have been widely studied for their
diversity and mimicry of wing colour patterns. Despite iridescence evolving multiple times in this
genus, little is known about the genetic basis of the colour and the development of the structures
which produce it. Heliconius erato can be found across Central and South America, but only races
found in Western Ecuador and Colombia have developed blue iridescent colour. Here, we use crosses
between iridescent and non-iridescent races of H. erato to study phenotypic variation in the resulting
F2 generation. Using measurements of blue colour from photographs, we find that iridescent
structural colour is a quantitative trait controlled by multiple genes, with strong evidence for loci on
the Z sex chromosome. Iridescence is not linked to the Mendelian colour pattern locus that also
segregates in these crosses (controlled by the gene cortex). Small angle X-ray scattering data shows
that spacing between longitudinal ridges on the scales, which affects the intensity of the blue
reflectance, also varies quantitatively in F2 crosses.
Keywords
1. Introduction
Structural colours are bright and highly reflective colours produced by the interaction of light with
nanostructures. They can be seen across a range of taxa, including fish, birds, molluscs and insects,
and have numerous functions covering visual communication and recognition, mate choice and
thermoregulation [1–3]. Despite this, little is known about the genetic basis of structural colour, or
how genetic variation translates into developmental differences of the nanostructures.
Examples of the different ways structural colour is produced can be seen across butterfly species.
Multilayer reflectors produce the bright blue colour in Morpho butterflies [4], while Callophrys rubi
have a highly connected gyroid structure contained within the upper and lower lamina [5]. Scales on
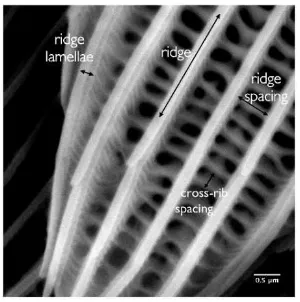
butterfly wings are formed as a long, flattened extension of the cuticle. Generally, they are composed
of longitudinal ridges which are linked transversely by cross-ribs (Figure 1). These nanostructures
make up a variety of repeating elements which can vary in thickness and patterning, producing
different visual effects. F-actin filaments are important in the development of wing scale cells, and
appear to pre-pattern where the ridges will form [6].
The neotropical Heliconius butterflies (Nymphalidae) are well-known for the diversity in their wing
colour patterns and mimicry between species [7]. Many of these colour patterns are formed by
chemical pigments, but several species also exhibit structurally produced blue reflectance. Heliconius
butterflies can produce structural colour by thin film interference using different features on their
scales. Longwing H. doris, for example, display hindwing colour reflected by their lower lamina; the
resulting colour can be blue or green depending on the absence or presence of the yellow pigment
3-OH-kynurenine [8]. Several other species, including Heliconius erato, produce iridescent colours, that
change in both brightness and wavelength of peak reflectance with angle, using layered lamellae that
make up their scale ridges. Density of the ridges, the curvature and layering of the lamellae affect the
intensity of the structural colour, with denser ridge spacing producing higher reflectance [9].
Heliconius erato is found across Central and South America and has evolved more than 25 raceswith
a diversity of colour patterns. These aposematic patterns are mimetic with Heliconius melpomene and
are an example of Müllerian mimicry. Variation in pigment colour patterns has been found to map to
a handful of loci that control a diversity of patterns in several distantly related species [10–13].
Despite iridescent colour evolving multiple times in Heliconius, the genetics of this trait have not
been studied to the same extent as pigment colour patterns, likely due to the difficulty of measuring
the trait. Iridescent H. erato cyrbia is found on the Western slopes of the Andes in Ecuador. H. erato
races found further north in Panama lack this structural colour, and hybrid zones arise between the
iridescent and non-iridescent races, where populations with intermediate levels of iridescence can be
found. Previous researchers have noted that levels of iridescence vary in F2 hybrid crosses and appear
variation in the F2 would suggest that the trait is controlled by multiple loci and therefore not
controlled by the “tool kit” of major effect loci that regulate pigment colour patterns. The genes
controlling variation in iridescence may perhaps be those directly controlling the formation of scale
structure.
Experimental genetic crosses can be used to estimate the number of genes involved in controlling a
trait by investigating the distribution of the phenotype across segregating generations [15]. Traits that
are controlled by a single locus of major effect will segregate according to Mendelian ratios, with
50-100% of individuals in the F2 generation having phenotypes the same as one or other of their parents
(depending on dominance of the alleles). The more individuals there are with intermediate
phenotypes, the more loci are likely to be involved, as a greater number of allele combinations will be
possible. We can also estimate positions of loci in the genome by looking for links to known loci
which control other phenotypes, and by looking for patterns of sex linkage.
Here, we aim to determine whether iridescence in Heliconius erato is a quantitative trait controlled by
multiple genes, and if any of these genes are sex-linked or linked to known colour pattern loci, by
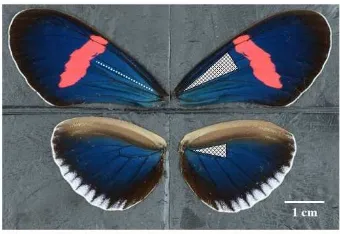
looking at the segregation of the trait in F2 crosses between different races. H. erato demophoon from
Panama is black with red and yellow bands. This race was crossed to H. erato cyrbia from Ecuador,
which has a similar colour pattern but has an iridescent blue colour instead of being matt black
(Figure 2). The only major colour pattern differences between these races are the white margin on the
hindwing of H. erato cyrbia and the yellow bar on the dorsal hindwing of H. erato demophoon. Based
on previous crosses, these are likely to be controlled by alternative alleles of the Cr locus on linkage
group 15, which is homologous to three tightly linked loci (Yb, Sb and N) in H. melpomene [10], and
corresponds to the gene cortex [16]. There are also differences in the size and position of the red
forewing band between cyrbia and demophoon, likely controlled by the gene WntA, found on
chromosome 10 [12,17,18]. We also use small angle X-ray scattering (SAXS) to quantify ridge
spacing in broods. As several aspects of scale morphology are known to vary between the iridescent
and non-iridescent races [9] it is possible that apparent continuous variation in the reflectance in the
F2 could be due to independent segregation of these different features, each of which may be
controlled by a major effect gene. Therefore, we also test whether ridge spacing shows continuous
2. Methods
2.1 Crossing Experiments
Experimental crosses were performed between geographical races of Heliconius erato at the insectary
in Mashpi Reserve, Ecuador, over a period of 2 years. H. erato demophoon was collected from
Gamboa, Panama (9.12o N, 79.67o W) in May 2014, then transported to Mashpi, Ecuador (0.17o N,
78.87o W), where they were kept as stocks. Iridescent H. erato cyrbia were collected from the area
around Mashpi. H. e. demophoon were crossed with H. e. cyrbia, and the F1 generation crossed
together, along with the addition of 2 backcrosses (BC) between the F1 and cyrbia (Figure 2). Crosses
were reciprocal, so that in roughly half of the first generation crosses the female was the iridescent
race and the male non-iridescent, and vice versa. In line with previous studies with intraspecific
Heliconius hybrids [12,19], races readily hybridised and we did not observe any evidence of hybrid
inviability or differing success between the reciprocal crosses. Passiflora species were provided as
larval food plants and for oviposition, and butterflies were given Lantana camara and other locally
collected flowers, plus sugar solution (10%) and pollen to feed. The bodies of the parents and
offspring were preserved in NaCl saturated 20% dimethyl sulfoxide (DMSO) 0.25M EDTA solution
to preserve the DNA, and the wings stored separately in glassine envelopes. A total of 302 individuals
obtained from 14 crosses were used in the analysis (Table 1).
2.2 Phenotypic Colour Analysis
All butterfly wings were photographed flat under standard lighting conditions using a mounted Nikon
D7000 DSLR camera with a 40mm f/2.8 lens set to an aperture of f/10, shutter speed of 1/60 and ISO
of 100. Lights were mounted at a fixed angle of 45 degrees to maximise the observed blue reflection
from the iridescent wing regions. All photographs also included an X-Rite Colour Checker to help
standardise the colour of the images. RAW format images were standardised using the levels tool in
Adobe Photoshop CS2 (Version 9.0). Using the colour histogram plugin in ImageJ [20,21],
red-green-blue (RGB) values were recorded from 2 sections of the wings and averaged (Figure 3). These
areas were chosen because the scales on these sections of the wings close to the body tended to be the
least damaged and worn, so a more accurate measurement of the colour could be taken, and the wing
venation was used as a marker to allow the same areas to be measured each time.
Blue reflection from the iridescent wing regions was measured as variation in blue-red (BR) colour.
This was calculated as (B-R)/(B+R), with -1 being completely red and 1 being completely blue. The
level of UV reflectance could not be measured from our photographs. Previous spectral measurements
of the wing reflectance show that peak reflectance for H. erato cyrbia is just below the visible range at
demophoon reflects very little but tends to show highest reflectance in the red-infrared range [9].
Therefore, the colour values will allow variation in colour and reflectance to be measured but will not
represent butterfly visual systems. Repeatability of the colour measurements was tested using the
repeatability equation of Whitlock and Schluter [22] by taking 5 measurements each on 5 randomly
selected individuals. This estimates the fraction of total variance that is among groups in a
random-effects ANOVA. We used the Castle-Wright estimator:
= [ ( ) ( )] [ ( )] [ ( )]
8 ( )
where S = Var(F2) – Var (F1), to estimate the effective number of genetic loci (ne) contributing to
variation in the trait [15,23,24]. This is the difference between the mean BR values of the parental
races squared, then the subtraction of the two variance terms, which corrects for sampling error of the
estimates of the parental means (P1 and P2).
The genotype at the Cr locus was scored in 286individuals based on the presence and absence of the
white hind-wing margin and the dorsal hind-wing yellow bar, under the assumption that these pattern
elements are controlled by alternative alleles of the Cr locus [10,25]. The demophoon genotype has
the yellow bar present and is scored as CrdCrd, a white margin indicates the cyrbia genotype and this
is scored as CrcCrc, and the CrdCrc heterozygous genotype has neither of these elements (Figure 2).
To look for association between variation in the red band and blue colour, we took four measurements
of forewing band size in 71 F2 individuals and three further measurements to adjust for wing size
(Figure 4), based on methods from Baxter et al. [26]. Using ImageJ, band measurements were carried
out on the dorsal side of the wing and repeated for both the left and right wings. The average of these
two measurements was divided by the average of the three standardising wing measurements. The
three standardising wing measurements were also used to assess overall size of these individuals.
All statistical analyses were carried out in the R statistical package version 3.4.2 [27]. Welch’s t-tests
were used for analysis of differences between sexes and reciprocal crosses. ANOVA models were
used to compare blue values to Cr genotypes. Yellow bar and white margin traits were tested for
departures from the expected segregation ratios, based on the above hypothesis of the linkage and
Mendelian inheritance, using a chi-squared test. Correlations between BR values and forewing red
band measurements, ridge spacing, and cross-rib spacing (see below) were tested with the Pearson
correlation coefficient.
2.3 Small angle X-ray scattering data collection
We estimated the size of the spacing between scale ridges and between cross-ribs (Figure 1) using
small angle X-ray scattering (SAXS) carried out at the ID02 beamline at the European Synchrotron
effective area of 2048 x 2048 pixels (24 µm pixel size). The X-ray wavelength was 0.0995 nm
(12.45 keV), the beam was collimated to 50 µm x 50 µm and the accessible q-range was from 0.0017
to 0.07 nm-1 at 30.7m sample-to-detector distance. All 2D imageswere corrected for dark, spatial
distortion, normalised by transmitted flux and masked to account for the beam stop and the edges of
the detector. We azimuthally integrated the 2D images to obtain one dimensional patterns of scattered
intensity I as a function of the momentum transfer vector q, where q = (4 sin )/ . Here, 2 is the
scattering angle. A typical scattering profile of a Heliconius scale is shown in Figure 5.
Wings were mounted in a framethat could be rotated to precisely align the samples. We collected
between 33 and 113 measurements over 10-20 mm between two of the wing veins on the forewing
(Figure 3) of 74 H. erato individuals: 8 cyrbia, 1 demophoon, 6 F1 (from 2 crosses in reciprocal
directions) and 59 F2 (all from a single cross). In addition, we measured 4 Heliconius erato hydara
individuals to be analysed alongside the demophoon. The H. e. hydara were also collected in Panama,
do not have iridescent colour and differ from demophoon only in the lack of yellow hindwing bar. To
obtain estimates of the ridge spacing, we fitted the peak positions in the one dimensional scattered
intensity to a composite Lorentzian + linear profile using the lmfit Python module [29]. We then used
the centre of each fitted profile to calculate ridge spacing using the expression D = 2 /q and averaged
these to obtain a single estimate per individual. The average distances between ridges are in good
agreement with those previously reported for H. erato [9].
3. Results
3.1 Segregation of blue colour
Measurements of blue scores were shown to be repeatable, with 99% of variation due to differences
between individuals and 1% due to measurement error (R2 = 0.99, F
4,20 = 54159, p < 0.001; Table S3). H. erato demophoon showed very little blue colour with an average BR value of -0.56 ± 0.08
compared to iridescent H. erato cyrbia which had a mean value of 0.97 ± 0.05 (Table 2). The mean
for the F2 generation fell midway between the 2 parental races (Figure 6), suggesting additive effects
of alleles. The mean of the F1 was slightly skewed towards demophoon, although the median was in a
similar position to the F2 (0.13 and 0.14). The mean BR value of the backcrosses did not fall halfway
between that of the F1 and the parental race, which they were crossed with, but were skewed towards
cyrbia, the Ecuadorian race. This suggests that the effects of the alleles are not completely additive,
and there may be some dominance of the cyrbia alleles or epistatic interactions between loci.
The lack of discrete groups in the F2 generation suggests that variation in the trait is controlled by
more than one locus. Using the Castle-Wright estimator, with mean BR values and variances from
only one cross direction to reduce variation due to sex linkage (see subsequent results), we obtained
an estimate of 4.6 loci contributing to the trait. While this formula assumes that crosses started with
underestimates the total number of loci as it assumes loci all have equal effects. It is therefore perhaps
best interpreted as the likely number of loci with medium to large effects on the phenotype. In
addition, the F1 individual wings that we measured were of varying age and condition, which may
have increased the variance and decreased the mean value of blue reflectance seen in these individuals
relative to the F2 individuals, which were all preserved soon after emergence. This could influence the
estimation of the number of loci.
3.2 Sex linkage
Sex linkage leads to a difference in the trait between reciprocal crosses in the F1 generation, which is
confined to the heterogametic sex, or a difference between reciprocal crosses in the F2 generation in
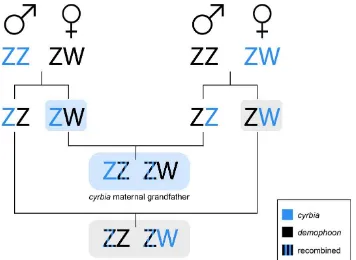
the homogametic sex [31]. As in birds, female butterflies are the heterogametic sex; they have ZW
sex chromosomes whereas males have ZZ. Differences would occur depending on which parent or
grandparent the Z or W is inherited from (Figure 7). If the sex difference is present in the parental
population, or the pattern is the same in reciprocal crosses, this would indicate a sex-limited trait (i.e.
an autosomal trait that is expressed differently between the sexes).
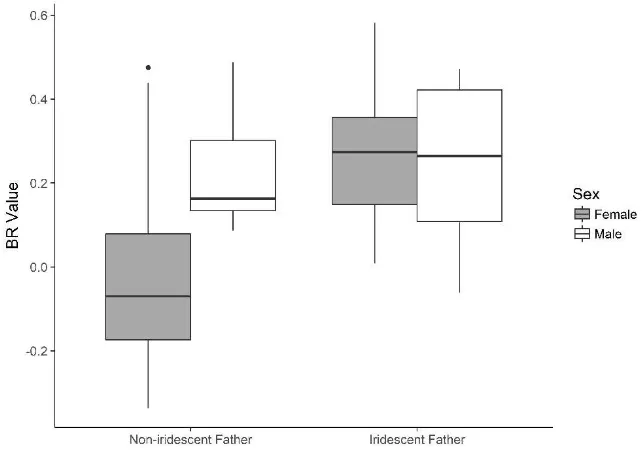
Comparing the F1 offspring of reciprocal crosses suggested some sex linkage (Figure 8; Table 3).
Offspring of crosses with a male cyrbia parent had significantly higher blue values than those which
had a female cyrbia parent. Separated by sex, there was no difference between the males from
reciprocal F1 crosses, which had a mean of 0.23 and 0.25 respectively (t(11) = -0.19, p = 0.85). The
variation was amongst the female offspring which had means of -0.03 and 0.26 (t(44) = -5.55,
p<0.001; Table 4).This pattern would be expected if there were one or more loci controlling
iridescence on the Z chromosome. In each case, males will be receiving one Z chromosome from an
iridescent parent, and the other from a non-iridescent parent. The female offspring, in contrast, will
only receive a Z chromosome from their father (Figure 7). To confirm that these results were not
biased by a particular cross, individual crosses were plotted and the same pattern was found (Figure
S1). We did not find any difference in blue score between the sexes in pure H. erato cyrbia (Table 3),
demonstrating that the difference between the sexes in the crosses is not due autosomally mediated
sexual dimorphism.
If blue colour was controlled only by genes on the Z chromosome, we would expect that females from
crosses with a non-iridescent father would have the same phenotype as demophoon females. However,
they are significantly bluer than wild demophoon, supporting the hypothesis that the colour is
controlled by multiple loci on different chromosomes (-0.03 ± 0.2 and -0.56 ± 0.1, t(25) = -10.6,
p<0.001).
In the F2 generation, sex linkage would be shown as males with an iridescent maternal grandfather
being more blue than those with an iridescent maternal grandmother. The results point towards this
sample sizes in the first group (Figure 9; Table 4). There was little difference in females. Overall,
however, offspring with an iridescent maternal grandfather were bluer than those with black maternal
grandfather. This is consistent with sex linkage, due to the greater number of “cyrbia” Z
chromosomes present in the F2 offspring with an iridescent maternal grandfather (Figure 7). Within
the offspring with an iridescent maternal grandfather, males were bluer than females, while this was
not the case for crosses with a black maternal grandfather, also supporting Z linkage (Table 3). In
summary, F1 females were bluer when they had an iridescent father, and males were bluer in the F2
when they had an iridescent maternal grandfather. There were no differences in BR values between
males and females in the parental races, H. e. demophoon and H. e. cyrbia. These results support the
presence of loci controlling iridescence in the Z chromosome.
3.3 Links to other colour pattern loci
In H. erato, the Cr locus controls the presence of a yellow forewing bar in demophoon and a white
margin in cyrbia. There were 3 observed phenotypes in the F2 generation – yellow bar present, white
margin present, and both absent (Figure 2). Consistent with the hypothesis that these two features are
controlled by recessive, tightly linked loci or are alternative alleles of the same locus, we did not find
any individuals that had both a yellow dorsal bar and a white margin present. The ratio of these traits
was also consistent with a 1:2:1 ratio as expected under the assumption that the individuals lacking
both features were heterozygous at this locus (x2 = 2.1, d.f. = 2, p = 0.35). There was no significant
difference in BR values between individuals with different Cr genotypes (F2,107 = 2.05, p = 0.133)
(Figure 10), suggesting that cortex is not one of the genes controlling iridescence, nor are there any
major effect loci linked to this region on Heliconius chromosome 15. In the F2, there were also no
significant correlations between blue colour and any of the standardised linear measurements used to
determine shape of the red forewing band (Table 5, Figure S2), showing iridescence is unlikely to be
linked to WntA on chromosome 10.
3.4 Nanostructure variation
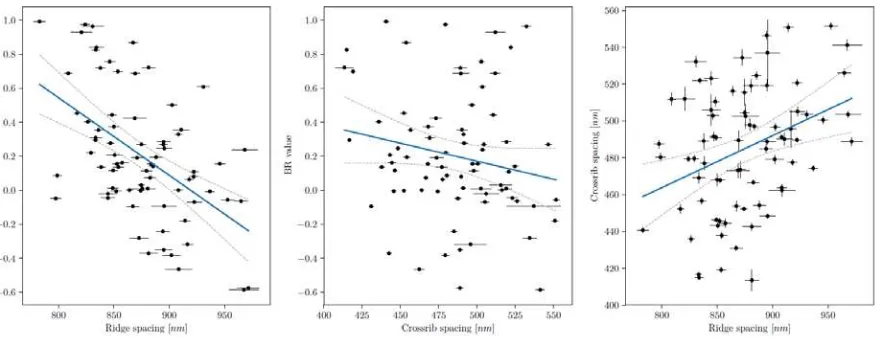
As we expected, there was a negative correlation between longitudinal ridge spacing and BR values (r
= -0.52, p<0.001; Figure 11), indicating that blue reflectance increases with increasing density of
ridges on the scale. The strength of this correlation shows that ridge spacing is only one factor which
is affecting the intensity of iridescence, and that other aspects of scale morphology that determine
blue reflectance may segregate somewhat independently in the crosses. BR values also declined with
increasing cross-rib spacing, although not significantly (r= -0.20, p = 0.09; Figure 11). Ridge spacing
and cross-rib spacing were highly correlated with each other (r= 0.34, p = 0.002; Figure 11)
suggesting a genetic correlation between these traits. Therefore, the correlation between cross-rib
spacing and BR value is likely due to this association between ridge and cross-rib spacing, as we do
Consistent with previous findings [9], H. erato cyrbia had closer ridge spacing than H. erato
demophoon (Table 6). Like the BR values, measurements of ridge spacing in the F2 generation fell
between the parental races (Figure 12) and were fairly continuous, consistent with the action of
multiple genes. Interestingly, ridge spacing in the F1 generation was highly variable between
individuals. This could indicate variation in epistatically acting alleles in the parental populations that
segregate in the F1 generation, or may suggest environmental effects. However, the phenotyped F1
individuals in this comparison were from two different reciprocal crosses, with apparent differences
between these two groups. Therefore, some of the variation that is observed may be due to
cross-specific genetic effects and possibly sex-linkage, but we have data from too few individuals to fully
dissect these effects.
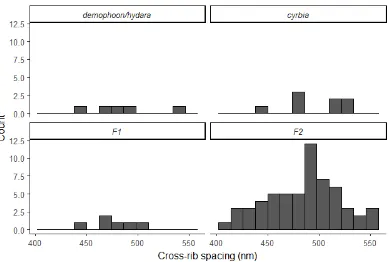
Cross-rib spacing in the F2 generation appears to extend beyond the range of the parental races
(Figure 13), again possibly indicating epistatically acting alleles in the parental populations, although
not all parental individuals were measured. Large variation in cross-rib spacing may be expected as it
is not predicted to have an effect on colour, so may be under weaker selection. In the F2 generation,
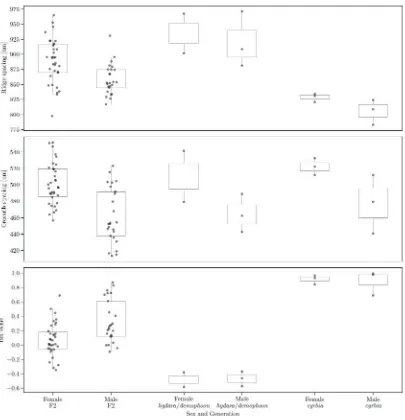
males had narrower longitudinal ridge spacing than females, which was similar to the differences seen
in this generation in blue values, and may suggest sex linkage of loci controlling ridge spacing (t(57)
= 3.80, p < 0.001; Figure 14). Cross-rib spacing was also smaller in males (t(43) = 4.95, p < 0.001),
supporting the idea that ridge spacing and cross-rib spacing may be genetically correlated.However,
in this case we cannot rule out a contribution of autosomally mediated sexual dimorphism because we
only have data from one F2 cross. There was not a significant difference in ridge spacing between
sexes in the parental populations (hydara/demophoon t(2.3) = 0.34, p = 0.77; cyrbia t(4.4) = 0.53, p =
0.63), but this may be due to small sample sizes and the differences were in the same direction as in
the F2, with females having larger spacing on average (Figure 14). There was a significant difference
in cross-rib spacing between sexes in cyrbia (t(5.6) = 3.42, p = 0.02) but not hydrara/demophoon
(t(1.4) = 1.35, p = 0.36). Nevertheless, the differences in ridge spacing seen within the parental races
are smaller than those seen in the F2 generation, supporting a role for sex linkage. Using the wing
measurements, there was not a significant difference in wing size between males (11.2 ± 0.5mm) and
females (10.9 ± 0.6mm) in the F2 (t(68) = -1.82, p = 0.07), and in fact males tended to be larger,
suggesting that the increased ridge and cross-rib spacing in females is not due to overall sexual size
dimorphism. Overall, ridge spacing appears to have a very similar genetic architecture to that of the
BR colour values, suggesting that it is also controlled by multiple loci.
4. Discussion
Our phenotypic analysis of crosses between iridescent and non-iridescent races shows that iridescence
is controlled by multiple loci in H. erato with convincing evidence for loci on the Z chromosome.
controlling colour and pattern, but although iridescence had been shown to segregate in crosses, the
trait has not been investigated due to the difficulty of quantifying the continuous phenotype and
measuring the number of different features affecting the colour. We show that standardised
photographs and the BR ratio is an effective method of estimating variation in blue iridescent
reflectance. As expected, iridescent H. erato cyrbia gave the highest blue values, and non-iridescent
H. e. demophoon the lowest. BR values correlated with longitudinal ridge spacing, which has
previously been shown to have an effect on the brightness of the blue iridescent colour [9]. The
distribution of blue values in the F2 generation suggests that variation in the trait is not controlled by a
single locus.
The differences in blue values found between sexes in the F1 reciprocal erato crosses suggest that
there could be a major effect locus involved in iridescent colour on the Z chromosome. We may
expect that genes on the sex chromosomes will control sexually selected traits [32]. Reinhold [33]
calculated that in Drosophila around a third of phenotypic variation in sexually selected traits was
caused by X-linked genes, and that X-linked genes only influenced traits classified as under sexual
selection. Iridescent structural colours are used as sexual signals in many butterfly species [2,34,35].
Work with Colias butterflies has found many wing pattern elements are sex-linked, including
melanisation, UV reflectance and yellow wing pigmentation [36,37]. These studies found that sex
linkage was important in prezygotic isolation and species differentiation. Therefore, sex linkage of
iridescence in Heliconius may have contributed to the differentiation of this trait between
geographical races.
Unlike some Lepidoptera, Heliconius do not show complete sex chromosome dosage compensation.
Analysis of H. cydno and H. melpomene gene expression showed a modest dosage effect on the Z
chromosome, and overall reduced expression compared to autosomes [38]. Our results are also
consistent with a lack of complete dosage compensation, with some evidence for expression of both Z
chromosome alleles in males. A lack of dosage compensation could also favour the build-up of
sexually selected or sexually antagonistic loci on the Z chromosome, as these will automatically be
expressed differently between the sexes.
The three erato phenotypes controlled by the Cr locus did not show any correlation with iridescent
colour values. The gene cortex, found in this genomic region, has been shown to underlie these colour
pattern differences [16]. There are several reasons why major colour patterning genes could have been
hypothesised to also control structural colour variation in Heliconius. Knockouts of one of the genes
that control colour pattern in Heliconius, optix, in Junonia coenia butterflies resulted in a change in
pigmentation, and the gain of structural colour [39], although this was not observed in the same tests
with Heliconius erato. In addition, linkage between divergently selected loci would be expected under
from recombination during speciation [40]. Hitchhiking regions can be small in natural populations
unless recombination is reduced, but in Lepidoptera there is no recombination in the female
germ-line. Furthermore, for highly polygenic traits we would expect many loci to be distributed throughout
the whole genome, so that for any genetic marker there will be some phenotypic association.
Individuals with homozygous Cr phenotypes, for example, will have inherited an entire chromosome
15 from either an iridescent or non-iridescent grandparent, due to the lack of female recombination.
Therefore, any combination of a single major effect locus or multiple smaller effect loci on
chromosome 15 would have been seen as a difference in iridescence between individuals with
different Cr phenotypes. The fact that we find no association with Cr suggests that structural colour is
not highly polygenic, but controlled by a moderate number of loci, none of which are located on
chromosome 15. It is also consistent with it being controlled independently of colour pattern.
Similarly, we see no association with variation in forewing red band size, which is largely determined
by the gene WntA. This region on chromosome 10 controls forewing band shape in multiple races of
H. erato, as well as other Heliconius species [12].
In Heliconius pigment colour patterns, a small set of major effect genes have been well studied but a
larger set of “modifier” loci have also been found which adjust colour pattern [12]. It is possible that
the iridescence genes have a similar distribution of effect sizes, with a small number of major effect
genes, including one on the Z chromosome, and a distribution of other smaller effect genes. This
supports the existing evidence of the importance of major effect loci in adaptive change [10–12].
Future work with the co-mimic of erato, Heliconius melpomene, will allow us to compare the genetic
basis of iridescence between the two species. Following the two-step process of Müllerian mimicry
described by Turner [41,42], a large effect mutation, such as the one we have found on the Z
chromosome, allows an adaptive phenotypic change large enough for the population to resemble those
in the mimicry ring and survive, then smaller changes will produce incremental improvements in
mimicry.
Longitudinal ridge spacing also appears to have a polygenic architecture. The continuous variation
that is observed in blue colour in the F2 broods does not seem to be due to major effect loci with
discrete effects on different aspects of scale structure. Rather it seems that multiple interacting genes
are involved in controlling scale morphology. The correlation between ridge and cross-rib spacing
suggests that some of these loci produce correlated effects on various aspects of scale morphology.
However, the fact that we do not see a perfect correlation between these and blue colour suggests that
there is some independent segregation of other aspects of scale morphology that contribute to the
colour. Measurements of other aspects of scale morphology, such as ridge curvature and layering, will
be needed to confirm this.
Crosses are ideal for investigating the genetic basis of colour and pattern as traits will segregate in
following generations. Crossing iridescent and non-iridescent Heliconius erato has allowed us to
quantify variation in the colour and determine that it is sex-linked and controlled by multiple loci.
Acknowledgements
We thank the governments of Ecuador and Panama for permission to collect butterflies. Thanks to
Juan López and Gabriela Irazábal for their assistance with the crosses. We are grateful to the
European Synchrotron Radiation Facility for provision of X-ray beamtime under proposal LS2720
and to Andrew Dennison for assistance with SAXS data collection.
Data accessibility
SAXS data (doi:10.15131/shef.data.6839315) and accompanying code (doi:
10.15131/shef.data.6837905) have been uploaded to an online repository. Colour measurements,
repeatability measurements and cross pedigree information can be found as part of the electronic
supplementary material.
Authors’ contributions
MNB collected the colour data, performed the genetic analysis and wrote the manuscript. JER
analysed the SAXS data under the supervision of AJP. AJP co-ordinated collection of the SAXS data.
The crosses were performed by PAS, CM, DC, MNB, NJN and EVC. The SAXS data was collected
by AJP, TZ, EVC, NJN and MNB. Wing size and red band measurements were performed by HEB.
The study was devised and co-ordinated by NJN. All authors read and commented on the manuscript.
Competing Interests
We declare we have no competing interests.
Funding
This work was funded by the UK Natural Environment Research Council (NERC) through an
Independent Research Fellowship (NE/K008498/1) to NJN. MNB and EVC are funded by the NERC
doctoral training partnership, ACCE. JER is funded through the Leverhulme Centre for Advanced
Biological Modelling as well as scholarships from Universidad del Rosario and the University of
Sheffield.
References
(Lepidoptera: Lycaenidae: Polyommatinae). J. R. Soc. Interface 9, 1745–56. (doi:10.1098/rsif.2011.0854)
2. Sweeney A, Jiggins C, Johnsen S. 2003 Insect communication: Polarized light as a butterfly mating signal. Nature 423, 31–32. (doi:10.1038/423031a)
3. Hadley NF, Savill A, Schultz TD. 1992 Coloration and its thermal consequences in the New Zealand tiger beetle Neocicindela perhispida. J. Therm. Biol. 17, 55–61.
4. Vukusic P, Sambles JR, Lawrence CR, Wootton RJ. 1999 Quantified interference and diffraction in single Morpho butterfly scales. Proc. R. Soc. B Biol. Sci. 266, 1403. (doi:10.1098/rspb.1999.0794)
5. Winter B, Butz B, Dieker C, Schröder-Turk GE, Mecke K, Spiecker E. 2015 Coexistence of both gyroid chiralities in individual butterfly wing scales of Callophrys rubi. Proc. Natl. Acad.
Sci. 112, 12911 LP-12916.
6. Dinwiddie A, Null R, Pizzano M, Chuong L, Leigh Krup A, Ee Tan H, Patel NH. 2014 Dynamics of F-actin prefigure the structure of butterfly wing scales. Dev. Biol. 392, 404–418. (doi:10.1016/j.ydbio.2014.06.005)
7. Merrill RM et al. 2015 The diversification of Heliconius butterflies: what have we learned in 150 years? J. Evol. Biol. 28, 1417–1438. (doi:10.1111/jeb.12672)
8. Wilts BD, Vey AJM, Briscoe AD, Stavenga DG. 2017 Longwing (Heliconius) butterflies combine a restricted set of pigmentary and structural coloration mechanisms. BMC Evol. Biol.
17, 1–12. (doi:10.1186/s12862-017-1073-1)
9. Parnell AJ et al. 2018 Wing scale ultrastructure underlying convergent and divergent iridescent colours in mimetic Heliconius butterflies. J. R. Soc. Interface 15, 20170948. (doi:10.1098/rsif.2017.0948)
10. Joron M et al. 2006 A Conserved Supergene Locus Controls Colour Pattern Diversity in
Heliconius Butterflies. PLoS Biol. 4, 1831–1840. (doi:10.1371/journal.pbio.0040303)
11. Baxter SW, Papa R, Chamberlain N, Humphray SJ, Joron M, Morrison C, ffrench-Constant RH, McMillan WO, Jiggins CD. 2008 Convergent Evolution in the Genetic Basis of Mullerian Mimicry in Heliconius Butterflies. Genetics 180, 1567–1577.
(doi:10.1534/genetics.107.082982)
12. Papa R, Kapan DD, Counterman BA, Maldonado K, Lindstrom DP, Reed RD, Nijhout HF, Hrbek T, McMillan WO. 2013 Multi-Allelic Major Effect Genes Interact with Minor Effect QTLs to Control Adaptive Color Pattern Variation in Heliconius erato. PLoS One 8, e57033. (doi:10.1371/journal.pone.0057033)
13. Nadeau NJ. 2016 Genes controlling mimetic colour pattern variation in butterflies. Curr. Opin.
Insect Sci. 17, 24–31. (doi:10.1016/j.cois.2016.05.013)
14. Emsley M. 1965 The geographical distribution of the color-pattern components of Heliconius
erato and Heliconius melpomene with genetical evidence for the systematic relationship
between the two species. Zoologica 49, 245–286.
15. Lynch M, Walsh B. 1998 Analysis of Line Crosses. In Genetics and Analysis of Quantitative
Traits, pp. 205–250. Sinauer Associates, Massachusetts.
16. Nadeau NJ et al. 2016 The gene cortex controls mimicry and crypsis in butterflies and moths.
Nature 534, 106–110. (doi:10.1038/nature17961)
17. Martin A et al. 2012 Diversification of complex butterfly wing patterns by repeated regulatory evolution of a Wnt ligand. Proc. Natl. Acad. Sci. 109, 12632–12637.
18. Mazo-Vargas A et al. 2017 Macroevolutionary shifts of WntA function potentiate butterfly wing-pattern diversity. Proc. Natl. Acad. Sci. , 201708149. (doi:10.1073/pnas.1708149114)
19. Mallet J. 1989 The Genetics of Warning Colour in Peruvian Hybrid Zones of Heliconius erato and H. melpomene. Proc. R. Soc. B Biol. Sci. 236, 163–185. (doi:10.1098/rspb.1989.0019)
20. Abramoff, M.D., Magalhaes PJ, Ram SJ. 2004 Image Processing with ImageJ. Biophotonics
Int. 11, 36–42.
21. Comeault AA, Carvalho CF, Dennis S, Soria-Carrasco V, Nosil P. 2016 Color phenotypes are under similar genetic control in two distantly related species of Timema stick insect. Evolution
(N. Y). 70, 1283–1296. (doi:10.1111/evo.12931)
22. Whitlock MC. 2007 The analysis of biological data. 1st Edition. Roberts & Company Publishers. (doi:10.1080/03610927808827682)
23. Cockerham CC. 1986 Modifications in estimating the number of genes for a quantitative character. Genetics 114, 659–664.
24. Otto SP, Jones CD. 2000 Detecting the undetected: estimating the total number of loci inderlying a quantitative trait. Genetics 156, 2093–2107. (doi:10.1007/s001220050781)
25. Mallet J. 1986 Hybrid zones of Heliconius butterflies in Panama and the stability and
movement of warning colour dines. Heredity (Edinb). 56, 191–202. (doi:10.1038/hdy.1986.31)
26. Baxter S, Johnston S, Jiggins C. 2009 Butterfly speciation and the distribution of gene effect sizes fixed during adaptation. Heredity (Edinb). 102, 57–65. (doi:10.1038/hdy.2008.109)
27. R Core Team. 2018 R: A language and environment for statistical computing. Foundation for Statistical Computing, Vienna, Austria. Available at https://www.r-project.org
28. Van Vaerenbergh P, Lonardon J, Sztucki M, Boesecke P, Gorini J, Claustre L, Sever F, Morse J, Narayanan T. 2016 An upgrade beamline for combined wide, small and ultra small-angle x-ray scattering at the ESRF. AIP Conf. Proc. 1741. (doi:10.1063/1.4952857)
29. Newville M, Stensitzki T, Allen DB, Ingargiola A. 2014 LMFIT: Non-Linear Least-Square Minimization and Curve-Fitting for Python. Astrophys. Source Code Libr.
(doi:10.5281/zenodo.11813)
30. Lande R. 1981 The minimum number of genes contributing to quantitative variation between and within populations. Genetics 99, 541–553.
31. Mather K, Jinks JL. 1982 Biometrical Genetics. 3rd edition. Cambridge University Press.
32. Fairbairn DJ, Roff DA. 2006 The quantitative genetics of sexual dimorphism: assessing the importance of sex-linkage. Heredity (Edinb). 97, 319–328. (doi:10.1038/sj.hdy.6800895)
33. Reinhold K. 1998 Sex linkage among genes controlling sexually selected traits. Behav. Ecol.
Sociobiol. 44, 1–7.
34. Kemp DJ. 2007 Female butterflies prefer males bearing bright iridescent ornamentation. Proc.
R. Soc. B Biol. Sci. 274, 1043–1047. (doi:10.1098/rspb.2006.0043)
35. Rajyaguru PK, Pegram K V., Kingston ACN, Rutowski RL. 2013 Male wing color properties predict the size of nuptial gifts given during mating in the Pipevine Swallowtail butterfly (Battus philenor). Naturwissenschaften 100, 507–513. (doi:10.1007/s00114-013-1046-1)
36. Silberglied RE. 1979 Communication in the Ultraviolet. Annu. Rev. Ecol. Syst. 10, 373–398. (doi:10.1146/annurev.es.10.110179.002105)
38. Walters JR, Hardcastle TJ, Jiggins CD. 2015 Sex chromosome dosage compensation in
Heliconius butterflies: Global yet still incomplete? Genome Biol. Evol. 7, 2545–2559.
(doi:10.1093/gbe/evv156)
39. Zhang L, Mazo-Vargas A, Reed RD. 2017 Single master regulatory gene coordinates the evolution and development of butterfly color and iridescence. Proc. Natl. Acad. Sci. , 201709058. (doi:10.1073/pnas.1709058114)
40. Via S, West J. 2008 The genetic mosaic suggests a new role for hitchhiking in ecological speciation. Mol. Ecol. 17, 4334–4345. (doi:10.1111/j.1365-294X.2008.03921.x)
41. Turner J. 1977 Butterfly mimicry: the genetical evolution of an adaptation. Evol. Biol. 10, 163–206.
42. Turner JRJ. 1981 Adaptation and Evolution in Heliconius: A Defense of NeoDarwinism.
Annu. Rev. Ecol. Syst. 12, 99–121.
[image:17.595.223.373.381.532.2]Figures
Figure 1. Scanning Electron Microscope image showing the structures on a Heliconius wing scale.
Longitudinal ridges, composed of overlapping lamellae, are connected by cross-ribs.
Figure 2. Cross design and examples of colour pattern variation in H. erato F1, F2, and backcross
[image:18.595.209.379.579.696.2]generations. Examples of the Cr genotypes are shown in the F2 generation.
Figure 3. RGB values were measured in the hatched areas highlighted on the right wings and
averaged for each butterfly. Left wings were used when the right side were too damaged. Small angle
Figure 4. Four measurements of forewing band width were taken (bold arrows) along with three
further measurements to standardise wing size (dotted arrows), using wing veins as points of
reference.
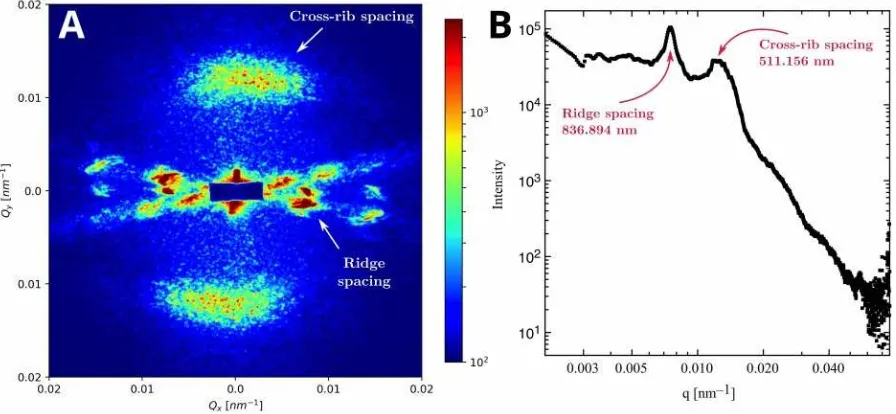
Figure 5. Representative small angle X-ray scattering patterns for a single frame of a male H. e.
cyrbia parent. (A) The 2D pattern reveals approximately perpendicular scattering intensity from scale
features. From their orientation, length scales of the scattered intensity and previous interpretations,
we infer that they correspond to the spacing between ridges and cross-ribs. (B) Full azimuthal
integration of the scattered intensity as a function of the magnitude of the momentum transfer vector
q. The peaks corresponding to ridge and cross-rib spacing are indicated together with the
[image:19.595.77.525.406.613.2]Figure 6. Mean BR values across H. erato generations. F1 and F2 individuals largely fall between the
parental demophoon and cyrbia races. The backcross generation (BC) are highly skewed towards
cyrbia, which is the race they were crossed with.
Figure 7. If there are loci of interest on the Z chromosome, F1 females with an iridescent cyrbia
father will be bluer than those with a non-iridescent demophoon father because they inherit an
“cyrbia” Z chromosome. In the F2, males always inherit a complete, non-recombined Z chromosome
from their maternal grandfather, so if he is iridescent they will be bluer than offspring from the
[image:20.595.121.477.491.751.2]Figure 8. F1 females with an iridescent cyrbia father were significantly bluer than those with a
demophoon father. There were no differences in males.
Figure 9. Mean BR values for F2 males with an iridescent maternal grandfather (MGF) were higher
than those with an iridescent maternal grandmother, although not significantly. Females in both
[image:21.595.142.452.463.648.2]Figure 10. In the F2 generation, BR values did not differ with the different Cr phenotypes. CrdCrd
represents the demophoon genotype with the yellow bar present, and CrcCrc is the cyrbia genotype
with the white margin. CrdCrc is heterozygous and has neither of these elements.
Figure 11. An increase in longitudinal ridge spacing correlated with a decrease in BR values. Blue
colour slightly decreased with cross-rib spacing, but ridge spacing and cross-rib spacing were also
highly correlated. The cross-hairs show the standard error from the 33 to 133 SAXS point
measurements for each individual. Blue lines indicate the fitted linear regression, with the dotted lines
[image:22.595.83.523.508.677.2]Figure 12. Variation in longitudinal ridge spacing in the F2 suggests it is controlled by multiple
genes. In the F1, those with an iridescent father had lower ridge spacing, reflecting the higher BR
[image:23.595.113.487.168.418.2] [image:23.595.106.495.477.739.2]values seen in this cross.
Figure 13. Cross-rib spacing also shows continuous variation in the F2 generation, and extremes
Figure 14. Males have narrower longitudinal ridge spacing than females in the F2. This difference is
less pronounced and not significant in the parental races. Significant differences in cross-rib spacing
were seen in cyrbia and in the F2, with males again having narrower spacing. These results are
Tables
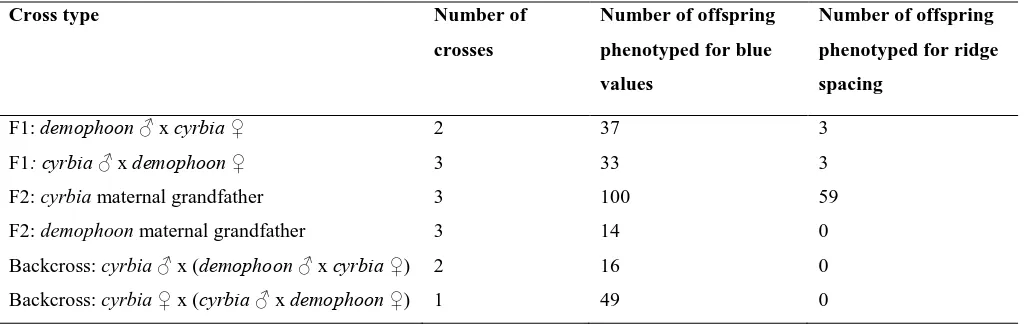
Table 1. H. erato crosses performed and the number of offspring produced from each. See
supplementary Table S2 for details of each cross.
Cross type Number of
crosses
Number of offspring
phenotyped for blue
values
Number of offspring
phenotyped for ridge
spacing
F1: demophoon x cyrbia 2 37 3
F1: cyrbia x demophoon 3 33 3
F2: cyrbia maternal grandfather 3 100 59
F2: demophoon maternal grandfather 3 14 0
Backcross: cyrbia x (demophoon x cyrbia ) 2 16 0
[image:25.595.76.528.428.564.2]Backcross: cyrbia x (cyrbia x demophoon ) 1 49 0
Table 2. Summary statistics for BR values in each generation of H. erato.
Generation Mean BR
value
Standard
deviation
Variance Sample size
demophoon -0.56 0.08 0.01 12
F1 0.13 0.23 0.05 60
Backcross 0.69 0.28 0.08 65
F2 0.21 0.30 0.09 114
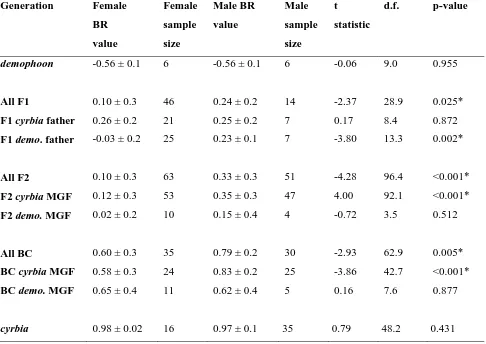
Table 3. Comparison of BR values (± SD) between females and males in each H. erato generation.
Males are bluer than females in crosses with a demophoon father or cyrbia maternal grandfather
(MGF). Males are also bluer in backcrosses with a cyrbia MGF. There are no differences in the
parental races.
Generation Female
BR
value
Female
sample
size
Male BR
value
Male
sample
size
t
statistic
d.f. p-value
demophoon -0.56 ± 0.1 6 -0.56 ± 0.1 6 -0.06 9.0 0.955
All F1 0.10 ± 0.3 46 0.24 ± 0.2 14 -2.37 28.9 0.025*
F1 cyrbia father 0.26 ± 0.2 21 0.25 ± 0.2 7 0.17 8.4 0.872
F1 demo. father -0.03 ± 0.2 25 0.23 ± 0.1 7 -3.80 13.3 0.002*
All F2 0.10 ± 0.3 63 0.33 ± 0.3 51 -4.28 96.4 <0.001*
F2 cyrbia MGF 0.12 ± 0.3 53 0.35 ± 0.3 47 4.00 92.1 <0.001*
F2 demo. MGF 0.02 ± 0.2 10 0.15 ± 0.4 4 -0.72 3.5 0.512
All BC 0.60 ± 0.3 35 0.79 ± 0.2 30 -2.93 62.9 0.005*
BC cyrbia MGF 0.58 ± 0.3 24 0.83 ± 0.2 25 -3.86 42.7 <0.001*
BC demo. MGF 0.65 ± 0.4 11 0.62 ± 0.4 5 0.16 7.6 0.877
[image:26.595.77.563.157.501.2]cyrbia 0.98 ± 0.02 16 0.97 ± 0.1 35 0.79 48.2 0.431
Table 4. Comparison of BR values for offspring from reciprocal F1 crosses, which had either an
iridescent mother or iridescent father, and for F2 crosses, which had either an iridescent maternal
grandfather or grandmother. Mean values and sample sizes are shown in Table 3.
F1 cyrbia or demophoon father F2 cyrbia or demophoon maternal grandfather
t d.f. p-value t d.f. p-value
Female -5.55 43.6 <0.001* Female -1.64 19.5 0.118
Male -0.19 10.8 0.850 Male -1.06 3.4 0.357
Table 5. There are no significant correlations between the forewing red band measurements and BR
colour in the F2 generation. Measurements are ratios of band measurements to wing size. Degrees of
freedom = 69. N = 71.
Standardised measurement
Mean Standard deviation
t r p-value
Linear 1 0.76 0.08 -1.65 -0.20 0.10
Linear 2 0.55 0.06 -1.41 -0.17 0.16
Linear 3 0.35 0.05 -1.69 -0.20 0.10
Linear 4 0.41 0.05 0.38 0.05 0.71
Table 6. Mean spacing (±SD) between longitudinal ridges and between cross-ribs. The narrower ridge
spacing in cyrbia results in a brighter iridescent colour. The mean values for the F1 and F2
generations fell between the values for the parental races.
Generation Mean longitudinal ridge spacing (nm)
Mean cross-rib spacing (nm)
Sample size (Male, Female)
demophoon/hydara 926.05 ± 40.1 482.87 ± 37.1 5 (3, 2)
F1 875.64 ± 57.8 476.66 ± 20.0 6 (4, 2)
F2 876.25 ± 36.0 484.46 ± 35.0 59 (25, 34)
[image:27.595.77.540.344.472.2]