Cataloguing data can be found at the end of this publication.
Luxembourg: Office for Official Publications of the European Communities, 2004
ISBN 92-894-7444-0
© European Communities, 2004
Reproduction is authorised provided the source is acknowledged.
Printed in Belgium
For the year 2003 the Union was entrusted with a budget of EUR 99.7 billion in commitment appropriations, an increase of only 0.26 % over the 2002 budget. The payment appropriations amounted to EUR 98.4 billion, which represented only 1.02 % of Community gross national in-come (GNI). This budget successfully combined budgetary rigour while meeting European poli-cy priorities. The funds were used to prepare for enlargement, to foster stability and security in the EU and outside, as well as to encourage sustainable and inclusive economic development. As in previous years specific new demands occurred in the field of foreign policy. Funding was secured for humanitarian aid and a first tranche of reconstruction aid for Iraq after the war. The role of the EU in foreign policy was strengthened when the EU budget took over financing of a joint European police force in Bosnia-Herzegovina, asserting the Community aspects of joint actions to ensure stability.
The exceptional heat and drought in summer 2003 had an impact on spending on agriculture. To help farmers, payments normally scheduled for 2004 were advanced to 2003. The climatic con-ditions also caused major forest fires in Portugal, Spain and France. The new Solidarity Fund in-strument, only created in 2002, provided Union aid for the affected regions.
At the end of 2003 a total of EUR 90.6 billion had been spent. EUR 5 billion was already hand-ed back to Member States during the year, EUR 2.2 billion was carrihand-ed over to 2004, and a sur-plus of EUR 5.5 billion entered into the 2004 budget thus lowering the contributions from Member States to that budget.
Important steps for the preparation of enlargement to 10 new Member States were taken in 2003. In December 2002 agreement was reached at the Copenhagen European Summit on amounts for the new Member States for the period 2004–06. In spring 2003 the Financial Per-spective was adjusted accordingly, to have all necessary preparations ready in time for the sign-ing of the Accession Treaties in April 2003 in Athens as planned. The adjusted Financial Per-spective also includes budgetary provisions for the Turkish Cypriot Community in the event of the settlement of the de facto division of the country.
In 2003 the Commission started to prepare the next financial framework for the years 2007–13 as the current financial perspective, decided at the 1999 Berlin Summit will expire at the end of 2006. The Commission has focussed on the objectives that the Union wishes to achieve in the next years. The EU is aiming to become the most competitive and dynamic knowledge-based economy in the world by 2010. It aims to create an area of freedom, security and justice. Europe has decided to take on more responsibilities in the wider world and the inte-gration of the new Member States should make a success of enlargement. At the same time, the proposal must respect budgetary discipline and rigour.
1.14 % of EU GNI over the period. With its proposal ‘Building our common future: policy chal-lenges and budgetary means of the enlarged Union, 2007-2013’ the Commission has opened the negotiations. It is convinced that the EU budget offers real value added for the areas it covers. This report on the 2003 budget shows in how many areas the EU is active with the help of the EU budget, which makes up less than 2.5 % of public expenditure. For that, EU citizens have the advantages of an internal market, a highly developed common agriculture, the economic support for the poorer regions to encourage cohesion, a high level of environmental protection, joint research actions, support for mobility of students and teachers, trainees to learn with and from each other and, last but not least, the largest and most successful peace project in the world. That shows just how good an investment the EU budget really is.
Page 1. The economic situation of the European Union in 2003 7
2. The financial framework of the European Union:
future challenges for the enlarged Union 2007–13 9
3. Establishing the 2003 budget 14
4. EU budget revenue in 2003 21
5. Budget implementation in 2003 26
6. Policy areas and activities by activity-based budgeting 34
— Economic and financial affairs 36
— Enterprise 38
— Competition 40
— Employment and social affairs 42
— Agriculture and rural development 44
— Energy and transport 46
— Environment 50
— Indirect research 52
— Information society 56
— Direct research 58
— Fisheries 60
— Internal market 62
— Regional policy 64
— Taxation and customs union 66
— Education and culture 68
— Press and communication 70
— Health and consumer protection 72
— Justice and home affairs 74
— External relations 76
— Trade 80
— Development and relations with ACP countries 82
— Enlargement 84
— Humanitarian aid 86
Page
7. Fight against fraud 91
8. Borrowing and lending activities 96
9. Treasury report 101
10. European Development Fund 103
Annexes
I: Evolution of the budget of the European Union 1958–2003 109
The turnaround in economic activity in the EU came in the third quarter of 2003. GDP in the euro area increased by 0.4 % quarter-on-quarter in the third quarter-on-quarter, after three quarter-on-quarters of stagnation. Data from survey indicators suggest a consolidation of the pace of the re-covery during the fourth quarter of 2003. In the third quarter of 2003, net exports stopped being a drag on economic activity, as foreign demand increased. Exports of goods and ser-vices grew by 1.8 % in the third quarter after three quarters of negative growth. Imports, on the other hand, remained negative, reflecting the weakness of domestic demand. In the au-tumn 2003 forecast, the average growth rate of GDP was estimated to be 0.8 % in the EU as a whole and 0.4 % in the euro area in 2003.
Private consumption grew by 0.3 % in the third quarter for the EU as a whole. However, in the euro area private consumer spending grew by only 0.1 % in the third quarter. Stub-born inflation and uncertainties regarding em-ployment growth are still weighing on con-sumer confidence and probably pushing the savings rate up. Ongoing pension reform plans in several Member States might also have contributed to an upward adjustment of savings. Investment fell during each of the first three quarters of 2003. However, the speed of the decline in investment slowed down through the year. From a 1.2 % quarter-on-quarter fall in the first quarter, the negative growth of investment was no more than 0.2 % in the third quarter. Preliminary information based on business surveys suggests better prospects for investment growth in the fourth quarter of 2003.
Exports and imports of goods and services had been on a decelerating trend since the be-ginning of 2001, primarily because of weak global demand. The growth contribution of net exports turned negative in the last quarter of 2002. However, in the third quarter of
2003, the improved global environment boost-ed exports significantly, leading to a large positive contribution of net exports to GDP growth.
Inflation, measured by the harmonised index of consumer prices (HICP), in the European Union as a whole slowed to 1.8 % year-on-year in December 2003 from 2.3 % in March. Since April, headline inflation has not exceed-ed the annual rate of 2 %. Core inflation (headline excluding unprocessed food and en-ergy) hovered within the range of 1.7 and 2 % throughout 2003. In the euro area, HICP infla-tion was slightly higher than that for the EU as a whole, reaching 2 % in December. Al-though it dipped below 2 % in July, inflation was then boosted by rises in energy and un-processed food prices.
Employment growth was flat in the first half of 2003 and weak employment for the second half of the year is expected, in part reflecting a delayed response to the recent slowdown in economic activity. At sectoral level, some contrasting developments were apparent, as employment continued to contract in agricul-ture and in industry, while it increased in ser-vices and construction. The rise of the unem-ployment rate in the euro area, standing at 8.8 % in December, was limited when compared with the 8.6 % recorded in December 2002. The EU-15 unemployment rate stood at 8 % in December 2003, while it was 7.9 % one year earlier. However, in several Member States the unemployment rate continued to in-crease rather sharply.
bal-ance deteriorated in almost all EU countries. The debt to GDP ratio for the EU as a whole is estimated at 64.1 % in 2003, compared with 62.5 % in 2002. For the euro area, the debt to GDP ratio increased to 70.4 % in 2003, from 69 % in 2002.
Stock markets reached their lowest levels since 1997 just before the outbreak of the war in Iraq in March 2003. After it became clear that the war would be short-lived and that damages to oil supplies would be limited, stock markets staged a recovery. An additial boost was provided, from mid-2003 on-wards, by growing evidence of stronger growth in the US and, to a lesser extent, in Japan.
Introduction
Ambitious goals have seen, among others, the Community grow from its six founder mem-bers to a Union of 15 Member States in 1995 and from 1 May 2004 an enlargement to 25 Member States with a combined population of more than 450 million. This enlarged Union presents unique opportunities for improving the prosperity and quality of life of every EU citizen. The challenge is to seize this poten-tial and to do this, appropriate instruments are needed. One such instrument is the EU budget which, since 1988, has been defined within a financial framework covering several years — the financial perspective. Successive finan-cial perspectives have reflected common po-litical ambitions, such as enlargement. The choices to be made are not just about money, but how to maximise the impact of EU com-mon policies so that the added value of every euro spent at EU level is further improved.
Overview of the financial
perspective system
In the late 1980s, the financial perspective system was pioneered by the then Commis-sion President Jacques Delors, to strengthen budgetary discipline, improve the budgetary procedure and encourage interinstitutional co-operation. It is an instrument whereby the Community’s institutions (Parliament, Coun-cil and Commission), based on a proposal by the Commission, agree in advance on the main budgetary priorities for a given period and establish a framework for Community ex-penditure. So far, three multiannual financial packages have been adopted: Delors 1 (1988 to 1992); Delors 11 (1993 to 1999); and Agenda 2000, the current package covering 2000 to 2006.
The financial perspective cannot be regarded as a multiannual budget in the true sense as the annual budgetary procedure is essential for
de-termining the actual level of spending under the agreed ceilings. It sets the framework.
The financial perspective defines the maxi-mum amounts (ceilings) and the composition of foreseeable expenditure, and is divided into headings reflecting the various policy options revolving around the main political priorities adopted for the period in question. This ap-proach facilitates the assessment of the funds that need to be provided to implement each of these priorities and enhances predictability as to the evolution of EU expenditure. Each heading has an amount of commitment appro-priations for each year. In addition the maxi-mum indicative amount of payment appropri-ations expressed as a percentage of Community gross national income (GNI) is given, which must respect the own resources (the revenue from Member States to finance the expenditure) ceiling that is also fixed as a percentage of Community GNI.
Between these two ceilings there is a safety margin for unforeseen expenditure that might arise in the event of lower growth than antici-pated or unforeseen crises. In addition, other adjustments are allowed by the agreement of the three institutions as follows.
An annual technical adjustment to take ac-count of the most recent economic envi-ronment, for example, the evolution of economic growth and inflation so as to en-sure that the initial allocated expenditure retains its purchasing power.
A revision in the event of unforeseen cir-cumstances in compliance with the own re-sources ceiling. In principle this revision is intended to cover important and lasting changes of policy priorities.
While the ceilings of the financial perspective are binding, to face growing unforeseen needs during the annual budgetary procedure a gen-eral flexibility instrument with an annual ceil-ing of EUR 200 million was created under the current financial package (Agenda 2000). This is meant to cover clearly identified ex-penditure for a given financial year that can-not be met from within existing ceilings of the financial perspective. Based on a Commission proposal and the agreement of the other insti-tutions it has been mobilised regularly since 2000, for example, to finance the reconstruc-tion of Kosovo.
Furthermore, following the disastrous floods in central Europe during summer 2002, anoth-er flexibility device, the European Union Soli-darity Fund was agreed. It has an annual max-imum amount of EUR 1 billion that can be mobilised above the financial perspective ceiling to provide rapid financial assistance in the event of such events.
The current financial
package: Agenda 2000
Preparations for the negotiations on the cur-rent financial package covering 2000 to 2006 started in July 1997, when the Commission is-sued the communication, ‘Agenda 2000: For a Stronger and Wider Union’. This document covered the political ambitions of the time:
reform of the common agricultural policy (CAP),
future of economic and cohesion policy, establishment of a pre-accession strategy, consequences of future enlargement, and financing of the Community.
A reference financial framework for the years 2000 to 2006 was also presented by the Com-mission that included provision for the devel-opment of the Community’s policies and for the accession of a number of the applicant countries without changing the own resource ceiling of 1.24 % of GNI.
In March 1998, following discussions of these documents by the institutions, the Commis-sion presented a proposal for the new finan-cial perspective. It included a set of legislative proposals on the reform of CAP, new guide-lines on structural operations and pre-acces-sion aid and a report on the implementation and renewal of the 1993 interinstitutional agreement. In October 1998, the Commission completed the series of Agenda 2000 docu-ments by presenting a report on the operation of the own resources system.
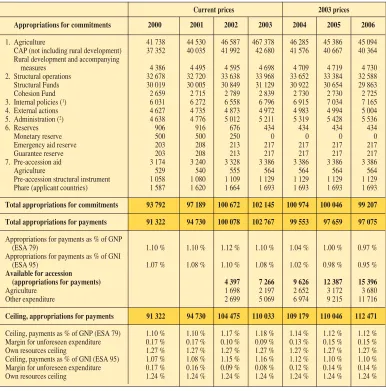
TABLE 1
Financial perspective (EU-15) — adjusted to 2003 prices
(million EUR)
Current prices 2003 prices
Appropriations for commitments 2000 2001 2002 2003 2004 2005 2006
1. Agriculture 41 738 44 530 46 587 467 378 46 285 45 386 45 094 CAP (not including rural development) 37 352 40 035 41 992 42 680 41 576 40 667 40 364 Rural development and accompanying
measures 4 386 4 495 4 595 4 698 4 709 4 719 4 730 2. Structural operations 32 678 32 720 33 638 33 968 33 652 33 384 32 588 Structural Funds 30 019 30 005 30 849 31 129 30 922 30 654 29 863 Cohesion Fund 2 659 2 715 2 789 2 839 2 730 2 730 2 725 3. Internal policies (1) 6 031 6 272 6 558 6 796 6 915 7 034 7 165
4. External actions 4 627 4 735 4 873 4 972 4 983 4 994 5 004 5. Administration (2) 4 638 4 776 5 012 5 211 5 319 5 428 5 536
6. Reserves 906 916 676 434 434 434 434
Monetary reserve 500 500 250 0 0 0 0
Emergency aid reserve 203 208 213 217 217 217 217 Guarantee reserve 203 208 213 217 217 217 217 7. Pre-accession aid 3 174 3 240 3 328 3 386 3 386 3 386 3 386
Agriculture 529 540 555 564 564 564 564
Pre-accession structural instrument 1 058 1 080 1 109 1 129 1 129 1 129 1 129 Phare (applicant countries) 1 587 1 620 1 664 1 693 1 693 1 693 1 693
Total appropriations for commitments 93 792 97 189 100 672 102 145 100 974 100 046 99 207
Total appropriations for payments 91 322 94 730 100 078 102 767 99 553 97 659 97 075
Appropriations for payments as % of GNP
(ESA 79) 1.10 % 1.10 % 1.12 % 1.10 % 1.04 % 1.00 % 0.97 % Appropriations for payments as % of GNI
(ESA 95) 1.07 % 1.08 % 1.10 % 1.08 % 1.02 % 0.98 % 0.95 %
Available for accession
(appropriations for payments) 4 397 7 266 9 626 12 387 15 396
Agriculture 1 698 2 197 2 652 3 172 3 680
Other expenditure 2 699 5 069 6 974 9 215 11 716
Ceiling, appropriations for payments 91 322 94 730 104 475 110 033 109 179 110 046 112 471
Ceiling, payments as % of GNP (ESA 79) 1.10 % 1.10 % 1.17 % 1.18 % 1.14 % 1.12 % 1.12 % Margin for unforeseen expenditure 0.17 % 0.17 % 0.10 % 0.09 % 0.13 % 0.15 % 0.15 % Own resources ceiling 1.27 % 1.27 % 1.27 % 1.27 % 1.27 % 1.27 % 1.27 % Ceiling, payments as % of GNI (ESA 95) 1.07 % 1.08 % 1.15 % 1.16 % 1.12 % 1.10 % 1.10 % Margin for unforeseen expenditure 0.17 % 0.16 % 0.09 % 0.08 % 0.12 % 0.14 % 0.14 % Own resources ceiling 1.24 % 1.24 % 1.24 % 1.24 % 1.24 % 1.24 % 1.24 %
(1) In accordance with Article 2 of Decision No 182/1999/EC of the European Parliament and of the Council and Article 2 of Council
Decision 1999/64/Euratom (OJ L 26, 1.2.1999, pp. 1 and 34), EUR 11 510 million at current prices is available for research over the period 2000–02.
(2) The expenditure on pensions included under the ceiling for this heading is calculated net of staff contributions to the pension
The next financial framework
(2007–13) for an enlarged EU
The main focus for Agenda 2000 was on gear-ing up Europe to make enlargement happen. With this now a reality the next financial per-spective needs to be focused on meeting the new expectations of all Member States. In February 2004, the Commission presented its outline for the new financial perspective of the enlarged Union to cover the period 2007 to 2013. While this includes the ideas and proposals of the current Prodi Commission, the negotiations and final decisions will be the responsibility of the new Commission to be nominated later in 2004.
Enlargement is viewed as the biggest achieve-ment of the current Commission — so what does it see as the political priorities to meet the demands and opportunities presented by this historic event? Three main priorities have been proposed.
Sustainable development— to increase Eu-ropean citizens’ prosperity in a sustainable way by encouraging growth and solidarity by:
transforming the EU into a dynamic knowledge-based economy geared for growth by taking action to improve re-search, boost enterprise and innovation, es-tablish networks at European level and to enhance the role of education;
pursuing greater cohesion in the context of an enlarged Union to boost overall eco-nomic performance while at the same time reducing economic and social disparities across the EU;
reinforcing the competitiveness of agricul-ture, strengthening rural development, en-suring sustainable exploitation of fish re-sources and the quality of the environment through actions that support sustainable management and protection of natural re-sources.
European citizenship — to guarantee citi-zenship and freedom, security and justice in-side and outin-side the Union by:
managing the EU’s external borders and migration flows in support of the actions of Member States;
ensuring security through continued EU actions for preventing and fighting crime and terrorism;
creating an effective area of justice by pro-viding legal certainty to back up cross-border transactions;
supporting access to basic goods and services through measures as diverse as protecting EU citizens against natural disasters, reinforcing environmental safety standards, promoting information concern-ing the safety of goods and encouragconcern-ing access to health and education services;
fostering European culture and diversity by measures to support cultural coopera-tion especially concerning the Union’s youth.
The EU as a global partner— by asserting itself in the world as well as its neighbour-hood through coherent external relations tools contributing to global security and prosperity that in turn influence the well-being and secu-rity of EU citizens.
Conclusion
The general consensus is that the financial perspective has proved a useful instrument in that it:
ensures an orderly progression of finances;
provides a framework for multiannual aid programmes;
facilitates planning with certainty while al-lowing flexibility when needed;
enhances interinstitutional cooperation; and
encourages decision-makers of national governments to adopt a medium term focus.
[image:14.595.88.473.211.437.2]Negotiations on the new financial perspective between the EU institutions are expected to be protracted and difficult as has been the case for previous financial packages. But the coop-eration between the institutions that has been engendered by the financial perspective in-strument over the past years should lead to an agreed framework that will deliver concrete specific priorities that will benefit all Member States and their citizens while optimising the relationship of actions taken at national and Union levels.
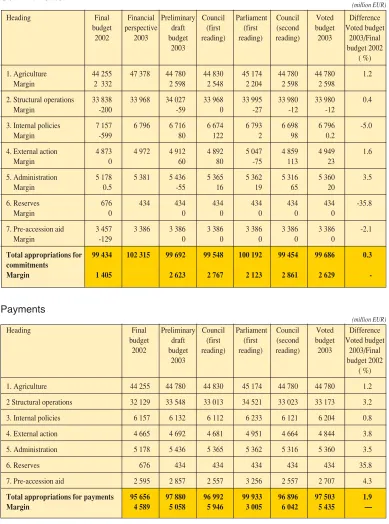
TABLE 2
Overview of the new financial framework 2007–13
(million EUR at 2004 prices)
Appropriations for commitments 2006 (1) 2007 2008 2009 2010 2011 2012 2013
1. Sustainable growth 47 582 59 675 62 795 65 800 68 235 70 660 73 715 76 785 1a. Competitiveness of growth and
employment 8 791 12 105 14 390 16 680 18 965 21 250 23 540 25 825 1b. Cohesion of growth and
employment (2) 38 791 47 570 48 405 49 120 49 270 49 410 50 175 50 960
2. Preservation and management of natural
resources 56 015 57 180 57 900 58 115 57 980 57 850 57 825 57 805 of which : Agriculture — market-related
expenditure and direct payments 43 735 43 500 43 673 43 354 43 034 42 714 42 506 42 293 3. Citizenship, freedom, security and justice 1 381 1 630 2 015 2 330 2 645 2 970 3 295 3 620 4. The EU as a global partner (3) 11 232 1 630 12 175 12 945 13 720 14 495 15 115 15 740
5. Administration (4) 3 436 1 630 3 815 3 950 4 090 4 225 4 365 4 500
Compensation 1 041
Total appropriations for commitments 120 688 121 745 138 700 143 140 146 670 150 200 154 315 158 450
Total appropriations for payments (2)(3) 114 740 124 600 136 500 127 700 126 000 132 400 138 400 143 100 Average
Appropriations for payments as a
percentage of GNI 1.09% 1.15% 1.23% 1.12% 1.08% 1.11% 1.14% 1.15% 1.14% Margin available (%) 0.15% 0.09% 0.01% 0.12% 0.16% 0.13% 0.10% 0.09% 0.10% Own resources ceiling as a
percentage of GNI 1.24% 1.24% 1.24% 1.24% 1.24% 1.24% 1.24% 1.24% 1.24%
(1) 2006 expenditure under the current financial perspective has been broken down according to the proposed new nomenclature for
reference and to facilitate comparisons.
(2) Includes expenditure for the solidarity fund (EUR 1 billion in 2004 at current prices) as from 2006. However, corresponding
pay-ments are calculated only as from 2007.
(3) The integration of the EDF in the EU budget is assumed to take effect in 2008. Commitments for 2006 and 2007 are included
only for comparison purposes. Payments on commitments before 2008 are not taken into account in the payment figures. (4) Includes administrative expenditure for institutions other than the Commission, pensions and European Schools. Commission
1. Policy strategy priorities
The annual policy strategy (APS) decision is the first stage in the annual budgetary strate-gic planning and programming cycle. It seeks to define the Commission’s policy priorities and ensure that there is the right match be-tween tasks and resources for the coming fi-nancial year. This sets the framework for preparing the preliminary draft budget and for the operational programming of the direc-torates-general and services. The cycle is completed with the adoption of the legislative and work programme, by which the Commis-sion, on the basis of the budgetary process, operational programming and the results of the interinstitutional dialogue, announces the actions it intends to take forward over the coming year.
In the APS decision of 27 February 2002, the Commission decided to retain for 2003 one central priority, the enlarged Europe, and two closely associated priorities — on the one hand, stability and security, which are an ex-pression of the new continental responsibili-ties of the enlarged Europe and, on the other, a sustainable and inclusive economy, which will continue to represent the socioeconomic base on which the enlarged Europe will be built.
2. Evolution of the 2003
budget
Initial statements
by the budgetary authority
In its conclusions of 5 March, the Council emphasised the need for the same degree of budgetary restraint as exercised by Member States. On 12 March Parliament adopted a resolution setting out its priorities in this field. It regarded enlargement and preparation of the administration for enlargement as ‘absolute
priorities’. The other political priorities in-cluded the reform of the institutions, in partic-ular the Commission, external assistance to Afghanistan and its neighbours, and the strengthening of internal security in the Euro-pean Union.
Preliminary draft budget (PDB)
The preliminary draft budget was approved by the Commission on 30 April. It totalled some EUR 99.692 billion in commitment appropria-tions (up by 1.1 % on the voted 2002 budget), leaving beneath the financial perspective ceil-ing a margin of around EUR 2.6 billion in commitments. For payments, the PDB amounted to EUR 97.880 billion (an increase of 2.3 % compared with 2002, representing 1.03 % of Community gross national income), leaving an adequate margin of EUR 5.058 bil-lion. For the third consecutive year, the pre-liminary draft was presented in accordance with both the traditional nomenclature and the activity-based budgeting approach.
Draft budget (Council’s first
reading)
The draft 2003 budget established by the Council at first reading on 19 July came to EUR 99.548 billion in appropriations for commitments and EUR 96.992 billion in ap-propriations for payments. The total amount of payment appropriations was thus equiva-lent to 1.02 % of Community GNI.
The flexibility instrument
spe-cific action for the conversion of the Spanish and Portuguese fishing fleets (EUR 27 mil-lion), the Community emergency measure for the scrapping of fishing vessels as part of the reform of the common fisheries policy (EUR 32 million) and the amount in excess of the ceiling on administrative expenditure which the institutions need to prepare for enlarge-ment (EUR 66 million). At the conciliation meeting on 25 November, the budgetary au-thority agreed to take EUR 12 million from the flexibility instrument to complete the Spanish and Portuguese fleet restructuring programme in the 2003 budget. This use is an exception to the principle according to which the flexibility instrument should not, as a rule, be used to cover the same needs two years running.
Letters of amendment
Letters of Amendment are the instrument which the Commission uses during the bud-getary procedure to adapt its preliminary draft budget to conditions that were not known when it was presented. The instrument was used four times in the budgetary procedure 2003.
On 17 July, the Commission adopted Let-ter of Amendment No 1/2003 to incorpo-rate a line in the 2003 PDB and EUR 32 million in reserve for the initial measures for scrapping vessels in support of the Commission’s proposal to reform the com-mon fisheries policy.
Letter of Amendment No 2/2003, adopted by the Commission on 18 September, pro-posed the budgetary structure needed to accommodate three new Commission ad-ministrative offices. It was also to create lines in the 2003 budget to cover utilisa-tion of the new European Solidarity Fund to provide Community disaster relief.
Letter of Amendment No 3/2003 was adopted by the Commission on 30 Octo-ber. It reduced appropriations for agricul-ture by EUR 337 million in Heading 1a. It also proposed the creation of a line for ge-netic resources for EUR 1.5 million under Heading 3, rebalanced the amounts between the line and the reserve for fish-eries agreements (with no net impact) and proposed anticipating a surplus of EUR 500 million from the agricultural budget of 2002.
Finally the Commission, by accelerated written procedure on 28 November, adopt-ed Letter of Amendment No 4/2003. It dealt with the effects of the new financial regulation on nomenclature and the bud-getary remarks for all institutions. In addi-tion, it proposed harmonising the remarks for the BA-lines for subsection B7 to clari-fy their use, especially for decentralisation and the dismantling of technical assistance offices. This letter of amendment was bud-getary neutral.
Parliament’s first reading
Parliament’s first reading on 24 October brought the draft budget to EUR 100.192 bil-lion for commitments and EUR 99.933 bilbil-lion for payments. This corresponded to increases of 0.7 % and 4.5 % respectively over the 2002 final budget. The appropriations for payments represented 1.04 % of EU GNI. Parliament had added almost EUR 3 billion in payments compared to the Council’s first reading.
Council’s second reading
The Council’s second reading of the 2003 draft budget was preceded by a conciliation meeting with Parliament to try and find a global package solution. The negotiation cen-tred on the remaining amount for the restruc-turing programme for the Spanish and Por-tuguese fisheries fleet and the use of the flexibility instrument for this purpose, financ-ing in Headfinanc-ing 4, in particular for the Global Health Fund and Afghanistan, CFSP, adminis-trative expenditure and the global increase in payment appropriations. The expenditure de-cided on by the Council in its second reading totalled EUR 99.454 billion (+ 0.02 % over 2002) in commitment appropriations and EUR 96.896 billion (+ 1.3 % over 2002) in payment appropriations. As a percentage of Member States’ GNI, this draft budget repre-sented a share of 1.01 %.
The preliminary estimate of the 2002 budget balance entered in the 2003 budget via Letter of Amendment No 3/2003 was increased to EUR 1 billion. Finally, joint declarations were agreed together with Parliament on endeav-ouring to eliminate the abnormal outstanding commitments (RAL), on the implementation profile, on the financial consequences of en-largement, on the evaluation before end-2003 of implementation and on the calculation methodology of the aid granted by the EU Solidarity Fund.
The budget voted (Parliament’s
second reading)
The general budget for 2003 was adopted on 19 December after Parliament’s second read-ing. The budget as adopted totalled EUR 99.686 billion for commitments and EUR 97.503 billion for payments. Compared with the 2002 final budget, commitment
appropria-tions remained at roughly the same level (an increase of 0.3 %). Appropriations for pay-ments rose by a modest 1.9 %, which also re-flected the consolidation efforts being made by Member States with their national budgets. This trend left a substantial margin of EUR 5.435 billion in payments and EUR 2.623 bil-lion in commitments. The payment appropria-tions in the 2003 budget amounted to 1.02 % of Member States’ gross national income, the authorised limit being 1.24 %.
3. Budgetary adjustments
Appropriations carried forward
from 2002 to 2003
As a general rule, appropriations which have not been used at the end of the financial year for which they were entered are cancelled. However, they may be carried over to the fol-lowing financial year only, by a decision taken by the institution concerned by 15 Feb-ruary.
Commitment appropriations may be carried over in two cases:
the preparatory stages of the commitment procedure have been completed by 31 De-cember and these amounts may then be committed up to 31 March of the follow-ing year; and
the basic act was adopted in the final quar-ter of the financial year and the Commis-sion has been unable to commit the appro-priations by 31 December.
TABLE 3
Overview of the various stages of the 2003 budgetary procedure
Commitments
(million EUR)
Heading Final Financial Preliminary Council Parliament Council Voted Difference budget perspective draft (first (first (second budget Voted budget
2002 2003 budget reading) reading) reading) 2003 2003/Final
2003 budget 2002
( %)
1. Agriculture 44 255 47 378 44 780 44 830 45 174 44 780 44 780 1.2 Margin 2 332 2 598 2 548 2 204 2 598 2 598
2. Structural operations 33 838 33 968 34 027 33 968 33 995 33 980 33 980 0.4
Margin -200 -59 0 -27 -12 -12
3. Internal policies 7 157 6 796 6 716 6 674 6 793 6 698 6 796 -5.0
Margin -599 80 122 2 98 0.2
4. External action 4 873 4 972 4 912 4 892 5 047 4 859 4 949 1.6
Margin 0 60 80 -75 113 23
5. Administration 5 178 5 381 5 436 5 365 5 362 5 316 5 360 3.5
Margin 0.5 -55 16 19 65 20
6. Reserves 676 434 434 434 434 434 434 -35.8
Margin 0 0 0 0 0 0
7. Pre-accession aid 3 457 3 386 3 386 3 386 3 386 3 386 3 386 -2.1
Margin -129 0 0 0 0 0
Total appropriations for 99 434 102 315 99 692 99 548 100 192 99 454 99 686 0.3
commitments
Margin 1 405 2 623 2 767 2 123 2 861 2 629
-Payments
(million EUR)
Heading Final Preliminary Council Parliament Council Voted Difference budget draft (first (first (second budget Voted budget
2002 budget reading) reading) reading) 2003 2003/Final
2003 budget 2002
( %)
1. Agriculture 44 255 44 780 44 830 45 174 44 780 44 780 1.2 2 Structural operations 32 129 33 548 33 013 34 521 33 023 33 173 3.2
3. Internal policies 6 157 6 132 6 112 6 233 6 121 6 204 0.8
4. External action 4 665 4 692 4 681 4 951 4 664 4 844 3.8 5. Administration 5 178 5 436 5 365 5 362 5 316 5 360 3.5
6. Reserves 676 434 434 434 434 434 35.8
7. Pre-accession aid 2 595 2 857 2 557 3 256 2 557 2 707 4.3
Total appropriations for payments 95 656 97 880 96 992 99 933 96 896 97 503 1.9
The Commission decided to carry forward the following appropriations:
(million EUR)
The main carryover (EUR 3 254 million) con-cerned the settlement of payments for the pro-gramming period of 1994–99 of the Structural Funds that were closed in 2002.
4. Amending budgets
Amending budget No 1/2003 adopted on 1 July. Its purpose was to cover the participa-tion of around 100 representatives from the future Member States in three plenary ses-sions of the Committee of the Regions in 2003 (EUR 70 000).
Amending budget No 2/2003 adopted on 3 September. Its purpose was to enter the sur-plus of EUR 7.4 billion from the 2002 finan-cial year.
Amending budget No 3/2003 adopted on 22 September. The purpose was threefold: to make additional funds available for the scrap-ping of fishing vessels; to create a new budget line for communication and information work on the European Union’s role in the world; and to modify the title and remarks of the
budget item for the European Inter-University Centre (increase of EUR 1.7 million).
Amending budget No 4/2003 adopted on 23 September. Its purpose was to adjust the breakdown of national contributions to the 2003 budget.
Amending budget No 5/2003 adopted on 9 October by merging two amending budget proposals. Its purpose was to mobilise the Eu-ropean Union Solidarity Fund in respect of three disasters resulting from the sinking of the Prestige off the Spanish coast, the earth-quake in the Italian regions of Molise and Apulia and the eruption of Mount Etna, and in respect of the many large-scale fires which af-fected Portugal in the summer of 2003 (EUR 104.8 million).
Amending budget No 6/2003 adopted on 4 December. It covered two elements: the re-duction of payment appropriations for the out-standing commitments of the pre-2000 pro-grammes of the Structural Funds and a technical addition of a remark to budget line B7-811 (decrease of EUR 5 billion).
Amending budget No 7/2003 adopted on 4 December. The purpose was to finance, by a frontloading operation in 2003, the staff salary adjustment in 2004, (increase of EUR 21.9 million).
The impact of the amending budgets was
an increase of EUR 127 million in com-mitment appropriations (0.13 % to the ini-tial appropriations);
a net decrease of EUR 4 978 million in payment appropriations (5.2 %).
5. Transfers
Each institution may, within its own section of the budget, make transfers from one budget line to another subject to certain conditions.
Heading Commitments Payments
1. Agriculture 84 84
2. Structural
operations 1 3 254
3. Internal
policies 22 86
4. External
action 35 32
5. Administration 3 3
The Commission is allowed to make transfers within budget lines of the same chapter. Other transfers require a decision by the budgetary authority. In 2003 the budgetary authority de-cided on the following transfers with structur-al changes for the budget:
Transfers from the initial
reserve (transfers of provisional
appropriations)
The initial reserve consisting of provisional appropriations is voted together with the
ini-tial budget. These appropriations are provi-sional in the sense that their purpose has been defined, but the budgetary authority has set conditions that have to be fulfilled before they can be released, for example adoption of the legislation, presentation of work programme or progress report, etc.
The breakdown of transfers from the initial reserve by heading was as follows:
(million EUR)
Heading Commitments Payments
Initial Transfers Current Initial Transfers Current
reserve (unused) reserve (unused)
reserve end- reserve
end-2003 2003
1. Agriculture 18 1 17 18 1 17
3. Internal policies 236 208 29 101 61 40
4. External action 35 35 0 31 18 13
5. Administration 7 2 5 7 2 5
Total 296 245 51 157 82 75
Transfers between chapters
Transfers between chapters had the following impact on the headings:
(million EUR)
Heading Commitments Payments
Transfers Transfers Impact Transfers Transfers Impact
to a from a between to a from a between
chapter chapter headings chapter chapter headings
1. Agriculture 678 -678 0 678 -678 0
2. Structural operations 0 0 0 1 635 -1 225 410 3. Internal policies 6 -6 0 134 -369 -235
4. External actions 168 -53 115 122 -219 -97
5. Administration 60 -60 0 60 -60 0
6. Reserves 0 -115 -115 0 -79 -79
7. Pre-accession aid 0 0 0 10 -10 0
The main transfer of commitment appropria-tions was EUR 115 million from the emer-gency aid reserve (B7-91) to the external ac-tion heading to cover needs arising from humanitarian crises in Iraq, southern Africa and Ethiopia.
For structural operations, the omnibus transfer proposal for 2003 included an increase of EUR 1.5 billion for Objective 1 measures under the European Regional Development Fund to cover expected additional payment needs based on Member States’ forecasts and the rapid implementation during 2003. This transfer was mostly offset by appropriations from within the heading, mainly from Com-munity initiatives (EUR 520 million) because of the slow start of these programmes and the need to set up the management structures in the countries concerned and also from the Co-hesion Fund (EUR 350 million), The balance of this increase for Objective 1 measures was met from internal policies (EUR 340 million) and external action (EUR 175.4 million)
In internal policies, transfers of commitment appropriations within the heading mainly con-cerned Research and technological develop-ment (B6), as available appropriations were identified to be used in the best conditions for the different priorities of the sixth research framework programme. These transfers will be offset in future years. The main transfer for payment appropriations was EUR 300 million from research and technological development, specifically for the completion of the fifth EC framework programme (1998 to 2002).
The budget of the European Union is financed by own resources and other revenue. In 2003, own resources amounted to EUR 83.6 billion and other revenue to EUR 9.8 billion (of which EUR 7.4 billion corresponded to the surplus carried over from the previous year).
When the Council and Parliament approve the annual budget, total revenue must equal total expenditure. The total amount needed to fi-nance the budget follows automatically from the level of total expenditure. However, since out-turns of revenue and expenditure usually differ from the budgeted estimates, a balance remains for the year. As a rule, there is a sur-plus, which reduces Member States’ own re-sources payments in the subsequent year.
Own resources
The basic rules on the system of own re-sources are laid down in a Council decision (currently 2000/597/EC, Euratom), adopted unanimously by the Council and ratified by all Member States.
Own resources can be defined as revenue ac-cruing automatically to the EU in order to fi-nance its budget without the need for any sub-sequent decision by national authorities.
The overall amount of own resources needed to finance the budget is determined by total expenditure less other revenue. The total amount of own resources cannot exceed 1.24 % of the gross national income (GNI) of the EU.
Own resources can be divided into the follow-ing categories:
traditional own resources (customs duties, agricultural duties and sugar levies);
the VAT-based resource;
the GNI-based resource (‘the additional re-source’).
Finally, a specific mechanism for correcting the budgetary imbalance of the United King-dom is also part of the own resources system.
The traditional own resources are levied on economic operators and simply passed on by the Member States to the EU budget, whereas the last two categories of own resources, in-cluding the UK correction payments, are levied directly on Member States.
Traditional own resources
(customs duties, agricultural
duties and sugar levies)
The so-called traditional own resources ac-crue directly to the EU budget. Member States collect the amounts on behalf of the EU and pass on the amounts to the Commission, after deduction of 25 % to cover their collection costs.
Agricultural duties and customs duties are levied on imports of agricultural and non-agri-cultural products from third countries, at rates based on the Common Customs Tariff. In 2003, they corresponded to 1.2 % and 11.3 % of total own resources, respectively.
Sugar levies are paid by sugar producers to fi-nance the export refunds for sugar. These levies offset expenditure of virtually the same amount. Revenue from this source amounted to 0.5 % of total own resources payments in 2003.
The own resource based on
value added tax (VAT)
national income of the Member State in ques-tion. This rule is intended to stop the less prosperous Member States having to pay out of proportion to their contributive capacity, since consumption and hence VAT tend to ac-count for a higher percentage of a ac-country’s national income at relatively lower levels of prosperity.
In 2003, the 50 % ‘capping’ was applied to five Member States (Greece, Spain, Ireland, Luxembourg and Portugal).
The maximum percentage rate of the VAT base that can be called was set at 0.75 % in 2003. However, this rate must be decreased to take account of the UK correction (see below). The actual rate of call of VAT in 2003 was 0.5083 % (rounded figure). This corre-sponded to EUR 21.3 billion or 25.4 % of total own resources.
The own resource based on
gross national income (
1)
(GNI)
The GNI-based own resource was first intro-duced in 1988 to balance budget revenue and expenditure, i.e. to finance the part of the bud-get not covered by other revenue. The same percentage rate is levied on each Member States’ GNI, which is established in accor-dance with Community rules.
The rate is fixed during the budgetary proce-dure. The amount of the GNI resource needed depends on the difference between total ex-penditure and the sum of all other revenue.
In 2003, the rate of call of the GNI-based re-source amounted to 0.5436 % (rounded fig-ure) of total EU GNI. This corresponds to EUR 51.2 billion or 61.3 % of total own re-sources.
The correction in favour of
the United Kingdom
The current UK correction mechanism was in-troduced in 1985 to correct the imbalance be-tween the United Kingdom’s share in pay-ments to the Community budget and its share in Community expenditure in the Member States. It has been modified on several occa-sions to compensate for changes in the system of financing the EU, but the basic principles remain the same.
This imbalance is calculated as the difference between the percentage share of the UK in EU expenditure paid in the Member States (‘allo-cated expenditure’) and the UK share in total VAT- and GNI-based own resources pay-ments. The difference in percentage points is multiplied by the total amount of EU expendi-ture allocated to the Member States. The UK is reimbursed 66 % of this budgetary imbal-ance.
The cost of the correction is borne by the other Member States (14 Member States in 2003). The distribution of the financing is first calculated on the basis of each country’s share in total EU GNI. The financing share of Ger-many, the Netherlands, Austria and Sweden is, however, restricted to one quarter of its normal value. This cost is redistributed across the remaining Member States (10 remaining Member States in 2003).
The total amount of the UK correction paid in 2003 amounted to EUR 5.2 billion.
Other revenue
The sources of finance for the general budget not coming from own resources include tax and other deductions from staff remunera-tions, bank interest, contributions from non-member countries to certain Community pro-grammes (e.g. in the research area), repayments of unused Community financial
(1) As from 2002 the concept of GNI has replaced that of gross
assistance, interest on late payments as well as the balance from the previous year. However, this last item is mainly derived from the dif-ference between the out-turn of own resources payments and expenditure in the previous year.
[image:24.595.89.474.302.589.2]In 2003 other revenue amounted to EUR 9.8 billion, of which EUR 7.4 billion correspond-ed to the surplus carricorrespond-ed over from 2002.
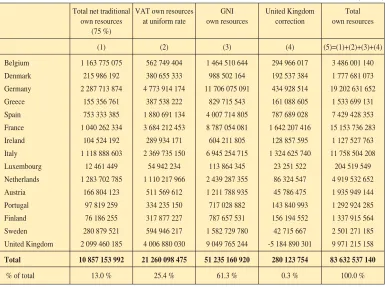
TABLE 4
Own resources payments by Member State in 2003
(in EUR)
Total net traditional VAT own resources GNI United Kingdom Total own resources at uniform rate own resources correction own resources
(75 %)
(1) (2) (3) (4) (5)=(1)+(2)+(3)+(4)
Belgium 1 163 775 075 562 749 404 1 464 510 644 294 966 017 3 486 001 140 Denmark 215 986 192 380 655 333 988 502 164 192 537 384 1 777 681 073 Germany 2 287 713 874 4 773 914 174 11 706 075 091 434 928 514 19 202 631 652 Greece 155 356 761 387 538 222 829 715 543 161 088 605 1 533 699 131 Spain 753 333 385 1 880 691 134 4 007 714 805 787 689 028 7 429 428 353 France 1 040 262 334 3 684 212 453 8 787 054 081 1 642 207 416 15 153 736 283 Ireland 104 524 192 289 934 171 604 211 805 128 857 595 1 127 527 763 Italy 1 118 888 603 2 369 735 150 6 945 254 715 1 324 625 740 11 758 504 208 Luxembourg 12 461 449 54 942 234 113 864 345 23 251 522 204 519 549 Netherlands 1 283 702 785 1 110 217 966 2 439 287 355 86 324 547 4 919 532 652 Austria 166 804 123 511 569 612 1 211 788 935 45 786 475 1 935 949 144 Portugal 97 819 259 334 235 150 717 028 882 143 840 993 1 292 924 285 Finland 76 186 255 317 877 227 787 657 531 156 194 552 1 337 915 564 Sweden 280 879 521 594 946 217 1 582 729 780 42 715 667 2 501 271 185 United Kingdom 2 099 460 185 4 006 880 030 9 049 765 244 -5 184 890 301 9 971 215 158
Total 10 857 153 992 21 260 098 475 51 235 160 920 280 123 754 83 632 537 140
% of total 13.0 % 25.4 % 61.3 % 0.3 % 100.0 %
Total amount of own resources in % of total EU GNI: 0.89 %
0 5
–5 10 15 20 25 30 35 40 45 50 55 60 65 70 75 80 85 90 95 100
[image:25.595.245.516.172.445.2]1993 1994 1995 1996 1997 1998 1999 2000 2001 2002 2003
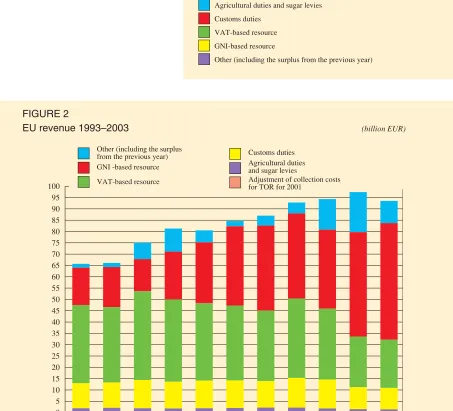
FIGURE 2
EU revenue 1993–2003 (billion EUR)
[image:25.595.61.514.359.770.2]Other (including the surplus from the previous year) GNI -based resource VAT-based resource
FIGURE 1
EU revenue 2003
Agricultural duties and sugar levies Customs duties
VAT-based resource GNI-based resource
Other (including the surplus from the previous year) 22.7 %
10.1 % 1.5 %
10.5 %
55.1 %
Customs duties Agricultural duties and sugar levies
0 1 2 3 4 5 6 7 8 9 10 11 12 13 14 15 16 17 18 19 20
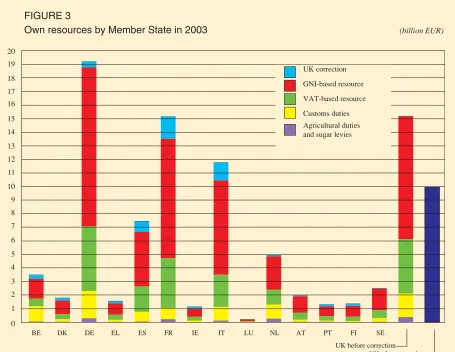
FIGURE 3
Own resources by Member State in 2003 (billion EUR)
UK correction GNI-based resource VAT-based resource Customs duties Agricultural duties and sugar levies
BE DK DE EL ES FR IE IT LU NL AT PT FI SE UK before correction
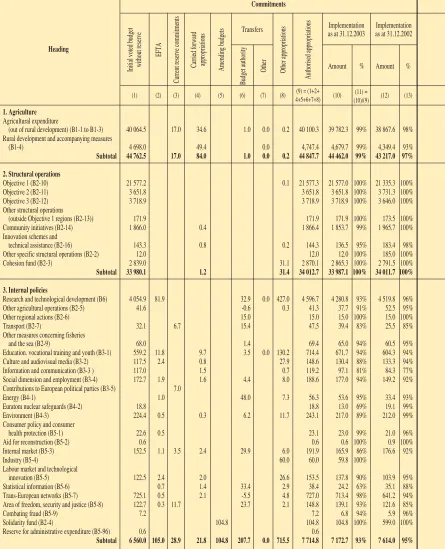
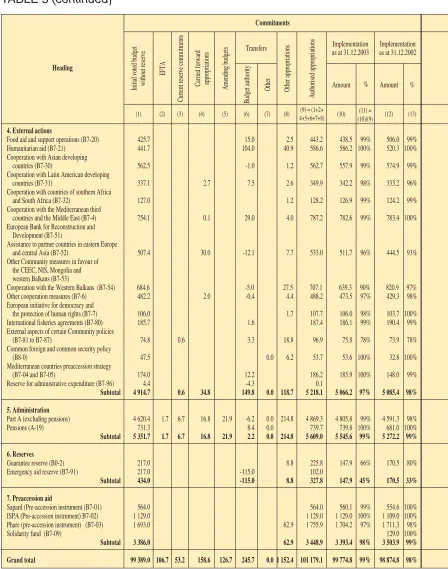
TABLE 5
Implementation of commitments and payments as at 31 December 2003
Provisional data
Heading
Commitments
(1) (9) = (1+2+ 4+5+6+7+8)
(2) (3) (4) (5) (6) (7) (8) (10) (11) =
(10)/(9) (12) (13)
Initial voted budget without reserve
EFTA
Current reserve commitments
Carried forward appropriations
Amending budgets
Budget authority
Other Other appropriations
Authorised appropriations
Amount % Transfers Implementation as at 31.12.2003
Amount % Implementation as at 31.12.2002
1. Agriculture
Agricultural expenditure
(out of rural development) (B1-1 to B1-3) 40 064.5 17.0 34.6 1.0 0.0 0.2 40 100.3 39 782.3 99% 38 867.6 98% Rural development and accompanying measures
(B1-4) 4 698.0 49.4 0.0 4,747.4 4,679.7 99% 4,349.4 93%
Subtotal 44 762.5 17.0 84.0 1.0 0.0 0.2 44 847.7 44 462.0 99% 43 217.0 97%
2. Structural operations
Objective 1 (B2-10) 21 577.2 0.1 21 577.3 21 577.0 100% 21 335.3 100% Objective 2 (B2-11) 3 651.8 3 651.8 3 651.8 100% 3 731.3 100% Objective 3 (B2-12) 3 718.9 3 718.9 3 718.9 100% 3 646.0 100% Other structural operations
(outside Objective 1 regions (B2-13)) 171.9 171.9 171.9 100% 173.5 100% Community initiatives (B2-14) 1 866.0 0.4 1 866.4 1 853.7 99% 1 965.7 100% Innovation schemes and
technical assistance (B2-16) 143.3 0.8 0.2 144.3 136.5 95% 183.4 98% Other specific structural operations (B2-2) 12.0 12.0 12.0 100% 185.0 100% Cohesion fund (B2-3) 2 839.0 31.1 2 870.1 2 865.3 100% 2 791.5 100%
Subtotal 33 980.1 1.2 31.4 34 012.7 33 987.1 100% 34 011.7 100%
3. Internal policies
Research and technological development (B6) 4 054.9 81.9 32.9 0.0 427.0 4 596.7 4 280.8 93% 4 519.8 96% Other agricultural operations (B2-5) 41.6 -0.6 0.3 41.3 37.7 91% 52.5 95% Other regional actions (B2-6) 15.0 15.0 15.0 100% 15.0 100% Transport (B2-7) 32.1 6.7 15.4 47.5 39.4 83% 25.5 85% Other measures concerning fisheries
and the sea (B2-9) 68.0 1.4 69.4 65.0 94% 60.5 95% Education. vocational training and youth (B3-1) 559.2 11.8 9.7 3.5 0.0 130.2 714.4 671.7 94% 604.3 94% Culture and audiovisual media (B3-2) 117.5 2.4 0.8 27.9 148.6 130.4 88% 133.3 94% Information and communication (B3-3 ) 117.0 1.5 0.7 119.2 97.1 81% 84.3 77% Social dimension and employment (B3-4) 172.7 1.9 1.6 4.4 8.0 188.6 177.0 94% 149.2 92% Contributions to European political parties (B3-5) 7.0
Energy (B4-1) 1.0 48.0 7.3 56.3 53.6 95% 33.4 93% Euratom nuclear safeguards (B4-2) 18.8 18.8 13.0 69% 19.1 99% Environment (B4-3) 224.4 0.5 0.3 6.2 11.7 243.1 217.0 89% 212.0 99% Consumer policy and consumer
health protection (B5-1) 22.6 0.5 23.1 23.0 99% 21.0 96% Aid for reconstruction (B5-2) 0.6 0.6 0.6 100% 0.9 100% Internal market (B5-3) 152.5 1.1 3.5 2.4 29.9 6.0 191.9 165.9 86% 176.6 92%
Industry (B5-4) 60.0 60.0 59.8 100%
Labour market and technological
innovation (B5-5) 122.5 2.4 2.0 26.6 153.5 137.8 90% 103.9 95% Statistical information (B5-6) 0.7 1.4 33.4 2.9 38.4 24.2 63% 35.1 88% Trans-European networks (B5-7) 725.1 0.5 2.1 -5.5 4.8 727.0 713.4 98% 641.2 94% Area of freedom, security and justice (B5-8) 122.7 0.3 11.7 23.7 2.1 148.8 139.1 93% 121.6 85%
Combating fraud (B5-9) 7.2 7.2 6.8 94% 5.9 96%
Solidarity fund (B2-4) 104.8 104.8 104.8 100% 599.0 100% Reserve for administrative expenditure (B5-96) 0.6 0.6
Payments
(14) (15) (16) (17) (18) (19) (20) (21) (22) = (14+15+17 +18+19+20+21) (23)
(24) =
23/22 (25) (26) (27)
(28) = 27+10
-23+31 (29) (30) (31)
Initial voted budget without reserve
EFTA
Current reserve
payments
Carried forward appropriations
Amending budgets Other appropriations Decommitments on RAL
as at 01.01.2003 (
1)
Authorised appropriations
Amount % Implementation as at 31.12.2003
Budget authority Other
Transfers
Amount % as at 01.01.2003
as at 31.12.2003 Implementation
as at 31.12.2002 Stock of RAL
On RAL prior to 2003
On 2003 commit-ments Payments
(million EUR)
40 064.5 17.0 265.9 1.0 0.0 0.2 40 331.6 39 699.5 98% 39 171.2 97% 231.2 311.5 209.9 39 489.6 -2.5
4,698.0 49.4 0.0 4 747.4 4 679.7 99% 4 349.4 93% 4 679.7
44 762.5 17.0 315.3 1.0 0.0 0.2 45 079.0 44 379.2 98% 43 520.6 97% 231.2 311.5 209.9 44 169.3 -2.5
19 366.6 1 978.2 -2 744.5 1 435.4 0.1 20 035.8 18 986.0 95% 15 369.1 82% 36 711.8 38 165.0 17 479.5 1 506.5 -1 137.81 4 405.6 217.2 -622.7 -50.0 3 950.1 3 587.0 91% 1 641.2 48% 10 063.0 9 443.2 3 489.7 97.3 -684.6 3 695.8 153.2 -421.9 3 427.1 2 548.3 74% 2 404.4 72% 6 992.4 7 697.9 2 490.6 57.7 -465.1
506.1 30.7 -243.4 293.4 175.8 60% 155.0 41% 983.3 858.1 175.6 0.2 -121.3 2 280.2 874.8 -949.3 -520.0 1 685.7 801.0 48% 556.5 25% 5 256.9 5 877.8 785.4 15.6 -431.8
180.0 -18.3 -0.2 0.2 161.7 145.3 90% 185.8 76% 365.2 314.6 101.8 43.5 -41.8
89.0 89.0 89.0 100% 39.0 100% 146.0 69.0 89.0
2 650.0 -454.8 2 195.2 2 195.1 100% 3 148.0 100% 6 212.4 6 847.8 1 990.9 204.2 -34.8
33 173.3 3 254.1 -5 000.1 410.4 0.3 31 838.0 28 527.5 90% 23 499.0 74% 66 731.0 69 273.4 26 602.5 1 925.0 -2 917.2
3 649.9 63.3 -368.8 0.0 814.0 4 158.4 3 279.5 79% 3 667.2 81% 7 520.8 8 311.7 2 183.5 1 096.0 -210.4 64.9 0.5 0.3 65.2 44.7 69% 62.6 88% 94.5 62.2 31.6 13.1 -25.3
3.0 12.2 15.2 3.2 21% 15.0 100% 3.4 15.0 3.2 -0.2
27.4 8.5 5.5 0.9 33.8 27.1 80% 16.1 58% 39.7 48.6 18.3 8.8 -3.3
62.0 9.1 71.1 34.4 48% 39.5 68% 124.5 136.6 17.3 17.1 -18.5 514.3 10.8 1.9 0.0 181.4 708.3 607.6 86% 592.4 84% 485.3 532.2 146.7 460.9 -17.1 102.9 2.5 14.0 0.0 44.6 164.0 123.2 75% 118.4 77% 165.2 169.7 70.3 52.9 -2.6 108.1 0.0 0.7 108.8 75.8 70% 87.2 80% 77.2 84.2 36.9 38.9 -14.25 154.2 1.5 3.5 0.3 4.8 7.8 168.6 137.1 81% 132.2 88% 157.6 179.7 68.1 69.0 -17.8
7.0
32.5 0.6 8.8 0.2 7.1 40.4 31.2 77% 29.1 71% 74.7 93.1 29.7 1.5 -4.0
18.7 0.1 18.8 10.8 57% 16.5 93% 12.9 14.7 5.8 5.0 -0.4
199.8 0.5 7.5 17.5 225.3 169.9 75% 151.9 93% 324.5 351.5 87.4 82.5 -20.1
19.9 0.4 20.3 16.4 81% 19.3 94% 23.5 29.0 12.4 4.0 -1.0
0.6 0.6 0.6 100% 0.9 100% 0.6
165.7 1.0 0.6 11.3 6.7 184.7 142.4 77% 141.1 79% 177.5 185.9 84.1 58.3 -15.0 62.0 62.0 25.1 40% 62.0 62.4 25.1 -34.3
147.9 1.3 0.7 26.4 176.3 121.3 69% 108.1 70% 372.6 319.1 93.1 28.2 -70.0 21.6 0.7 10.1 4.0 36.4 29.5 81% 32.3 84% 44.9 37.6 24.0 5.5 -2.0 673.2 0.5 7.0 1.7 4.8 687.2 631.4 92% 656.3 92% 1 308.2 1 346.2 422.1 209.3 -44.0 129.4 0.3 11.0 12.2 15.4 2.1 159.4 108.2 68% 77.0 51% 132.3 159.7 43.5 64.7 -3.4
6.5 6.5 4.0 62% 4.6 93% 3.5 5.9 1.8 2.2 -0.4
104.8 104.8 48.5 46% 599.0 100% 56.3 48.5
Heading
Commitments
(1) (9) = (1+2+ 4+5+6+7+8)
(2) (3) (4) (5) (6) (7) (8) (10) (11) = (10)/(9)
(12) (13)
Initial voted budget without reserve
EFTA
Current reserve commitments
Carried forward appropriations
Amending budgets
Budget authority
Other Other appropriations
Authorised appropriations
Amount % Transfers Implementation as at 31.12.2003
Amount % Implementation as at 31.12.2002
4. External actions
Food aid and support operations (B7-20) 425.7 15.0 2.5 443.2 438.5 99% 506.0 99% Humanitarian aid (B7-21) 441.7 104.0 40.9 586.6 586.2 100% 520.3 100% Cooperation with Asian developing
countries (B7-30) 562.5 -1.0 1.2 562.7 557.9 99% 574.9 99% Cooperation with Latin American developing
countries (B7-31) 337.1 2.7 7.5 2.6 349.9 342.2 98% 333.2 96% Cooperation with countries of southern Africa
and South Africa (B7-32) 127.0 1.2 128.2 126.9 99% 124.2 99% Cooperation with the Mediterranean third
countries and the Middle East (B7-4) 754.1 0.1 29.0 4.0 787.2 782.6 99% 783.4 100% European Bank for Reconstruction and
Development (B7-51)
Assistance to partner countries in eastern Europe
and central Asia (B7-52) 507.4 30.0 -12.1 7.7 533.0 511.7 96% 444.5 93% Other Community measures in favour of
the CEEC, NIS, Mongolia and western Balkans (B7-53)
Cooperation with the Western Balkans (B7-54) 684.6 -5.0 27.5 707.1 639.3 90% 820.9 97% Other cooperation measures (B7-6) 482.2 2.0 -0.4 4.4 488.2 473.5 97% 429.3 98% European initiative for democracy and
the protection of human rights (B7-7) 106.0 1.7 107.7 106.0 98% 103.7 100% International fisheries agreements (B7-80) 185.7 1.6 187.4 186.1 99% 190.4 99% External aspects of certain Community policies
(B7-81 to B7-87) 74.8 0.6 3.3 18.8 96.9 75.8 78% 73.9 78% Common foreign and common security policy
(B8-0) 47.5 0.0 6.2 53.7 53.6 100% 32.8 100%
Mediterranean countries preaccession strategy
(B7-04 and B7-05) 174.0 12.2 186.2 185.9 100% 148.0 99% Reserve for administrative expenditure (B7-96) 4.4 -4.3 0.1
Subtotal 4 914.7 0.6 34.8 149.8 0.0 118.7 5 218.1 5 066.2 97% 5 085.4 98%
5. Administration
Part A (excluding pensions) 4 620.4 1.7 6.7 16.8 21.9 -6.2 0.0 214.8 4 869.3 4 805.8 99% 4 591.3 98% Pensions (A-19) 731.3 8.4 0.0 739.7 739.8 100% 681.0 100%
Subtotal 5 351.7 1.7 6.7 16.8 21.9 2.2 0.0 214.8 5 609.0 5 545.6 99% 5 272.2 99%
6. Reserves
Guarantee reserve (B0-2) 217.0 8.8 225.8 147.9 66% 170.5 80% Emergency aid reserve (B7-91) 217.0 -115.0 102.0
Subtotal 434.0 -115.0 8.8 327.8 147.9 45% 170.5 33%
7. Preaccession aid
Sapard (Pre-accession instrument (B7-01) 564.0 564.0 560.1 99% 554.6 100% ISPA (Pre-accession instrument) B7-02) 1 129.0 1 129.0 1 129.0 100% 1 109.0 100% Phare (pre-accession instrument) (B7-03) 1 693.0 62.9 1 755.9 1 704.2 97% 1 711.3 98%
Solidarity fund (B7-09) 129.0 100%
Subtotal 3 386.0 62.9 3 448.9 3 393.4 98% 3 503.9 99%
Grand total 99 389.0 106.7 53.2 158.6 126.7 245.7 0.0 1 152.4 101 179.1 99 774.8 99% 98 874.8 98%
[image:29.595.129.577.154.723.2]Payments
(14) (15) (16) (17) (18) (19) (20) (21) (22) = (14+15+17 +18+19+20+21) (23)
(24) =
23/22 (25) (26) (27)
(28) = 27+10
-23+31 (29) (30) (31)
Initial voted budget without reserve
EFTA
Current reserve
payments
Carried forward appropriations
Amending budgets Other appropriations Decommitments on RAL
as at 01.01.2003 (
1)
Authorised appropriations
Amount % Implementation as at 31.12.2003
Budget authority Other
Transfers
Amount % as at 01.01.2003
as at 31.12.2003 Implementation
as at 31.12.2002 Stock of RAL
On RAL prior to 2003
On 2003 commit-ments Payments
446.9 2.7 449.6 443.0 99% 416.3 99% 1 036.4 990.7 363.8 79.2 -41.2 441.7 79.0 41.0 561.7 516.4 92% 474.3 87% 361.4 394.0 207.8 308.6 -37.2
482.7 1.2 483.9 469.4 97% 454.3 97% 2 047.8 1 976.1 353.4 116.0 -160.2
304.3 2.6 306.9 290.3 95% 181.8 78% 1 393.7 1 328.6 258.4 31.9 -117.0
152.7 -23.9 1.2 130.0 118.0 91% 119.3 88% 450.1 440.9 85.0 33.0 -18.1
720.7 0.1 39.2 4.0 764.0 748.0 98% 843.4 97% 3 581.3 3 484.7 480.4 267.7 -131.2
8.4 8.4 8.4 100% 8.4 100% 35.4 27.0 8.4
515.1 13.0 -72.2 7.7 463.6 403.2 87% 395.2 84% 1 456.2 1 501.9 344.3 58.9 -62.8
0.1 99%
775.0 10.0 -39.9 0.0 27.5 772.6 506.8 66% 749.2 84% 955.9 1 050.8 331.9 174.9 -37.6 464.9 9.4 8.5 -54.1 4.7 424.0 360.0 85% 387.3 84% 802.9 896.2 261.1 98.9 -20.2
107.5 1.7 109.2 99.4 91% 93.8 90% 234.7 235.4 75.6 23.8 -5.9 191.2 2.5 2.4 193.6 187.8 97% 186.2 95% 20.6 17.9 5.4 182.4 -1.0
87.5 1.1 -7.1 18.9 99.3 45.9 46% 64.6 66% 198.6 210.2 30.0 15.9 -18.3
50.0 -5.8 6.2 50.4 31.0 62% 30.9 86% 27.5 42.9 9.0 22.0 -7.2
59.7 3.9 63.6 57.7 91% 18.9 65% 160.6 288.8 50.0 7.7
5.2 -0.2 5.0
4 813.5 13.0 31.6 -78.7 0.0 119.4 4 885.8 4 285.6 88% 4 423.8 89% 12 763.1 12 885.8 2 864.7 1 420.9 -657.9
4 620.4 1.7 6.7 470.2 21.9 -6.2 0.0 233.1 5 341.0 4 565.9 85% 4 532.2 88% 473.3 701.9 377.2 4 188.7 -11.3
731.3 8.4 0.0 739.7 739.3 100% 679.3 100% 0.1 739.3
5 351.7 1.7 6.7 470.2 21.9 2.2 0.0 233.1 6 080.7 5 305.2 87% 5 211.5 90% 473.3 702.0 377.2 4 928.0 -11.3
217.0 8.8 225.8 147.9 66% 170.5 80% 147.9
217.0 -79.0 138.0
434.0 -79.0 8.8 363.8 147.9 41% 170.5 26% 147.9
442.9 -10.0 432.9 263.5 61% 123.9 33% 1 468.8 1 765.4 263.4 0.1 717.5 717.5 429.0 60% 398.4 79% 2 642.3 3 342.1 402.0 27.0 -0.2 1 547.0 10.0 91.1 1 648.1 1 547.4 94% 1 101.2 69% 4 305.4 4 417.1 1 465.4 82.0 -45.1
129.0 100%
2 707.4 91.1 2 798.5 2 239.9 80% 1 752.5 67% 8 416.5 9 524.7 2 130.8 109.1 -45.3
1. Introduction
For the budget year 2003, EUR 99.8 billion was committed from total available appropria-tions of EUR 101.2 billion, an implementation rate of 99 %, slightly better than the outcome for 2002. Payments amounted to EUR 90.6 billion from total available appropriations of EUR 98.3 billion, an implementation rate of
92 % compared with 86 % in 2002. About EUR 5.4 billion more payments were made than last year, relating mostly to Structural Funds. Of the appropriations not used in 2003, the Commission decided to carry for-ward to 2004 EUR 155 million for commit-ments and EUR 348 million for paycommit-ments.
The implementation rates by heading were as follows:
Heading Implementation Implementation of commitment appropriations (%) of payment appropriations (%)
2003 2002 2003 2002
1. Agriculture 99 97 98 97
2. Structural operations 100 100 90 74
3. Internal policies 93 95 79 83
4. External action 97 98 88 89
5. Administration 99 99 87 90
6. Reserves 45 33 41 26
7. Pre-accession aid 98 99 80 67
Total 99 98 92 86
2. Agriculture (Heading 1)
(million EUR)
Initial Initial Carried Amending Budgetary Other Total Imple- % budget reserve forward budget authority appro- available mentation
(AB) transfers priations appro-(less reserve) priations
Commitments 44 763 18 84 0 0 0.2 44 848 44 462 99
Payments 44 763 18 315 0 0 0.2 45 079 44 379 98
Agricultural expenditure for the year was EUR 44.4 billion, or 98 % of total available appropriations, compared with 97 % in 2002.
For common agriculture policy-related expen-diture, underutilisation mainly concerned:
the beef and veal sector (EUR 417 million), primarily due to lower payments for export refunds because of the decrease in the ex-ported quantities of beef and the lower pre-mium payments due to the smaller number of animals sent for compulsory slaughter;
the sugar sector (EUR 205 million) mainly due to the volume of exported sugar that was less than anticipated in the budget;
the wine sector (EUR 168 million) mainly because the crisis distillation scheme was not implemented in 2003.
Commitments
The commitment appropriations for this head-ing were implemented in full.
Payments
Payment appropriations in the 2003 budget for the pre-2000 programmes of the Structural Funds were reduced by EUR 5 billion follow-ing the approval of an amendfollow-ing budget (AB). This amount was based on the estimated needs and decommitments in 2003 relating to the pre-2000 programmes, as the Member States’ payment claims were considerably lower than the outstanding commitments (RAL).
Total payments for the heading amounted to EUR 28.5 billion, or 90 % of available appro-priations, an underutilisation of around EUR
3.3 billion. For the Structural Funds in 2003, the unused appropriations mainly concerned Objective 1 (EUR 1 billion) and Objective 3 (EUR 800 million) programmes, as well as Community initiatives (EUR 880 million) be-cause payment requests from the Member States were lower than initially envisaged. The unused appropriations in 2003 mainly re-lated to the earlier programmes 1994–99, where payments amounted to EUR 3.5 billion of the EUR 5.9 billion available, whereas for the new Structural Fund programmes 2000–06, payments of EUR 22.7 billion were made, an implementation rate of 96 %, com-pared with 91 % in 2002.
After a steep increase of outstanding commit-ments (RAL) in previous years, the situation in the Structural Funds almost stabilised in 2003, with an increase of around 3 %, from EUR 60.5 billion at end-2002 to EUR 62.4 billion at end-2003.
3. Structural operations (Heading 2)
(million EUR)
Initial Initial Carried Amending Impact of Other Total Imple- % budget reserve forward budget budgetary appro- available mentation
(AB) authority priations appro-transfers priations (less reserve)
Commitments 33 980 0 33 0 34 013 33 987 100
Payments 33 173 0 3 254 -5 000 411 31 838 28 528 90
4. Internal policies (Heading 3)
(million EUR)
Initial Initial Carried Amending Impact of Other Total Imple- % budget reserve forward budget budgetary appro- available mentation + EFTA (AB) authority priations
appro-receipts transfers priations (less reserve)
Commitments 6 560 236 22 105 0 821 7 715 7 173 93
Commitments
Commitments made amounted to EUR 7.2 billion, or 93 %. The EUR 550 million not used was spread across the heading, with EUR 400 million concerning ‘other appropri-ations’ mainly for research and technological development (B6). These appropriations are, as a rule, carried over to the next financial year. EUR 105 million was transferred from the EU Solidarity Fund to cover emergency aid following natural disasters in Italy, Spain and Portugal.
Payments
Payments made amounted to EUR 5.6 billion, an implementation rate of 78 % as against 83 % in 2002. Excluding ‘other appropria-tions’, which, as a rule, are carried over to the
next financial year, the unused appropriations for the heading were in the region of EUR 700 million, dispersed across the heading but mainly concerning:
EUR 200 million for research and develop-ment (B6), mostly related to completion of programmes prior to 1999 (B6-51) and the fifth framework programme (B6-52);
EUR 56 million for the EU Solidarity Fund (B2-4), which appropriations were to be carried over to 2004 to cover payments for documents signed in December 2003;
EUR 50 million (excluding current re-serve) for area for freedom, security and justice (B5-8), mainly EUR 18 million for the European Refugee Fund (B5-810), of which EUR 10 million was to be carried over to 2004.
5. External action (Heading 4)
(million EUR)
Initial Initial Carried Amending Impact of Other Total Imple- % budget reserve forward budget budgetary appro- available mentation
(AB) authority priations appro-transfers priations (less reserve)
Commitments 4 915 35 35 0 115 119 5 218 5 066 97
Payments 4 814 31 32 0 -90 119 4 886 4 286 88
Commitments
Under this heading EUR 5.1 billion was com-mitted, an implementation rate of 97 %, simi-lar to last year. Unused appropriations mainly concern EUR 50 million for macrofinancial assistance for cooperation with the Balkan countries (B7-54).
Payments
Payments made in 2003 totalled EUR 4.3 bil-lion, an implementation rate of 88 %. Unused