Int. J. Electrochem. Sci., 7 (2012) 10266 - 10281
International Journal of
ELECTROCHEMICAL
SCIENCE
www.electrochemsci.org
Modified Screen Printed and Carbon Paste Ion Selective
Electrodes for Potentiometric Determination of Naphazoline
Hydrochloride in Pure and Pharmaceutical Preparations
F.A. Nour El-Dien, Gehad G. Mohamed*, Eman Y.Z. Frag, Marwa El-Badry Mohamed
Chemistry Department, Faculty of Science, Cairo University, Gamaa Str., 12613, Giza, Egypt
*
E-mail: [email protected]
Received: 8 August 2012 / Accepted: 14 September 2012 / Published: 1 October 2012
In this study, a comparison between modified screen printed (SPE) and carbon paste (CPE) electrodes is described for determination of naphazoline hydrochloride in pure and pharmaceutical formulations. The performance characteristics of the electrodes were evaluated in terms of composition, life span, pH, and temperature. The electrodes show Nernstian slope values of 55.4±2.2 and 59.6±1.3 mV decade-1 at 25 oC, over the concentration ranges of 5.0x10⁻⁷ – 3.5x10⁻² and 3.0x10⁻⁷ – 2.5x10⁻² mol L-1 with a limit of detection of 2.512x10⁻⁷ and 3.162x10⁻⁷ mol L-1 for modified SPE and CPE, respectively. The potentiometric response of the electrodes is independent of the pH of the solution within the pH range of 2.5-8.5 and 2.7-8.5 for modified SPE and CPE, respectively. The electrodes showed good selectivity for naphazoline hydrochloride (NPZ.HCl) with respect to some inorganic cations, sugars and glycine. The electrodes exhibited relatively long operational lifetime of 47 and 32 days for modified SPE and CPE sensors, respectively. The developed modified sensors have been used successfully for the determination of naphazoline hydrochloride in pharmaceutical preparation using standard addition, potentiometric titration and calibration methods. The direct potentiometric determination of naphazoline hydrochloride using the prepared sensors gave recoveries 98% and 97.4% using modified SPE and CPE, respectively. The method avoids any interference of coexistent NPZ.HCl in the compounding drug. The obtained results were in a good agreement with those obtained using the official method. The results obtained were satisfactory with excellent percentage recovery comparable and sometimes better than those obtained by other routine methods for the assay.
1. INTRODUCTION
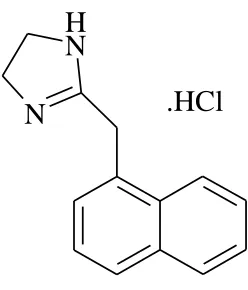
Naphazoline hydrochloride (NPZ.HCl) (Fig. 1) is the common name for 2-(1-naphthylmethyl)-2-imidazoline hydrochloride of molecular weight 246.74g mol-1 and molecular formula C14H14N2HCl [1]. It is a sympathomimetic agent with marked alpha adrenergic activity. It acts
on alpha receptors in the arterioles of the conjunctiva to produce constriction, resulting in decreased congestion. It is an active ingredient in several over the counter formulations including Clear Eyes and Naphcon eye drops [2]. Several analytical procedures have been described for the determination of NPZ in both pure and pharmaceutical samples including micellar electrokinetic chromatography [3,4], high-performance liquid chromatographic (HPLC) [5], spectrophotometric [6-11] and potentiometric methods [12, 13]. Most of these methods use sophisticated instruments, time consuming or needs expensive reagents.
N
N
H
[image:2.596.236.360.293.438.2].HCl
Figure 1. Structure of naphazoline hydrochloride.
Ion selective electrodes (ISE) are one of the most frequently used potentiometric sensors during laboratory analysis as well as in industry, process control, physiological measurements, and environmental monitoring [14]. The principle of ion-selective electrodes operation is quite well investigated and understood. Carbon paste electrode (CPE) is an ion selective electrode that commonly used in electroanalysis due to its low ohmic resistance, fast response time, decreased residual current, low cost, chemical inertness and ease of fabrication. The screen-printing technology is well established for the mass production of disposable electrochemical sensors. Screen printed electrode has the advantage over carbon paste electrode of being disposable devices that can be work with microvolumes of sample. It is an ideal tool for quality control or research purposes and also for teaching electrochemistry [15].
2. EXPERIMENTAL
2.1. Reagents
All the reagents used were of the analytical grade quality and double distilled water was used throughout the experiments. NPZ.HCl provided by Misr Company for Pharmaceutical Industry and its Pharmaceutical preparation Neozoline (Eye/Nasal drops) was produced by Amoun Pharmaceutical Company, El-Obour City, Cairo, Egypt (each 100 mL contains 50 mg naphazoline hydrochloride). Relative high molecular weight (PVC) and graphite powder (synthetic 1–2 mm) were supplied from Aldrich. Tricresylphosphate (TCP) was purchased from Alfa-Aesar.
Ion pairing agents such as sodium tetraphenylborate (NaTPB) and ammonium reineckate (RN) [NH4(Cr(NH3)2(SCN)4).H2O] were supplied from Fluka. Phosphotungstic acid (PTA); H3[PW12O40]
and phosphomolybdic acid (PMA); H3[PMo12O40], were purchased from BDH. Silicotungstic acid
STA, H4SiW12O40, was purchased from Sigma.
2.2. Apparatus
Laboratory potential measurements were performed using HANNA 211 pH meter. Silver-silver chloride double - junction reference electrode (Metrohm 6.0222.100) in conjugation with different drug ion selective electrodes was used. pH measurements were done using Jenway 3505 pH meter. Digital multimeter connected to a portable PC and Brand digital burette was used for the measurement of the drug under investigation.
2.3. Drug solutions
Stock drug solution (10-1 mol L-1) was prepared by dissolving the appropriate amount of NPZ.HCl in double distilled water. Other solutions (3.0x10⁻²-10-7) were prepared by serial dilution from the stock solution.
2.4 Procedures
2.41. Preparation of the ion exchanger
2.4.2 Preparation of the working electrodes
2.4.2.1. Screen-printed electrodes
In the preparation of the modified SPE sensors, a polyvinyl chloride flexible sheet (0.2mm) was used as a substrate which was not affected by the curing temperature or the ink solvent and easily cut by scissors. The working electrodes were prepared using 6-30 mg IP, TCP as plasticizer, PVC (8% w/w) and carbon powder (500 mg). They were printed using homemade carbon ink and cured at 50 oC for 30 min. Fabricated electrodes were stored at 4 oC and can used for measurements directly.
2.4.2.2. Carbon paste electrodes
Carbon paste electrodes were prepared by mixing different amounts (3–20 mg) of IPs, carbon powder (250 mg) and TCP plasticizer (100 L). Then this mixture was thoroughly mixed in the mortar until homogenization occurs. The resulting paste was then packed firmly into the hole of the electrode body. The surface of the resulting carbon paste electrode was polished using a filter paper to obtain new working surface and rinsed carefully with double distilled water.
2.5Effect of pH and temperature
The effect of the pH of the test solution on the response of the electrodes was studied at fixed concentration and temperature values. The variation of the potential with the pH of the test solution (1x10⁻² and 1x10⁻⁴ mol L-1) was recorded over the pH range of 2.0-12.0. The mV-readings were plotted against the pH values. The influence of the temperature on the characteristics of the electrodes was studied by recording the calibration graphs at different temperatures (20, 30, 40, 50, 60 °C).
2.6. Effect of foreign compounds on the electrode selectivity
The response of the studied electrodes was also examined in the presence of a number of other related substances. The potentiometric selectivity coefficients (KPotA,B) were evaluated according to
IUPAC guidelines using the separate solutions (SSM) and matched potential (MPM) methods [16, 17]. In SSM, the potential of cell compromising the membrane electrode and a reference electrode is measured with two separate solutions, A and B where A (NPZ ions) and B (interfering ion) at the same activity aA = aB. Selectivity coefficients were using the following equation:
logKpotA,B = ((EB – EA)/S) + (1 – (ZA/ZB)) log aA
where KPotA,B is the potentiometric selectivity coefficient, EA is the potential measured in 1 x
10-3 mol L-1 NPZ, EB the potential measured in 1 x 10⁻³ mol L-1 of the interfering compound (B), S the
interfering ion, respectively. While in MPM, the potentiometric selectivity coefficient of the sensors towards different species was calculated using this equation:
KpotD,B = (a`D – aD)/aB
where aB is the activity of the added interferent. The interfering ion would then be added to an
identical reference solution until the same potential change is obtained. The change in potential must be produced in a constant initial background of the primary ion and must be the same in both cases.
2.7 Calibration of the sensors
Calibration was made by immersing the modified sensors in conjunction with Ag-AgCl reference electrode in 50 ml beakers containing 10ml aliquots of standard 1 x 10⁻⁷ to 1 x 10⁻¹ mol L-1 drug solution. The potential readings were recorded for the drug starting from the low to high concentration. The potential response was plotted as a function of the logarithm of NPZ.HCl concentrations.
2.8 Determination of NPZ.HCl in pharmaceutical preparation
The concentration of NPZ.HCl in pharmaceutical preparation were determined using standard addition, potentiometric titration and calibration methods. Before the application of either of these methods the neozoline eye drop solution is evaporated gently on water bath till dryness. The residue is dissolved in methylene chloride depending on the fact that NPZ.HCl is insoluble in methylene chloride while chlorophenramine maleate is soluble in methylene chloride, so the residue was washed twice in with methylene chloride to get ride of chlorophenramine maleate and the white residue containing NPZ.HCl was dissolved in definite volume of distilled water and transferred quantitatively to 50 mL beaker [13].
In standard addition method, known increments of standard NPZ.HCl solution were added to constant volume of samples of different concentrations. Then the variation in potential readings was recorded for each increment and the unknown concentration was calculated.
In the potentiometric titration of NPZ solution, aliquots of the drug solution containing 1.5-9.35 mg were transferred into a 25 ml beaker and titrated with a standard solution of NaTPB (2.02x10⁻³ mol L-1) using modified SPE and CPE as indicator electrodes conjugated with Ag/AgCl as reference electrode. The end points were determined from the S-shaped curves using the first derivative plots.
3. RESULTS AND DISCUSSION
3.1. Ion pair stoichiometric ratios
Since NPZ.HCl is a cation, it has high affinity to form water insoluble ion-pair complexes with oppositely charged ions such as TPB, PTA, PMA, STA or RN. So in this study, different NPZ-IPs were prepared and their stoichiometric ratios were determined from elemental analysis. The elemental analysis results showed that NPZ forms ion pair with TPB of 1:1 stoichiometric ratio [NPZ]:[TPB] ion pair with calculated: %C = 02.20, %H = 6.62 and %N = 5.29 and found: %C = 86.48, %H = 2.16 and %N = 5.38. For NPZ-RN ion pair: %C = 35.93, %H = 4.5 and %N = 20.95 and found: %C = 36.57, %H = 2.95 and %N = 21.46. This showed that NPZ.HCl forms ion pairs with NaTPB and RN in 1:1 stoichiometric ratio. For PMA and PTA 3:1 [NPZ]:[PMA] and [NPZ]:[PTA] ion pairs are formed with calculated %C = 19.65, %H = 1.75 and %N = 3.27 (found: %C = 19.55, %H = 1.48 and %N = 3.84) and %C = 13.92 , %H = 1.24 and %N = 2.32 (found: %C = 13.95 , %H = 1.30 and %N = 2.53), respectively. In addition, STA reagent forms 4:1 [NPZ]:[STA] ion pair with calculated %C = 17.39, %H = 1.55 and %N = 2.898 (found: %C = 17.90 , %H = 1.61 and %N = 2.69).
3.2 Influence of the electrode composition
Since factors such as sensitivity, linearity, detection limit,… etc, for certain electrode are based on the electrode composition. Therefore, modified screen printed and carbon paste electrodes were prepared containing different amounts and types of ion pairs and the effect of their concentrations and the influence of the nature of the ion pairs in the modified SPE and CPE composition was investigated. The carbon and plasticizer contents for CMPE were also studied. Also, the effect of other factors such as effect of pH, selectivity, life time, temperature, response time and application were studied.
3.2.1. Effect of the ion pair nature and content.
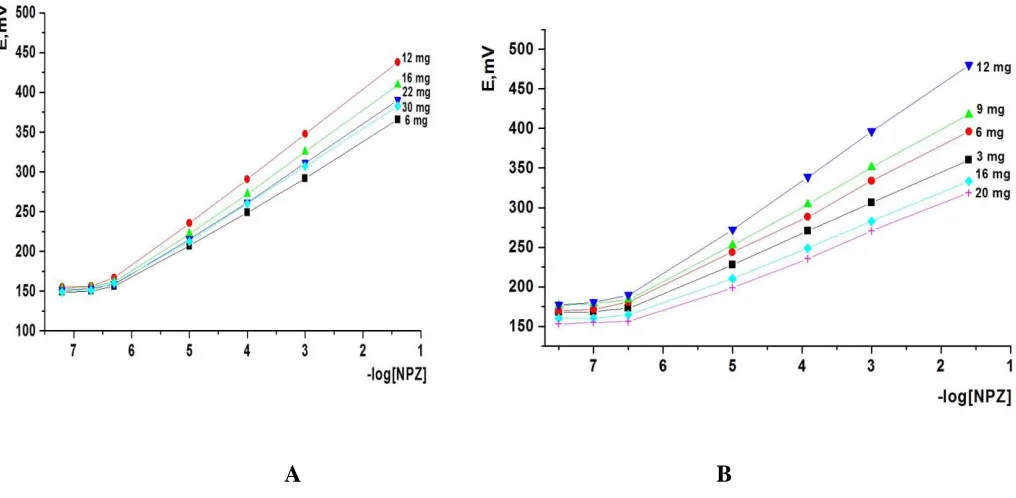
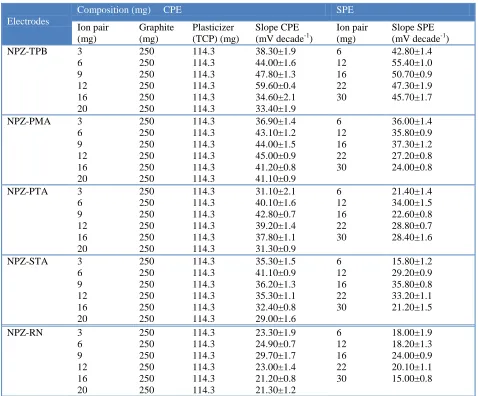
Several modified SPEs and CPEs were prepared containing different ion pairs (NPZ-TPB, NPZ-PMA, NPZ-PTA, NPZ-STA or NPZ-RN) as modifiers and the effect of the type of these modifiers was studied. It was found that electrodes modified with NPZ-TPB as ion pair have high Nernstian slope (55.4±2.2 and 59.6±1.3 mV decade−1 for modified SPE and CPE, respectively, Table 1) and hence high sensitivity in comparison to other electrodes as shown in Table (2). For this reason NPZ-TPB ion pair was selected as an ion exchanger in the preparation of all the subsequent electrodes. Then the effect of NPZ-TPB ion pair content on the electrode composition was studied by preparing several electrodes containing different amounts of NPZ-TPB ion pair ranging from 6-to-30 mg for modified SPE and from 3–to-20 mg for modified CPE. The results are summarized in Table (2).
Table 1 . Response characteristics of modified SPE and CPE sensors.
Parameter Modified SPE Modified CPE
Slope (mV decade-1) 55.40±2.2 59.60±1.3
Correlation coefficient (r) 0.994 0.980
Concentration rang (mol L-1) 5.0x10⁻⁷ – 3.5x10⁻² 3.0x10⁻⁷ – 2.5x10⁻²
Working pH range 2.5-8.5 2.7-8.5
Life time (days) 47 32
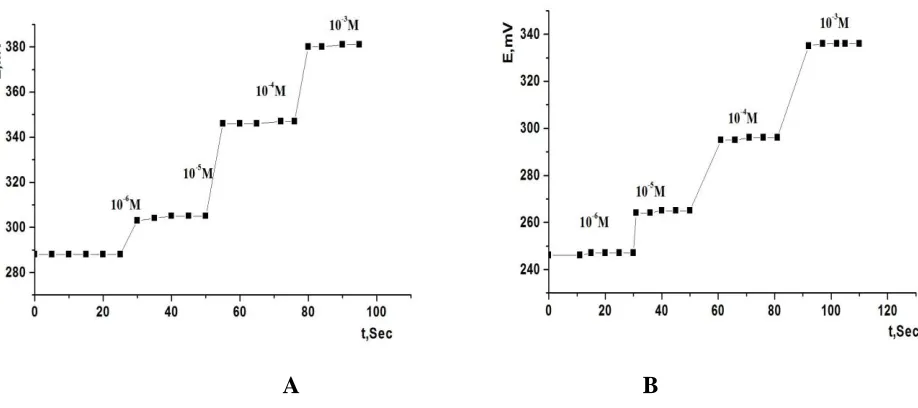
Response time (s) 5 11
Isothermal coefficient (V/°C) 0.0018 0.0012
Detection limit (mol L-1) 2.512 x10⁻⁷ 3.162x10⁻⁷
Quantification limit (mol L-1) 8.373 x10⁻⁷ 1.054x10⁻⁶
SD 0.008 0.007
RSD% 0.399 0.349
highest slope values of the calibration curves (55.4±1.0 and 59.6±0.4 mV decade−1 for SPE and CPE, respectively) was found to be 12 mg for both electrodes, Figure (2). None of the compositions gives the true theoretical slope because of the expected lack of thermodynamic ion-exchange equilibrium at the solution-solid interface.
A B
Figure 2. Effect of the content of NPZ-TPB ion pair for a) modified SPE b) modified CPE.
3.2.2 Effect of graphite and plasticizer contents for modified CPE.
[image:7.596.52.560.398.647.2]
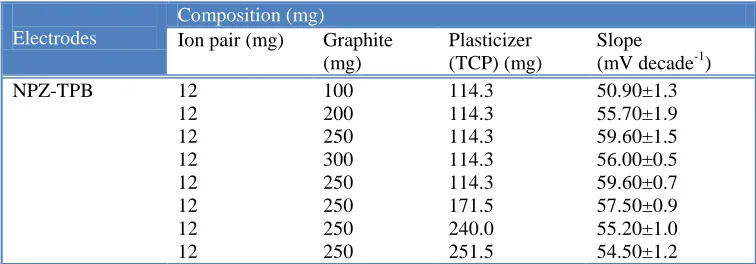
electrode containing 250 mg carbon powder and 114.3 mg TCP had the highest Nernstian slope (59.9± mV decade-1) as shown in Table (3). Concentrations more or less than these values result in non homogenized paste that had less response than mentioned above.
3.3. Performance of the electrodes
3.3.1 Calibration plots
[image:8.596.60.538.310.706.2]From the results obtained in Table 1, it is clear that the prepared sensors can be successfully applied for the potentiometric determination of the drug under study with linear response in the concentration range of 5.0x10⁻⁷ – 3.5x10⁻² and 3.0x10⁻⁷ – 2.5x10⁻² mol L-1 for modified screen printed and carbon paste electrodes, respectively.
Table 2. Effect of ion pair content on the performance of modified SPE and CPE sensors.
Electrodes
Composition (mg) CPE SPE
Ion pair (mg) Graphite (mg) Plasticizer (TCP) (mg) Slope CPE (mV decade-1)
Ion pair (mg)
Slope SPE (mV decade-1)
NPZ-TPB 3
6 9 12 16 20 250 250 250 250 250 250 114.3 114.3 114.3 114.3 114.3 114.3 38.30±1.9 44.00±1.6 47.80±1.3 59.60±0.4 34.60±2.1 33.40±1.9 6 12 16 22 30 42.80±1.4 55.40±1.0 50.70±0.9 47.30±1.9 45.70±1.7
NPZ-PMA 3
6 9 12 16 20 250 250 250 250 250 250 114.3 114.3 114.3 114.3 114.3 114.3 36.90±1.4 43.10±1.2 44.00±1.5 45.00±0.9 41.20±0.8 41.10±0.9 6 12 16 22 30 36.00±1.4 35.80±0.9 37.30±1.2 27.20±0.8 24.00±0.8
NPZ-PTA 3
6 9 12 16 20 250 250 250 250 250 250 114.3 114.3 114.3 114.3 114.3 114.3 31.10±2.1 40.10±1.6 42.80±0.7 39.20±1.4 37.80±1.1 31.30±0.9 6 12 16 22 30 21.40±1.4 34.00±1.5 22.60±0.8 28.80±0.7 28.40±1.6
NPZ-STA 3
6 9 12 16 20 250 250 250 250 250 250 114.3 114.3 114.3 114.3 114.3 114.3 35.30±1.5 41.10±0.9 36.20±1.3 35.30±1.1 32.40±0.8 29.00±1.6 6 12 16 22 30 15.80±1.2 29.20±0.9 35.80±0.8 33.20±1.1 21.20±1.5
NPZ-RN 3
Table 3. Effect of paste composition of CPE sensor.
Electrodes
Composition (mg)
Ion pair (mg) Graphite
(mg)
Plasticizer (TCP) (mg)
Slope
(mV decade-1)
NPZ-TPB 12
12 12 12 12 12 12 12
100 200 250 300 250 250 250 250
114.3 114.3 114.3 114.3 114.3 171.5 240.0 251.5
50.90±1.3 55.70±1.9 59.60±1.5 56.00±0.5 59.60±0.7 57.50±0.9 55.20±1.0 54.50±1.2
3.3.2 Effect of pH
The effect of pH on the potentiometric response of the modified electrodes (SPE and CPE) was studied. This was achieved by recording the change in the electrodes potential readings at different pH values (pH 2–12, Figure (3)). The change in pH of the test solution was changed by adding of small volumes of HCl and/or NaOH (0.1-1 mol L-1) to the test solution (10-2 and 10-4 mol L-1). As shown in Figure (2), the electrodes responses at pH ranges of 2.5-8.5 and 2.7-8.5 for modified SPE and CPE, respectively, where they are independent of pH. At pH value less than 2.5 and 2.7 for modified SPE and CPE, the decrease in mV readings may be due to interference of hydronium ion. While, at pH value higher than 8.5, the decrease in the mV readings may be due to base precipitates in the test solution and consequently, the concentration of unprotonated species gradually increased. As a result, lower e.m.f readings were recorded. The decrease in potential readings at pH > 8.5, on the other hand, can be probably attributed to penetration of OH– ions into the gel layer of the membrane.
3.3.3 Effect of temperature
To study the thermal stability of the modified SPE and CPE sensors, calibration graphs (electrode potential (Ecell) versus p[NPZ]) were constructed at different test solution temperatures (20,
30, 40, 50 and 60 oC). The standard cell potentials (Eocell) were determined at different temperatures
from the respective calibration plots as the intercepts of these plots at pNPZ = 0 and were plotted versus (t−25), where t was the temperature of the test solution in °C. A straight line plot is obtained is obtained according to Antropov’s equation [18] and the slope of this line represents the isothermal coefficient of the electrodes which was found to be 0.0018 and 0.0012 V/°C for modified SPE and CPE, respectively, Table 1. The obtained value of the isothermal coefficient indicates that the electrodes under investigation had high thermal stability within the used range of temperature.
lower than the ones calculated from the Nernst equation, because the exchange process responsible for the membrane potential is slightly restricted, due to the partial covalent character of the bond in the ion associate and the rigidity of the electrodes surface on which the gel layer is formed. The latter reason also explains the good resistance of the electrode surface to temperature changes over the investigated range.
3.3.4 Electrode selectivity
Potentiometric selectivity coefficient (logKpotD,B) defines the ability of an ion-selective
electrode to distinguish a particular ion from others [19]. Important determination procedures for selectivity coefficients are reported as recommendations in the IUPAC paper [16, 17]. The potentiometric selectivity coefficient of the NPZ.HCl sensors towards inorganic cations, sugars and glycine was evaluated by the separate solutions (SSM) and matched potential (MPM) methods [16, 17]. The matched potential method, which is totally independent of the Nicolsky equation, had been developed to overcome the difficulty in obtaining accurate selectivity coefficients when ions of unequal charge are involved. In MPM in order to determine the selectivity coefficient, one would measure the change in potential upon changing the primary ion activity.
The results obtained are summarized in Table (4). The results obtained show that the prepared sensors show high selectivity for NPZ.HCl over several interfering compounds. The results also indicate that no serious interference by a number of drug excipients and diluents commonly used in the drug formulations (e.g. glucose, sucrose, maltose, fructose, starch and lactose). The inorganic cations did not interfere due to the differences in their ionic size, mobility, polarity, and permeability as compared to those of NPZ+ cation.
[image:10.596.58.537.495.669.2]A B
Figure 3. Effect of pH on the performance of (A) modified SPE and (B) modified CPE potentiometric sensors.
The tolerance was considered as the concentration imparting 1mV drift in the potential reading (4% error). These species do not interfere significantly. Their non interference is mainly attributed to the difference in polarity and lipophilic nature of their molecules relative to that of NPZ+ species.
3.3.5 Life time of the electrodes
For the determination of the life time of the modified SPE and CPE, calibration graph was constructed under optimum conditions on different days using the fabricated sensors. Modified SPE showed life time of 47 days without significant change in slopes of the calibration curves. After this period, the slope of the calibration curve decreased. CPEs has lifetime of 32 days without significant change in slopes of the calibration curves. After this period the slope of the calibration curve decreased significantly. A new surface for measurement using CPE can be achieved every time by squeezing out small portion of the paste and polishing it on filter paper till a shiny surface is obtained.
Table 4. Calculation of selectivity coefficients for the NPZ-TPB sensors using separate solution and matched potential methods.
Interfering ion Modified CPE Modified SPE
KpotD,B KpotD,B
MPM SSM MPM SSM
Glucose 1.5 x10⁻² --- 1.7 x10⁻² ---
Maltose 8.00 x10⁻³ --- 9.14 x10⁻³ ---
Lactose 1.08 x10⁻² --- 7.50 x10⁻³ ---
Fructose 7.43 x10⁻³ --- 8.86 x10⁻³ ---
Starch 8.75 x10⁻³ --- 2.50 x10⁻² ---
Glycine 9.25 x10⁻³ --- 1.75 x10⁻² ---
Na+ --- 2.95 x10⁻¹¹ --- 2.80 x10⁻¹³
K+ --- 8.12 x10⁻¹³ --- 4.07 x10⁻¹³
NH4+ --- 5.73 x10⁻¹³ --- 1.25 x10⁻¹²
Ca2+ --- 2.32x10⁻¹⁰ --- 7.89x10⁻¹⁰
Zn2+ --- 2.27 x10⁻⁴ --- 1.25 x10⁻⁴
Ni2+ --- 2.43 x10⁻⁷ --- 3.38 x10⁻⁴
Cu2+ --- 1.98 x10⁻⁵ --- 2.81 x10⁻³
Cd2+ --- 3.2 x10⁻⁴ --- 4.56 x10⁻⁷
Fe3+ --- 1.56x10⁻⁴ --- 4.23x10⁻⁵
Cr3+ --- 1.016 x10⁻³ --- 9.088 x10⁻⁶
3.3.6 Response time
[image:11.596.80.519.355.639.2]
[image:12.596.63.522.86.290.2]
A B
Figure 4. Response time of (A) modified SPE and (B) modified CPE potentiometric sensors.
3.3. Analytical application
The modified sensors under investigation were found to be useful in the potentiometric determination of NPZ.HCl in pure solution and in pharmaceutical preparation by using the standard addition, calibration and potentiometric titration methods, and the results are summarized in Table (5). NPZ.HCl determination in pharmaceutical formulation (eye drop) was performed on the prepared sample by direct potentiometry with conventionally prepared electrodes. The averages of the concentrations obtained for each sample and the corresponding standard deviations are shown in Table 4. To evaluate the quality of the results, recovery values were also determined and are presented in the same table. Statistical evaluation of the results of analysis of pure NPZ.HCl by the proposed electrodes and the manufacturer method [1, 20] showed that there is no significant difference between the proposed and reported method in terms of accuracy and precision (Table 5). In pharmaceutical analysis, it is important to test the selectivity toward the excipients and the fillers added to the pharmaceutical preparation. Fortunately, such materials mostly do not interfere. This is clear from the results obtained for the pharmaceutical preparation with respect to recovery percent (Table 5) that these excipients do not interfere.
Cx = CsVs/[(Vx + Vs) × 10n(E/S) − Vx)]
where Cx and Vxare the concentration and the volume of the unknown sample, respectively. Cs
and Vs are the concentration and the volume of the standard, respectively. S is the slope of the
calibration graph and E is the change in mV due to the addition of the standard. So the determination of the concentration depends mainly on E, hence to obtain noticeable E we need to prepare higher concentration of the standard.
The mean unknown concentration, Cx, the mean recovery and the relative standard deviation
values were calculated and the results obtained are given in Table (5). Therefore, the modified sensors can be used for the routine analysis of the NPZ drug in quality control laboratories.
4. METHOD VALIDATION
Electroanalytical method validation is the process used to confirm that the determination procedure employed for a specific test is suitable for its intended use like other analytical methods [22]. Validation tests of accuracy, precision, linearity, specificity and limit of detection and quantification were achieved using a standard NPZ.HCl stock solution.
4.1. Accuracy and precision
It can be described as the closeness of agreement between the value that is adopted, either as a conventional, true or accepted reference value, and the value found [22]. The accuracy of the proposed method using both modified SPE and CPE was investigated by the determination of NPZ.HCl in spiked samples prepared from serial concentrations of NPZ.HCl reference standards. The results summarized in Table (5), show high accuracy of the proposed method, as indicated by the percentage recovery values. The statistical analysis of the results using student’s t-test and variance ratio F-test showed no significant differences between them regarding accuracy and precision, Table (5).
Intra-day and inter-day precisions were assessed using three concentrations and five replicates of each concentration, the relative standard deviations were found to be very small indicating reasonable repeatability of the proposed method as shown in Table (6).
Precision was described as the degree of agreement among individual test results when the procedure is applied repeatedly to multiple samplings of a homogeneous sample. Precision usually expressed as standard or relative standard deviations of the replicate analysis [22]. Hence the precision of the proposed potentiometric method using the sensors under investigation was measured as percentage relative standard deviation (RSD %). This was achieved by repeating the proposed method for determination of NPZ.HCl in its pharmaceutical preparations to five replicates. The RSD% values for the repeated determinations are summarized in Table (5).
4.2. Linearity
calibration graph was obtained using five concentrations of standard NPZ.HCl. It was found that a linear relationship exist between the electrode potential/mV and the log [NPZ.HCl].
The regression data, correlation coefficients (r) and other statistical parameter are listed in Table (1).
4.3. Limit of detection and limit of quantification
The limit of quantification (LOQ) was determined by establishing the least concentration that can be measured according to ICH Q2(R1) recommendations [22], below which the calibration range is non linear, it was found to be 8.373 x10⁻⁷ and 1.054x10⁻⁶ mol L-1 for modified SPE and CPE, respectively. LOD is the lowest amount of the investigated compound in a sample that can be detected [21]. It is clear from the values of LOD that present in Table (1), that the sensors under investigation are highly sensitive and can be applied in determination of small amounts of NPZ.HCl.
4.4. Specificity
The specificity of the method was investigated by observing any interference encountered from the common excipients of the pharmaceutical formulations. It was found that these compounds did not interfere with the results of the proposed method as shown in Table 4.
5. COMPARISION WITH PREVIOUS REPORTED ELECTRODES
The performance characteristics of the proposed electrodes and those the previous reported electrodes are compiled in Table (7) for comparison. It is clear that their detection limit is lower, their working range is wider, and their response time is shorter. These findings show that these sensors surpass other electrodes in application.
6. CONCLUSIONS
Table 5. Determination of NPZ.HCl in pharmaceutical formulation (Neozoline) by applying the standard addition, potentiometric titration and calibration curve methods.
Tabulated F values at 95% confidence level is 6.39 (n = 5). Tabulated t values at 95% confidence level is 2.776 (n = 5)
Table 6. Evaluation of intra- and inter-day precision and accuracy of the modified CPE and SPE sensors.
Drug Electrode
type
Taken, mg mL-1
Intra day Inter day
Found, mg mL-1
Recovery %
SD RSD% Found,
mg mL-1
Recovery %
SD RSD%
Pure form Modified
CPE 12.340 5.230 2.123 12.380 5.200 2.125 100.32 97.56 101.63 0.004 0.029 0.012 0.136 0.712 0.245 12.15 5.190 2.118 98.46 96.75 95.93 0.022 0.041 0.045 0.718 1.016 0.895 Modified SPE 12.30 5.230 2.123 12.290 5.250 2.127 99.59 101.62 103.25 0.004 0.012 0.033 0.136 0.307 0.655 12.72 5.280 2.122 103.07 104.06 99.19 0.033 0.041 0.057 1.094 1.025 1.142
Neozoline Modified
CPE 5.500 2.250 0.623 5.494 2.245 0.626 98.80 98.00 102.43 0.007 0.009 0.013 0.349 0.672 0.252 5.499 2.243 0.619 99.80 97.20 96.74 0.038 0.050 0.047 1.893 1.992 0.910 Modified SPE 5.500 2.250 0.623 5.495 2.246 0.628 99.00 98.4 104.1 0.008 0.010 0.031 0.399 0.412 0.652 5.497 2.249 0.620 99.40 99.60 97.56 0.037 0.033 0.052 1.823 1.821 1.139
Table 7. Comparison of NPZ.HCl selective electrodes based on with those previously reported in literature.
Electrode Ion pair Slope mV decade-1
pH range Response time
Lifetime (month)
Detection limit (mol L-1)
Linear range (mol L-1)
Ref. no.
PVC NPZ–TPB 58.4 ± 1.1 3.0–8.0 20-30s 1 4.0× 10⁻⁶ 1.0 × 10⁻⁵–5.0× 10⁻² 12
Coated graphite electrode
NPZ–TPB 57.0 ± 0.1 3.0–8.0 10s 2 2.5×10⁻⁶ 5.0 × 10⁻⁶–5.0 × 10⁻² 12
SPE --- 57.5 ±1.3 3.0–8.0 3s 3 3.5 × 10⁻⁶ 1.0×10⁻⁶–1.0×10⁻² 13
CPE --- 55.9 ± 1.6 3.0–8.0 3s 2 1.5 ×10⁻⁶ 1.0×10⁻⁶–1.0×10⁻² 13
CPE NPZ–TPB 59.6±1.3 2.7-8.5 11 1 3.162x10⁻⁷ 3.0x10⁻⁷ – 2.5x10⁻² Present work
SPE NPZ–TPB 55.4±2.2 2.5-8.5 5 1.5 2.512x10⁻⁷ 5.0x10⁻⁷–3.5x10⁻² Present work
Sample Taken
(mg mL -1)
CPE SPE British pharmacopoeia
Standard addition method 1.50 2.87 5.90 9.35
Found (mg mL -1) Recovery (%)±SD RSD % Found (mg mL -1) Recovery (%)±SD RSD % Found (mg mL -1) Recovery (%)±SD RSD % 1.493 2.863 5.885 9.337 99.53±0.01 99.76±0.014 99.75±0.023 99.86±0.167 0.679 0.493 0.391 1.821 1.496 2.873 5.877 9.346 99.73±0.012 100.10±0.016 99.61±0.039 99.96±0.069 0.830 0.556 0.657 0.740 1.492 2.865 5.887 9.346 99.47±0.008 99.83±0.028 99.78±0.035 99.96±0.069 0.531 0.991 0.605 0.740 Potentiometric titration method 1.487 2.865 5.891 9.339 99.13±0.017 99.83±0.024 99.85±0.041 99.88±0.064 1.170 0.843 0.703 0.686 1.498 2.868 5.902 9.347 99.87±0.01 99.93±0.019 100.03±0.044 99.97±0.085 0.645 0.653 0.755 0.912 Calibration curve method 1.494
2.872 5.905 9.346 99.60±0.011 100.07±0.019 100.08±0.046 99.96±0.164 0.725 0.673 0.787 1.772 1.495 2.870 5.903 9.352 99.67±0.009 100.00±0.017 100.05±0.040 100.02±0.086 0.582 0.599 0.678 0.928
F-test Standard addition method: 1.563-5.858
Potentiometric titration: 1.162-4.516 Calibration method: 1.727-5.649
Standard addition method: 1.00-3.063 Potentiometric titration: 1.518-2.172 Calibration method: 1.553-2.713
t-test Standard addition method: 0.108-0.286
Potentiometric titration: 0.00-0.588 Calibration method: 0.00-0.783
[image:15.596.14.588.113.347.2] [image:15.596.29.583.425.604.2] [image:15.596.18.577.632.768.2]
References
1. British Pharmacopoeia, Stationary Office London, 1517, 2008.
2. "Ophthalmology: naphazoline". Tarascon Pocket Pharmacopoeia 2009. Jones and Bartlett Publishers. 2008.
3. J.M.L. Gallego and J. P. Arroyo, J. Chromatogr., B: Anal. Technol. Biomed. Life Sci., 784 (2003) 39.
4. J. M. L. Gallego and J. P. Arroyo, J. Sep. Sci., 26 (2003) 947. 5. C. Petr, S. Dalibor and S. Petr, Talanta, 70 (2006) 408.
6. E. Souri, M. Amanlou, H. Farsam and A. Afshari, Chem. Pharm. Bull., 54 (2006) 119. 7. H. Goicoechea, M. Collado, M. Satuf and A. Olivieri, Anal. Bioanal. Chem., 376 (2003) 460. 8. G.J.M. Lemus and A.J. Perez. J. Chromatogr., B: Anal. Technol. Biomed. Life Sci., 784 (2003) 39. 9. J. Charles and M. Bertucat, Anal. Lett., 32 (1999) 373.
10.S.O. Hman. Drug Dev. Ind. Pharm., 13 (1987) 1257.
11.S. Belal, M. A. Elsayed, M. E. Abdel-Hamid and H. Abdine, J. Pharm. Sci., 70 (2006) 127. 12.S. M. Ghoreishi, M. Behpour and M. Nabi, Sens. Actuators, B, 113 (2006) 963.
13.E.Y.Z. Frag, G.G. Mohamed, F.A. Nour El-Dien and M.E. Mohamed, Analyst, 136 (2011) 332. 14.http://csrg.ch.pw.edu.pl/tutorials/ise/,2005.
15.http://www.dropsens.com/en/screen_printed_electrodes_pag.html.2011. 16.IUPAC, Pure Appl. Chem. 72 (2000) 1852.17.
17. (a) Y. Umezawa, P. Buhlmann, K. Umezawa, K. Tohda and S. Amemiya, Pure Appl. Chem. 72 (2000) 1851. (b) Y. Umezawa, K. Umezawa and H. Sato, Pure Appl. Chem. 67 (1995) 507. 18.L.I. Antropov, Theoretical Electrochemistry, Mir Publisher, Moscow, (1977).
19.B.P. Richard, L. Erno. Recomendations for nomenclature of ion-selective electrodes (IUPAC Recommendations 1994) 27599-3290.
20.British pharmacopeia, Stationary Office London, 630, 2008. 21.R.P. Buck and E. Lindner, Pure Appl. Chem. 66 (1994) 527–536.
22.Mehmet Gumustas and Sibel A. Ozkan, The Open Anal. Chem. J., 5 (2011) 1.
23.ICH Harmonized Tripartite Guideline: Validation of Analytical Procedures. Text and
Methodology, Q2(R1). 2005. http://www.bioforum.org.il/Uploads/Editor/karen/q2_r1_step4.pdf], Current Step 4 Version, Parent Guidelines on methodology.