Int. J. Electrochem. Sci., 7 (2012) 1917 - 1926
International Journal of
ELECTROCHEMICAL
SCIENCE
www.electrochemsci.orgCetrimide Potentiometric PVC membrane Sensor
Farnoush Faridbod1,*, Masoumeh Khamseh-nejad,2 Mohammad Reza Ganjali3,1, Parviz Norouzi3, Leila Hajiaghababaei2
1
Endocrinology & Metabolism Research Center, Tehran University of Medical Sciences, Tehran, Iran 2 Department of Chemistry, Islamic Azad University, Shahre Rey Branch, Tehran, Iran
3
Center of Excellence in Electrochemistry, Faculty of Chemistry, University of Tehran, Tehran, Iran *
E-mail: faridbodf@gmail.com
Received: 11 January 2012 / Accepted: 13 February 2012 / Published: 1 March 2012
In the present work, two types of potentiometric electrodes were constructed for determination of cetrimide. The sensors demonstrated advanced performances with a fast response time, a lower detection limit of 4.0×10⁻⁶ M and potential responses across the range of 5.0×10⁻⁶-1.0×10⁻³ M. The sensors enabled the cetrimide measurement in pharmaceutical formulations. The sensors respond based on ion-exchange mechanism. Cetrimide-phosphotungstate showed better and more stable responses in comparison with cetrimide-tetraphenyl borate ion-pair. PVC membrane electrode was made after series of experiments. The best PVC membrane electrode performance was achieved by a membrane composition of 30% PVC, 60% DBP, and 10% ion-pair. The electrode displays a good selectivity for cetrimide with respect to a number of common foreign inorganic and organic species.
Keywords: Cetrimide, Potentiometric Sensor, PVC membrane, Ion-Pair, Phosphotungstate
1. INTRODUCTION
Cetrimide is used as an active pharmaceutical ingredient, an antispetic agent with detergent properties. It has the wide spectrum of anti-infective against bacteria and fungi. It is used as an ingredient of shampoos for treating seborrhoea and psoriasis. A very dilute solution can be applied topically for the relief of sore gums.
Thin layer chromatography, gas chromatography, high performance liquid chromatography was used for measurements of this compound [1].
over the past years [2-9].
PVC membrane electrodes are one of the subdivisions of potentiometric sensors [10-13]. Here, two kinds of potentiometric sensor were introduced. Both electrodes respond based on ion-exchange mechanism. Cetrimide-tetraphenyl borate ion-pair and Cetrimide-Phosphotungstate were used as sensing materials in construction of both electrodes. The best PVC membrane electrode was made after series of experiments and used for optimization of the sensor characterizations.
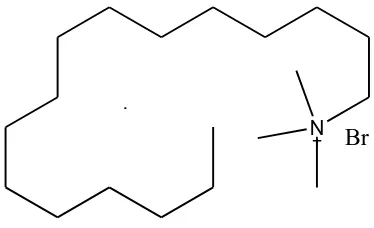
[image:2.596.204.391.199.313.2]N Br
Figure 1. Chemical structure of cetrimide
2. EXPERIMENTAL SECTION
2.1. Apparatus
The glass cell, where the indicator electrodes (PVC membrane electrodes) were placed, consisted of two Ag/AgCl double junction reference electrodes (Azar-Elelectrode Co., Iran) internal and external reference electrodes. Both electrodes were connected to a Corning ion analyzer with a 250 pH/mV meter with ±0.1 mV precision.
2.2. Reagents
Chemicals (of analytical reagent grade) were: high-molecular weight polyvinylchloride (PVC) (Fluka Co., USA), sodium tetraphenylborate (NaTPB), sodium phosphotungstate (Na3PT), aciddibutyl phthalate (DBP), nitrobenzene (NB), benzylacetate (BA) and tetrahydrofuran (THF) (Merck Co., Germany). All materials were of the highest available purity without further modification. Cetrimide and its pharmaceutical formulation were obtained from local pharmaceutical manufacturer (Tehran, Iran) as gift samples. Doubly distilled deionized water was used throughout.
2.3. Preparation of ion-pair
with 20 mL of 0.01 M solution of tetraphenylborate. The resulting precipitate was filtered, washed with water and dried in room temperature [14-19].
2.4. Preparation of the Electrode
General procedure to prepare PVC membrane was as follow: different amounts of ion-pair along with appropriate amounts of PVC, plasticizer and additive were dissolved in tetrahydrofuran (THF), and the solution was mixed well into a glass dish of 2cm diameter. Followed by THF was evaporated slowly until an oily concentrated mixture was obtained. A plastic tube (about 3mm o.d.) was dipped into the mixture for about 10s so a transparent membrane of about 0.3mm in thickness was formed. The tube was then pulled out from the mixture and kept at room temperature for about 10h.
Afterwards, the tube was filled with an internal filling solution (1.0×10⁻³ M of cetrimide solution). The electrode was finally conditioned for 48h by soaking in the same solution [14-19]. The conditioning time in case of the membranes having cetrimide-phosphotungstate (CTR-PT) ion-pair is 24h.
2.5. Standard solution of cetrimide
A stock solution of 0.02 M cetrimide was prepared. The working standard solutions (1×10⁻⁷ to 1×10⁻² M) were prepared by appropriately dilution of the stock solution with distilled water.
2.6. The emf Measurements
Following cell assembly for the conduction of emf (electromotive force) measurements were used:
Ag-AgCl || internal solution, 1×10⁻³ M cetrimide solution | PVC membrane | sample solution || Ag-AgCl, KC1 (satd.)
These measurements were preceded using calibration of the electrodes with several standard solutions.
3. RESULTS AND DISCUSSION
3.1. PVC Membrane Composition Selection
proportions of the electrode membrane components. The main components of a membrane are PVC matrix, plasticizer and ion-pair. Each membrane component plays a special role in the membrane function and electrode response. Previous studies shows that the membrane prepared with a plasticizer/PVC ratio about 2.2 can show the best performance [20-26]. As it can be seen in Table 1, the optimum amount of PVC was selected 30 mg.
Plasticizer acts as a membrane solvent allowing homogeneous dissolution and diffusional mobility of the ion-pair inside the membrane [27-34]. The plasticizer should be water- immiscible liquid of low vapor-pressure, compatible with PVC, no functional groups which can undergo protonation reactions. The selectivity of such electrode can be significantly influenced by the choice of the membrane solvent. Nature of the plasticizer has a noticeable effect on analytical responses e . g . slope, linear domain and selectivity of PVC membrane electrodes [32-37]. Here, two plasticizers with different polarity (dielectric constant) were tested, dibutyl phthalate (DBP with DC of 6.4) and nitrobenzene (NB with DC of 35.7) as listed in Table 1. The electrode responses showed that membrane which had DBP respond better. DBP had the lowest dielectric constant than NB, and provided an effective linear range and a lower detection limit due to the better extraction of the cetrimide which is a relatively non-polar species in the organic layer of the membrane.
Phosphotungstic acid (PTA), tungstophosphoric acid (TPA), is a heteropoly acid with the chemical formula H3PW12O40. It normally present as a hydrate. Cetrimide hydrochloride and other organic amines are well known for reacting with phosphotungstic acid or phosphomoybdic acid to form stable pair complexes [38,39]. In this, work using cetrimide-phosphotungstate (CTR-PT) ion-pair, instead of cetrimide-tetraphenylborate (CTR-TPB), in composition of PVC membrane, caused the electrode showed a better Nernstian behavior. The membrane incorporated with CTR-PT is faster conditioned and the response time is less than the membranes having CTR-TPB.
As it can be seen from Table 1, absence of ion-pair in the membrane causes a very poor response (membrane no. 6), which confirm t h e significance of the ion-pair.
[image:4.596.35.561.583.735.2]Finally, membrane no. 5 with the composition of 30% PVC, 10% ion-pair, and 60% DBP was the optimum one for m aki n g cetrimide sensor.
Table 1. Optimization of PVC membrane ingredients
No. Composition (%) Slope
(mV per decade)
LR (M) DL (M) R2
PVC Plasticizer Ion-pair
3.2. Calibration Curve and Statistical Data
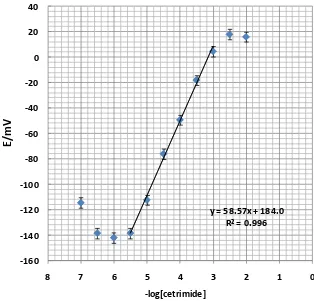
The measuring range of a potentiometric sensor is the linear part of the calibration graph as shown in Figure 2.
Measurements could be performed in this range, but noted that more closely spaced calibration points are required for more precise determinations. For many electrodes the measuring range can extend from 1 molar to 10-6 or even 10-7 molar concentrations [28-32]. Calibration graph slope for PVC membrane electrode is 58.6 mV per decade of the cetrimide concentration and a standard deviation of ±0.3 mV after five replicate measurements. A linear response towards the cetrimide concentration was from 5.0×10⁻⁶-1.0×10⁻³ M. Detection limit was calculated from the intersection of two extrapolated segments of the calibration graph. In this work, detection limit of both proposed sensor was 4.0×10⁻⁶ M which was calculated by extrapolating the two segments of the calibration curves.
y = 58.57x + 184.0 R² = 0.996
-160 -140 -120 -100 -80 -60 -40 -20 0 20 40
0 1 2 3 4 5 6 7 8
E/
mV
-log[cetrimide]
Figure 2. Calibration curves of PVC membrane electrode. The results are based on 5 replicate measurements. The electrode was made of the membrane composition no. 5.
3.3. Dynamic Response Time
[image:5.596.139.453.315.616.2]
solutions from 5.0×10⁻⁶ to 1.0×10⁻³ M. The sensor was able to quickly reach its equilibrium response in the whole concentration range. This time was about 20 seconds in whole concentration range.
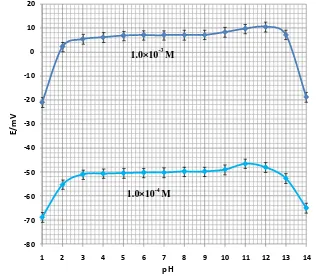
3.4. pH Effect on the Electrodes Response
To test the effect of pH on electrode response, the potential was measured at specific concentration of the cetrimide solutions (1.0×10⁻³ M and 1.0×10⁻⁴ M) from the pH value of 1.0 up to 14.0 (concentrated NaOH or HCl solutions were employed for the pH adjustment). The results showed that the potential remained constant despite the pH change in the range of 3.0 to 10.0, which indicates the applicability of this electrode in this pH range. Relatively fluctuations in the potential vs. pH behavior took place below and above the stated pH. As it can be seen in Fig. 3, the sensor can respond in a wide spectrum pH range.
-80 -70 -60 -50 -40 -30 -20 -10 0 10 20
1 2 3 4 5 6 7 8 9 10 11 12 13 14
E
/mV
[image:6.596.140.456.318.594.2]pH
Figure 3. pH effect on the electrode response in the test solutions of 1.010-3 M and 1.010-4 M
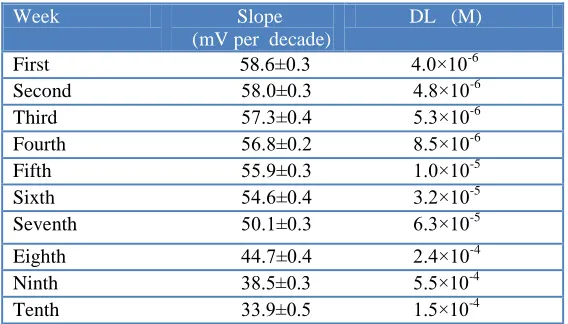
3.5. Life-time Study
The sensor lifetime was estimated with the calibration curve, periodical test of a standard solution (5.010-6-1.010-3 M) and calculation of its response slope. For this estimation, three electrodes were employed extensively (1 hour per day) for 10 weeks. After 6 weeks utilization of PVC membrane electrode, two changes were observed as seen in Table 2: a slight gradual decrease in the slope (from 58.6 to 33.9 mV per decade) and an increase in the detection limit (from
1.010-3 M
[image:7.596.157.441.165.327.2]
5.0×10⁻⁶ M to 1.5×10⁻⁴ M). In PVC membrane electrodes after several time of usage, the membrane ingredients leak from the organic layer and affect the membrane response [14-19].
Table 2. Lifetime of the PVC membrane electrode
Week Slope (mV per decade)
DL (M)
First 58.6±0.3 4.0×10⁻⁶
Second 58.0±0.3 4.8×10⁻⁶
Third 57.3±0.4 5.3×10⁻⁶
Fourth 56.8±0.2 8.5×10⁻⁶
Fifth 55.9±0.3 1.0×10⁻⁵
Sixth 54.6±0.4 3.2×10⁻⁵
Seventh 50.1±0.3 6.3×10⁻⁵
Eighth 44.7±0.4 2.4×10⁻⁴ 16.5 1.6×10⁻⁵
Ninth 38.5±0.3 5.5×10⁻⁴ 15.1 4.2×10⁻⁵
Tenth 33.9±0.5 1.5×10⁻⁴ 14.5 8.5×10⁻⁵
3.6. Analytical Applications
Linearity, limit of detection, recovery test, selectivity, precision, accuracy, and ruggedness / robustness were the parameters used for the method validation. As mentioned before, the sensors were measured between 5.0×10⁻⁶ and 1.0×10⁻³ M. The calculated detection limit of the sensors was 4.0×10⁻⁶ M (1.45 µg/mL).
3.6.1. Recovery Test from formulation
The proposed sensor was evaluated by measuring the drug concentration in some formulations. The drug concentration in a cetrimide disinfectant solution (Behcimide-C, Behsa Company, Iran, 15 g cetrimide in each 100 ml of solution) was determined by the calibration method. The results are in satisfactory agreement with the labeled amounts. The corresponding recovery percentage value varied from 94.7-112.7%.
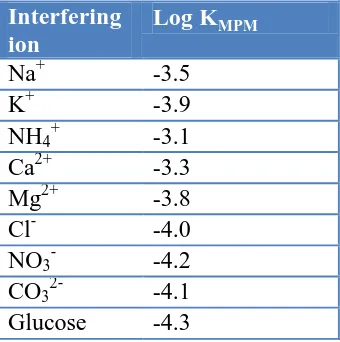
3.6.2. Selectivity
Table 3. Selectivity coefficients of various interfering compounds for cetrimide sensor
Interfering ion
Log KMPM
Na+ -3.5
K+ -3.9
NH4+ -3.1
Ca2+ -3.3
Mg2+ -3.8
Cl- -4.0
NO3- -4.2
CO32- -4.1
Glucose -4.3
3.6.3. Precision and accuracy
For repeatability monitoring, 5 replicate standard samples of 5, 50, 500 µg/mL were measured. The RSD values were obtained respectively of 3.3, 3.7, and 3.8%.
3.6.4. Ruggedness/Robustness
For ruggedness of the methods a comparison was performed between the intra- and inter-day assay results for cetrimide obtained by two analysts.
The RSD values for the intra- and inter-day assays in the cited formulations performed in the same laboratory by the two analysts did not exceed 3.7%. On the other hand, the robustness was examined while the parameter values, pH of the solution and the laboratory temperature, changed slightly. Cetrimide recovery percentages were good under most conditions, and not showing any significant change when the critical parameters were modified (RSD% less than 4.2).
4. CONCLUSIONS
ACKNOWLEDGEMENT
The authors are grateful to the Research Council of University of Tehran for the financial support of this work.
References
1. C. Moffat, M. D. Osselton, B. Widdop, Clarke's Analysis of Drugs and Poisons, 3th edition, Pharmaceutical Press, London (2005).
2. M. R. Ganjali, M. Rezapour, M. R. Pourjavid, and S. Haghgoo, Anal. Sci., 20 (2004) 1007. 3. E.Y.Z. Frag, A.M.K. Mohamed, G.G. Mohamed, E.E. Alrahmony, Int. J. Electrochem. Sci., 6
(2011) 3508.
4. M. R. Ganjali, P. Norouzi, F. S. Mirnaghi, S. Riahi and F. Faridbod, IEEE Sensors J., 7 (2007) 1138.
5. H. A. Zamani, M. R. Ganjali and M.J. Pooyamanesh, J. Brazil. Chem. Soc., 17 (2006) 149. 6. V. K. Gupta, R. Ludwig and S. Agarwal, Anal. Chim. Acta, 538 (2005) 213.
7. H. A. Zamani, G. Rajabzadeh and M. R. Ganjali, J. Brazil. Chem. Soc., 17 (2006) 1297.
8. M. R. Ganjali, R. Nemati, F. Faridbod, P. Norouzi, F. Darviche, Int. J. Electrochem. Sci. 3 (2008) 1288.
9. H. A. Zamani, M. R. Ganjali, P. Norouzi, and S. Meghdadi, J. Appl. Electrochem., 37 (2007) 853. 10.F. Faridbod, M. R. Ganjali, R. Dinarvand, and P. Norouzi, Sensors, 8 (2008) 2331.
11.F. Faridbod, M. R. Ganjali, R. Dinarvand and P. Norouzi, Afr. J. Biotechnol., 6 (2007) 2987. 12.M. R. Ganjali, P. Norouzi, M. Rezapour, F. Faridbod, and M. R. Pourjavid, Sensors, 6 (2006)
2331.
13.F. Faridbod, M. R. Ganjali, R. Dinarvand and P. Norouzi, Comb. Chem. High Throughput Screen., 10 (2007) 527.
14.M. R. Ganjali, A. Alipour, S. Riahi, B. Larijani and P. Norouzi, Int. J. Electrochem. Sci., 4 (2009) 1262.
15.M. R. Ganjali, F. Aboufazeli, S. Riahi, R. Dinarvand, P. Norouzi, M. H. Ghasemi, R. Kiani-Anbuhi and S. Meftah, Int. J. Electrochem. Sci, 4 (2009) 1138.
16.S. Riahi, F. Faridbod, M. R. Ganjali, Sensor Lett., 7 (2009) 42.
17.F. Faridbod, M. R. Ganjali, L. Safaraliee, S. Riahi, M. Hosseini and P. Norouzi, Int. J. Electrochem. Sci., 4 (2009) 1419.
18.F. Faridbod, M. R. Ganjali, R. Dinarvand, S. Riahi, P. Norouzi and M. B. A. Olia, J. Food Drug Anal., 17 (2009) 246.
19.F. Faridbod, M. R. Ganjali, B. Larijani, E. Nasli-Esfahani, S. Riahi, and P. Norouzi, Int. J. Electrochem. Sci., 5 (2010) 653.
20.A.Badri, and P. Pouladsaz, Int. J. Electrochem. Sci., 6 (2011) 3178.
21.M.R. Ganjali, H.A. Zamani, P. Norouzi, M. Adib and M. Accedy, Acta Chim. Slov., 52 (2005) 309. 22.M. R. Ganjali, H. Shams, F. Faridbod, L. Hajiaghababaei, and P. Norouzi, Mater. Sci. Eng. C, 29
(2009) 1380.
23.A.K. Singh, V. K. Gupta and B. Gupta, Anal. Chim. Acta, 1 (2007) 171.
24.H. A. Zamani, G. Rajabzadeh, M. R. Ganjali and P. Norouzi, Anal. Chim. Acta, 598 (2007) 51. 25.V. K. Gupta, R. Jain, M.K. Pal, Int. J. Electrochem. Sci., 5 (2010) 1164.
26.M. R. Ganjali, Z. Memari, F. Faridbod, and P. Norouzi, Int. J. Electrochem. Sci., 3 (2008) 1169. 27.H. A. Zamani, M. R. Ganjali and M. Adib, J. Brazil. Chem. Soc., 18 (2007) 215.
28.M. R. Ganjali, S. Rasoolipour, M. Rezapour, P. Norouzi, A. Tajarodi, Y. Hanifehpour, Electroanalysis, 17 (2005) 1534.
Michrochim. J., 60 (1998) 122.
31.M. R. Abedi, H. A. Zamani, M. R. Ganjali and P. Norouzi, Sensor Lett., 5 (2007) 516. 32.A.J. Hamdan, Int. J. Eelctrochem. Sci., 5 (2010) 215.
33.M. R. Ganjali, P. Norouzi, M. Adib, A. Ahmadalinezhad, Anal. Lett., 39 (2006) 1075.
34.H. A. Zamani, M. R. Ganjali, P. Norouzi, A. Tadjarodi, and E. Shahsavani, Mater. Sci. Eng. C, 28 (2008) 1489.
35.H. Behmadi, H. A. Zamani, M. R. Ganjali, P. Norouzi, Electrochim. Acta, 53 (2007) 1870. 36.M. R. Ganjali, T. Poursaberi, F. Basiripour, M. Salavati-Niasari, M. Yousefi, and M. Shamsipur,
Fresenius J. Anal. Chem., 370 (2001) 1091.
37.M. R. Ganjali, M. Tahami, M. Shamsipur, T. Poursaberi, and S. Haghgoo, M. Hosseini, Electroanalysis, 15 (2003) 1038.
38.M. R. Ganjali, R. Kiani-Anbouhi, M. Shamsipur, T. Poursaberi, M. Salavati-Niasari, Z. Talebpour, M. Emami, Electroanalysis 16 (2004) 1002.
39.A.A. Bunaciu, M.S. Ionescu, C. Palivan, and V.V. Cosofret, Analyst 116 (1991) 239. 40.M. Shamsipur, F. Jalali, and S. Haghgoo, J. Pharm. Biomed. Anal., 27 (2002) 867.
41.M. Javanbakht, A. Badiei, M. R. Ganjali, P. Norouzi, A. Hasheminasab and M. Abdouss, Anal. Chim. Acta, 601 (2007) 172.
42.M. R. Ganjali, M. Emami, M. Rezapour, M. Shamsipur, B. Maddah, M. Salavati-Niasari, M. Hosseini, and Z. Talebpoui, Anal. Chim. Acta., 495 (2003) 51.
43.M. R. Ganjali, T. Poursaberi, M. Hosseini, M. Salavati-Niasari, M. Yousefi, and M. Shamsipur, Anal. Sci., 18 (2002) 289.
44.F. Faridbod, M. R. Ganjali, M. Pirali-Hamedani and P. Norouzi, Int. J. Electrochem. Sci., 5 (2010) 1103.
45.M. R. Ganjali, Z. Memari, F. Faridbod, R. Dinarvand and P. Norouzi, Electroanalysis, 20 (2008) 2663.
46.P. R. Buck, and E. Lindneri, Pure Appl. Chem. 66 (1994) 2527.
47.M. R. Ganjali, S. Aghabalazadeh, M. Rezapour, M. Hosseini and P. Norouzi, Int. J. Electrochem. Sci., 5 (2010) 1743.