ISSN 16820959
Ζ
O
Q
LU
O
O
Research and
development:
an rhãâ| statistics
S -3b
Data 1 9 9 0 - 2 0 0 0
E U R
C O M M I S S I O N
Our mission is to provide the
European Union
with a
high-quality statistical information service
EurOStat'S Collections
are adapted to the needs of all users.
You will find them in each of the nine themes proposed by Eurostat.
1 General statistics
2 Economy and finance
3 Population and social conditions
4 Industry, trade and services
5 Agriculture and fisheries
¿m-
6 External trade
¿3L_~ 7 Transport
8 Environment and energy
9 Science and technology
ΠΤΤΊ Graphs
H
Tables
m
Comments,
^ ^ 8
■
C o n t e n t
P r e s s r e l e a s e s :
Eurostat publishes around TOO press releases every year in
connection with the release of new data. The press releases include the key figures
on the EU, the Member States and their partners. They are provided free of charge.
They are also available on the Internet as soon as they are published:
www.europa.eu.int/comm/eurostat/
S t a t i s t i c s i n f o c u s :
This collection is published regularly by Eurostat and provides
uptodate summaries of the main results of statistical surveys, studies and analyses.
It covers all themes and consists of about four to eight pages per issue. Eurostat issues
around 150
Statistics in Focus
per year. Available as single copies or on subscription.
K e y i n d i c a t o r s :
This collection provides the main indicators on a theme or
subtheme in an easytocarry booklet of up to 100 pages. Available as single
copies or on subscription.
P a n o r a m a o f t h e E u r o p e a n U n i o n :
This collection highlights the features
and trends of a multisectoral theme or a sectoral subtheme. The publications
consist of around 200 pages and include analysis as well as tables and graphs.
Available as single copies or on subscription.
M e t h o d s a n d n o m e n c l a t u r e s
are intended for specialists who want to
consult the methodologies and nomenclatures used for a theme, a subtheme or a
sector. Available as single copies.
D e t a i l e d t a b l e s
are intended for specialists. They present part, or all, of the
statistical data compiled on a theme, subtheme or sector. Available as single
copies or on subscription.
S t u d i e s a n d r e s e a r c h
summarise the results of European statistical studies
and research and are intended for specialists. Available as single copies or on
subscription.
C a t a l o g u e s
provide rapid access to concise information on Eurostats products
and services. They are free of charge and include the
Mini guide,
a selection of
Eurostat products and services, and
Statistical references,
the quarterly newsletter
on Eurostats latest products and services.
==
lul
¡III
III!
n
Ini
ü
¡Ë
....
:',
ΠΤ:
m
H
F o r m a t
Paper
Html
Paper
Paper
Html
Paper
CDROM
Paper
CDROM
Paper
CDROM
Paper
CDROM
o
o
o
ΓΜ
Research and
development:
annual statistics
D a t a 1 9 9 0 - 2 0 0 0
« T H E M E 9
m&M
Science
JççZ/M
and
C O M M I S S I O N
eiirOStat MS a i
technology
immediate access to harmonised statistical data
E u r o s t a t D a t a S h o p s : )
A personalised data retrieval service
In order to provide the greatest possible number of people with access to high-quality statistical
information, Eurostat has developed an extensive network of Data Shops (').
Data Shops provide a wide range of
tailor-made services:
* immediate information searches undertaken by a team of experts
in European statistics;
* rapid and personalised response that takes account of the specified search
requirements and intended use;
* a choice of data carrier depending on the type of information required.
Information can be requested by phone, mail, fax or e-mail.
(')
See list of Eurostat Data Shops at the end of the publication.
I n t e r n e t
D
Essentials on Community statistical news
•
Euro indicators: more than 100 indicators on the euro-zone; harmonised, comparable,
and free of charge;
• About Eurostat: what it does and how it works;
• Products and databases: a detailed description of what Eurostat has to offer;
• Indicators on the European Union: convergence criteria; euro yield curve and further
main indicators on the European Union at your disposal;
• Press releases: direct access to all Eurostat press releases.
For further information, visit us on the Internet at: WWW.europa.eU.int/COmm/eurOStat/
A great deal of additional information on the European Union is available on the Internet.
It can be accessed through the Europa server (http://europa.eu.int).
Cataloguing data can be found at the end of this publication.
Luxembourg: Office for Official Publications of the European Communities, 2001
ISBN 92-894-2060-X
ISSN 1682-0959
European Communities, 2001
Printed in Luxembourg
eurostat
EUROSTAT
L-2920 Luxembourg — Tel. (352) 43 01-1 — Telex COMEUR LU 3423
Rue de la Loi 200, B-1049 Bruxelles — Tel. (32-2) 299 11 11
Eurostat is the Statistical Office of the European Communities. Its task is to provide the
European Union with statistics at a European level, that allow comparisons to be made
between countries and regions. Eurostat consolidates and harmonizes the data collected by
the Member States.
To ensure that the vast quantity of accessible data is made widely available, and to help
each user make proper use of the information, Eurostat has set up a publications and
services programme.
This programme makes a clear distinction between general and specialist users and
particular collections have been developed for these different groups. The collections
Press
releases, Statistics in focus, Panorama of the European Union, Key indicators
and
Catalogues
are aimed at general users. They give immediate key information through
analyses, tables, graphs and maps.
The collections
Methods and nomenclatures, Detailed tables
and
Studies and research
suit
the needs of the specialist who is prepared to spend more time analysing and using very
detailed information and tables.
All Eurostat products are disseminated through the Data Shop network or the sales agents
of the Office for Official Publications of the European Communities. Data Shops are
available in 12 of the 15 Member States as well as in Switzerland, Norway and the United
States. They provide a wide range of services from simple database extracts to tailor-made
investigations. The information is provided on paper and/or in electronic form via e-mail, on
diskette or CD-ROM.
As part of the new programme Eurostat has developed its website. It includes a broad range
of on-line information on Eurostat products and services, newsletters, catalogues, on-line
publications as well as indicators on the euro-zone.
Acknowledgments
S
This publication was prepared under the direction of
Photis Nanopoulos,
Directorate A — Statistical information system, research and
data analysis, technical cooperation with Phare and Tacis countries,
H a r a l d Sonnberger,
Head of Unit A4 Research and development,
methods and data analysis. It has been coordinated by
I b r a h i m L a a f i a
with the collaboration of
A l i c e Zoppe
and
Anna Larsson.
The texts and the analyses were realised by:
M a r t a A l f a g e m e Perez de M e n d i g u r e n , Alex Stimpson
and
Christophe Zerr.
The data processing, the conception of the publication and the desktop publishing were realised by:
Marie-Agnès B r a g a r d , G é r a r d Carlier, Véronique d e K ä n e l
and
D a m i e n T o r n a b o n i .
The opinions expressed are those of the individual authors alone and do not necessarily reflect the position of the European Commission.
Maps
GISCO, Eurostat
© EuroGeographics Association 2001, for the administrative boundaries,
on behalf of the national organisations responsible for official mapping of the displayed countries.
Translation
Translation Service of the European Commission, Luxembourg.
Contributions
Eurostat
gratefully acknowledges the contributions of the following institutes which supplied the statistics for the respective countries:
B e l g i u m
Federal Office for Scientific, Technical and Cultural Affairs,
D e n m a r k
The Danish Institute for Studies in Research and Research Policy,
G e r m a n y
Bundesministerium für Bildung, Wissenchaft, Forschung und Technologie BMBF,
G r e e c e
General Secretariat for Research and Technology,
Spain
Instituto Nacional de Estadística INE,
F r a n c e
Ministère de l'éducation nationale, de la recherche et de la technologie MENRT,
»
Ireland
Forfas,
I t a l y
Istituto Nazionale di Statistica ISTAT,
L u x e m b o u r g
Service Central de la Statistique et des Études Économiques STATEC,
N e t h e r l a n d s
Statistics Netherlands CBS,
Austria
Austrian Central Statistical Office ÖSTAT,
•
Portugal
Observatório das Ciências e das Tecnologia OCT,
Finland
Statistics Finland,
{—
»
S w e d e n
Statistics Sweden,
U n i t e d Kingdom
Office for National Statistics ONS,
I c e l a n d
The Statistical Bureau of Iceland,
N o r w a y
Statistics Norway.
LU
Σ
Q
As well as the following institutions:
LU
- J
DG R e s e a r c h - European Commission
European P a t e n t Office -
EP0
Organisation for Economic Co-operation and Development
OECD
O
ζ
^ ϋ Enquiries regarding the purchase of data should be addressed to:
( J Eurostat Datashop tel: (+352) 4335 2251
^ 4, rue Alphonse Weicker fax: (+352) 4335 22221
L-2014 Luxembourg.
A great deal of additional information on the European Union is available on the Internet.
It can be accessed through the Europa server at http://www.europa.eu.int.
Foreword
τ
he first edition of Research and Development: Annual Statistics was
published in 1993. This ninth edition, prepared by the 'Research and
development, methods and data analysis' unit of Eurostat, presents
the latest developments in the field of research and development
and patent statistics.
Responding to developments in the policy and scientific communities, Research
and Development: Annual Statistics 2001 provides further information on relevant
indicators. Data and trends are provided not only for patent applications overall,
but also in high technology fields. Additional data on the number of researchers
amongst total R&D personnel are analysed for the European Union and beyond.
Furthermore, in an effort to provide users of Eurostat data with more detailed
information, certain indicators at the regional level are, for the first time,
presented at the NUTS 2 level as opposed to NUTS 1 in the previous publication.
Although limitations of space have prevented the inclusion of complete time series
in all cases, these data can be found in the CD-ROM version of this publication and
are, of course, available in Eurostat's reference database, NewCronos.
Comprehensive methodological notes are provided in their own section for
clearer data utilisation, providing such information as the source, reference unit
and coverage of the data, the time series available or any country specific
methodological changes in the collection procedures.
All the information in this publication is based on data supplied to Eurostat by the
Member States, by the Research DG of the European Commission, by the European
Patent Office - EPO - and by the OECD. We express our thanks to our colleagues
in the Member States - and in Iceland and Norway, the Commission Services, the
EPO and the OECD for their excellent cooperation and their willingness to help in
meeting the ever-growing demand for information on R&D.
O
sa
o
Yves Franchet 5S
Director-General — Eurostat LU
BC
O
LU
Table of contents
Η
Ζ
LU
Η
Ζ
Ο
υ
LU
Ο
LU
_ J
CQ
Acknowledgments
2
Foreword
3
Introduction
6
PART 1 - R&D in E u r o p e : analysis
9
C h a p t e r 1 — G o v e r n m e n t b u d g e t a p p r o p r i a t i o n s or o u t l a y s
on R e s e a r c h a n d D e v e l o p m e n t — GBAORD
1 0
1.1.
Introduction
.10
1.2.
GBAORD an international perspective
10
1.2.1. Total GBAORD
10
1.2.2. GBAORD by socioeconomic objective
12
1.3.
GBAORD a European perspective
12
1.3.1. Total GBAORD
12
1.3.2. GBAORD by socioeconomic objective
14
1.4.
Specific developments in the Member States country reports
16
1.4.1. Belgium
16
1.4.2. Germany
16
1.4.3. Italy
17
1.4.4. Austria
17
1.4.5. United Kingdom
18
1.4.6. Norway
18
C h a p t e r 2
—
R&D e x p e n d i t u r e a n d p e r s o n n e l
2 0
2.1.
Introduction
20
2.2.
Perspectives of R&D at the international level Europe, United States and Japan
20
2.2.1. R&D expenditure
20
2.2.2. R&D personnel
22
2.3.
R&D in Europe
23
2.3.1. R&D expenditure
23
2.3.2. R&D personnel
26
Research and Development
Annual Statistics 2001
Table of contents
C h a p t e r 2 — R&D e x p e n d i t u r e and p e r s o n n e l ( c o n t i n u e d )
2.4. R&D
in the regions 32
2.4.1. R&D expenditure in the European regions 32
2.4.2. R&D personnel in the European regions 36
2.5. Specific developments in the Member States country reports 37
2.5.1. Belgium .37
2.5.2. Finland 37
2.5.3. United Kingdom Government Office Regions 37
C h a p t e r 3 — E u r o p e a n p a t e n t i n g a c t i v i t i e s 38
3.1. Introduction 38
3.1.1. Patents as an indicator of innovative activities 38
3.1.2. Some notes to the reader 38
3.2. Patent applications to the
EPO
- An international perspective 39
3.3. Patent applications to the EPO - A European perspective 40
3.3.1. Patent applications to the EPO at the national level 40
3.3.2. Patent applications to the EPO from the European regions
44
PART 2 — Definitions and methodological notes 49
C h a p t e r 1 - GBAORD 5 0
C h a p t e r 2 — R&D e x p e n d i t u r e and p e r s o n n e l 54
C h a p t e r 3 — E u r o p e a n p a t e n t i n g a c t i v i t i e s 6 0
PART 3 - D a t a 6 5
GBAORD data 6 6
R&D e x p e n d i t u r e data 7 6
R&D p e r s o n n e l data 1 1 0
Patent a p p l i c a t i o n s data 1 3 4
REFERENCE data 1 5 7
A b b r e v i a t i o n s and o t h e r m e t h o d o l o g i c a l notes to t h e tables 172
Abbreviations and symbols 175
Introduction
ζ
o
Β
D
G
§
Z
The indicators presented in Research and Development: Annual
Statistics 2001, by the Statistical Office of the European
Communities (Eurostat), allow the continuous reporting and
analysis for a close monitoring of recent performances and the
identification of current and potential areas of concern.
The data, which cover R&D expenditure, R&D personnel,
Government budget appropriations or outlays for R&D and patent
applications, are as comprehensive, comparable and as up to date
as possible.
Their focus is on the 15 European Union Member States and, to a
lesser extent, the European Economic Area. To provide high level
international comparison, the United States and Japan are also
considered, where possible. At the other end of the scale, a
regional analysis across the EU countries is provided.
This publication, intended for both generalists and specialists, is
organised as follows. The first Part presents an analysis of the
recent trends in R&D and patenting. In Part 2, the accompanying
methodological information is provided in some detail for more
specialist users. Part 3 presents tables containing both original
data and derived indicators, providing users with the opportunity
to conduct their own analyses on the Research and Development
situation in Europe and beyond.
Given the numerous sources of data involved, the time series
differ according to indicator. For example, the first considered
year for indicators concerning GBAORD is 1985, whereas for R&D
expenditure, R&D personnel and Patents the starting points in this
publication are 1990. Nevertheless, the goal of this publication
remains the same throughout: to provide the most detailed and
coherent time series analysis possible.
Consistency with the analyses conducted in previous publications is
also maintained, whilst seeking to complement these aspects with
further research. A number of important innovations have been
introduced into this publication.
The first is an extended reporting of the data, with data on patents
now also presented according to their perceived technological
impact. The level of detail has been extended in the area of R&D
personnel too. Readers will note the inclusion of R&D personnel by
occupation, providing focus on the number of actual researchers
among total R&D personnel, which also includes, amongst others,
secretarial and clerical occupations.
A second innovation is the presentation of regional data in Part 3.
Here, data are presented at the NUTS 2 level (
1), as opposed to the
NUTS 1 level in the previous edition of
Research and Development:
Annual Statistics 1999
but for a reduced time series. Within
R&D expenditure and personnel or patents, data are organised
according to geographical detail, with national data being
presented before NUTS 2 level regional data.
In an effort to provide users with a set of rigorous and compre
hensive methodological notes, Part 2 of this publication presents in
some detail the information behind the data. For each variable
GBAORD, R&D expenditure and personnel or patents Part 2
specifies the appropriate definitions, sources, reference units,
time series, geographical coverage, method of calculation, etc.
Also documented in this section are the country specific notes,
such as breaks in series or methodological changes.
Due to constraints of space, the comprehensive statistical tables
used for the analysis are not always available in the paper version
of the present publication. Instead, they are provided in their
entirety in the electronic version of Research and Development:
Annual Statistics 2001. Electronic Versions of this publication can
be obtained by visiting the Eurostat Website at:
http://www.europa.eu.int/comm/eurostat.
Government budget appropriations
or outlays for R&D
In Part 1, Chapter 1 documents the main trends of GBAORD in
the EU and EEA, first placing Europe in an international context
and then concentrating on developments at the national level. In
2000, budget appropriations in the Member States of the European
Union totalled more than EUR 61 800 million, a rise of close to
EUR 2 700 million in nominal terms on 1999 (or 2 % in real terms,
i.e. corrected for inflation). Despite this, GBAORD in the EU
continued to deteriorate against GDP over the same period.
Comparisons with the US and Japan reveal that Japan has caught
up both the EU and the US to a significant degree since the end
of the '80s, registering almost systematic higher yearonyear
absolute growth. Nevertheless, the US still retains the highest
values of government budgeting to R&D activities.
Within the EU, Finland and France show the highest proportions of
government budgeting to R&D activities, both as a proportion of
their GDPs and also of total general government expenditure.
Spain and Portugal, on the other hand, have shown the highest
growth rate over the last five years and are approaching the EU
average.
Ï
1) The economic territory of each Member State of the EU has been divided
according to a fivelevel hierarchical classification (three regional levels
and two local levels) named Nomenclature of Territorial Units for Statistics
— NUTS. NUTS serves as a reference for the collection, development and
harmonisation of Community regional statistics, for the socioeconomic
analysis of the regions and for the drawing up of Community regional
policies. In general, NUTS subdivides each Member State into a number of
NUTS 1 regions, which are in tum subdivided into a number of NUTS 2
regions, and so on.
Introduction
Changing trends are also evident in the socioeconomic objectives
of these funds. The importance of budgeting towards 'Defence' has
continued to decline throughout the '90s. So too have 'Agricultural
production and technology' and 'Exploration and exploitation of
the earth'. Meanwhile, 'Research financed from general university
funds' has continued to see budgetary increases, as has 'Protection
and improvement of human health'.
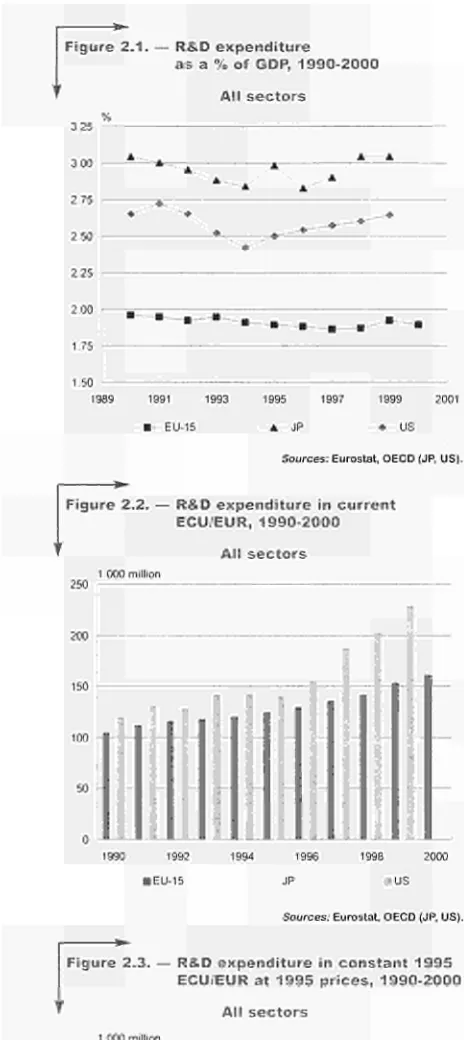
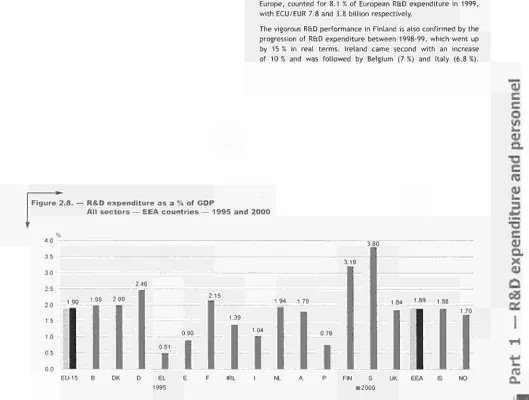
R&D expenditure and R&D personnel
Chapter 2, which looks at the recent trends in both R&D
expenditure and R&D personnel, shows that in the EU, 161 billion
ECU/EUR at current prices were spent on R&D in 2000. The
increase compared to 1999 was about 5
%.
However, as a
proportion of GDP, R&D expenditure was down to 1.90
%
in 2000
after a significant strong rise in 1999, which took it to 1.92
%.
R&D
expenditure per capita in the EU was about 400 current PPS, but
the figures vary a lot amongst European countries. The highest
performances were experienced in Finland and Sweden, which are
at the same level as Japan and the US.
For its part, R&D personnel increased slightly: 1.7 million people
in full time equivalent or 2.3 million in head count were engaged
in R&D in the European Union in 2000. Amongst these personnel,
the percentage of researchers was much more important in the
higher education sector than in the government or business enter
prise sectors. Moreover, women were unequally represented in
R&D, in particular when they were researchers and employed in
the business enterprise sector.
At the regional level, the latest data show that Germany continued
to dominate the amount of expenditure in R&D as a proportion of
regional GDP: 6 German regions are in
the
top ten. The other
places are occupied by 2 Finnish regions and 2 French. In the top
two regions, Braunschweig and Stuttgart, R&D as a proportion of
GDP was 4.84 and 4.79
%
respectively.
For R&D personnel, a greater degree of variation existed. Of the
top ten regions, 3 were Swedish, 3 were German, 1 was Austrian,
1 was French 1 was Finnish and 1 was Icelandic. Stockholm was in
first position with 3.7 % of the labour force being R&D personnel,
followed by Oberbayern (3.3
%)
and Braunschweig (3.2
%).
Patents
As documented in Chapter 3, patent applications to the European
Patent Office have been increasing in the second part of the 90's.
In 1999 there were 44 775 patent applications to the EPO from
EU Member States, 31 157 from the US and 14 236 from Japan.
Note that the EU Member States may have a home advantage.
Within Europe, Germany is leading, accounting for 43.6
%
of total
European patent applications in 1999, followed by France (14.9
%)
and the UK (12.3
%).
In relative terms, Germany also accounted for
the largest ratio (238 patent applications per million population in
1999). However, in relative terms, countries like Sweden and
Finland outperformed France and the UK in 1999, registering 237
and 233 patent applications per million population, respectively,
compared to 113 in France and 99 in the UK.
At the regional level, in 1999 the highest number of patent
applications came from île de France (2 813). But as a proportion
of the population, the two German regions of Oberbayern (635)
and Stuttgart (495) and a Dutch one, NoordBrabant (441),
registered the highest patenting concentrations.
Among the patent applications to the EPO, an increasing propor
tion relates to high technology areas. For the period 1994 to 1998,
patent applications from EU15 in the high tech fields grew at an
annual average growth rate of 22.8
%
compared to 11.1
%
for total
patent applications. This increase for high tech patents was
evident not just for the EU, but also for patent applications made
to the EPO by Japan and the US.
Ζ
o
ε
Ω
§
mm
Ά
Ui
Chapter 1
Government budget appropriations or outlays
on Research and Development — GBAORD
1.1. Introduction
O
<
CÛ
I
ti
ro
Government budget appropriations or outlays on R&D GBAORD
-are a way of measuring government support to R&D activities. They
include all appropriations allocated to R&D in central
government or federal budgets. Provincial or state government
should be included only where the contribution is significant.
Unless otherwise stated, data include both current and capital
expenditure, and cover not only government-financed R&D per
formed in government establishments, but also
government-financed R&D in the business enterprise, private non-profit and
higher education sectors, as well as abroad (i.e. international
organisations). Data are collected according to the guidelines
outlined in the OECD 'Proposed standard Practice for surveys of
research and experimental development' -
Frascati Manual,
1993.
GBAORD data do not consider the amount of money actually spent,
but are based on budget provisions, and so should be seen as inten
tions of spending. This is why data on actual R&D expenditure,
which are not available in their final form until some time after
the end of the budget year concerned, may well differ from the
original budget provisions. The process of political consensus about
public expenditures creates gaps between budgets and final
expenditures (gaps in terms of time and amount of resources). The
reporting unit also differs between GBAORD and R&D expenditure:
the reporting unit for GBAORD is the Government, whereas for
R&D expenditure the reporting unit is the performer of the R&D
activity. However, since there is a greater time lag for data on
final R&D expenditure, data are usually collected from budget
statistics in order to provide timely indicators.
Data are collected at the national level and the procedure can be
articulated in a two step process:
» within the budget statistics, it is first necessary to identify the
budget items that involve R&D;
• the R&D content of these budget items must then be measured
or estimated.
Government R&D appropriations are broken down by socio
economic objectives on the basis of NABS (Nomenclature for the
analysis and comparison of scientific programmes and budgets,
Eurostat, 1994). These data reflect policies at a given moment in
time and the concomitant priorities of the policy makers when
allocating their budgets. These data are hard to collect because
they are not obtained from
ad hoc
surveys, but from national
budget statistics. More specifically, the difficulty is due to the fact
that national budgets already have their own terminology and
methodology and therefore do not accord entirely with the
Eurostat guidelines and the methodology proposed by the
Frascati Manual.
The 1983 version of NABS applies to all the figures up until the 1992
final budgets and the 1993 provisional budgets. The 1993 version
applies from the 1993 final and the 1994 provisional budgets
onwards. As a result of the revision of NABS, some caution should
be employed when comparing the data for some NABS headings
with those of earlier years. The greatest differences are to be
found in chapters 1, 3, 5, 7, 10 and 11 of NABS (
1). Furthermore,
not all countries transpose their data directly to NABS: some
follow other compatible classifications - OECD, Nordforsk, which
are then converted to the NABS classification
of the
Frascati Manual.
see paragraph 455
The analysis in this chapter covers the period 1985 to 2000 and
is divided into three main sections. The next section takes an
international perspective and compares the respective evolutions
in the EU (
2), Japan and the US. The following section analyses the
evolution of GBAORD for the EU, whilst the final section presents
some specific developments in the Member States, with individual
country reports.
1.2. GBAORD —
an international perspective
This section considers government budgeting to R&D activities
in the European Union compared to that of Japan and the
United States. Overall levels of GBAORD are examined as well as
breakdowns by socio-economic objectives.
1.2.1. Total GBAORD
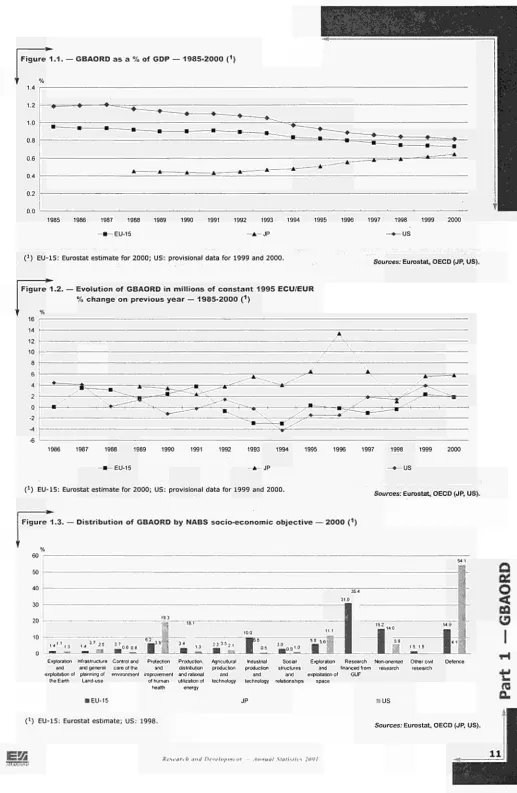
Throughout the late '80s and the '90s, the largest amount of
government funds allocated towards R&D activities was registered
by the United States, when measured as a percentage of GDP. In
nominal terms also (ECU/EUR), US GBAORD was for most years
above that of the whole of the European Union, as well as three to
four times higher than government budgeting to R&D activities in
Japan - see Part 3, Table 2. Figure 1.1. shows that the efforts
made by Governments in R&D activities are clearly converging.
Of course, GDP levels (as well as government budgeting towards
R&D activities) affect the relative effort made by countries to
R&D. Therefore, the healthy economic growth experienced in the
US and the EU towards the end of the '90s, and the stagnant or
negative growth encountered in Japan around the same time, play
their parts in determining the relative efforts made by the EU, the
US and Japan during this period. Nominal GBAORD has increased by
over 90
%
in Japan between 1988 and 2000 compared with close to
70
%
for the EU and 62
%
for the US (between 1985 and 2000).
Indeed, as shown by Figure 1.2., year on year absolute growth
(correcting for inflation) has been the highest in Japan for most of
the time period analysed. As for Figure 1.1, GBAORD in the US and
EU follow more similar paths. Both fluctuate between positive and
negative growth between 1985 and 2000 - the latest data show
that GBAORD increased in absolute terms by around 2
%
between
1999 and 2000.
t
1) These NABS chapters cover the following fields:
Chapter 1 — Exploration and exploitation of the Earth;
Chapter 3 — Control and care of the environment;
Chapter 5 — Production, distribution and rational utilisation of energy;
Chapter 7 — Industrial production and technology;
Chapter 10 — Research financed from General University Funds (GUF);
Chapter 11 — Non-oriented research.
(
2) No data exist for Luxembourg and therefore EU-15 totals in this chapter
exclude Luxembourg.
Research and Development ,innual Statistics 20Í11
EM
Figure 1 . 1 . — GBAORD a s a % of GDP — 1 9 8 5 - 2 0 0 0
(
1)
C
1) EU15: Eurostat estimate for 2000; US: provisional data for 1999 and 2000.
Sources:
Eurostat,
OECD (JP, US).
Figure 1.2. — Evolution of GBAORD in millions of c o n s t a n t 1 9 9 5 ECU/EUR
% c h a n g e on previous y e a r — 1 9 8 5 - 2 0 0 0
(
1)
C
1) EU15: Eurostat estimate for 2000; US: provisional data for 1999 and 2000.
Sources:
Eurostat, OECD
(JP, US).
Figure 1.3. — Distribution of GBAORD by NABS socio-economic o b j e c t i v e — 2 0 0 0 (
1)
50
40
30
20
i o
0
34 3.3 « n
■ - , ■
tm
, 1
05 . 0 9 1.0ï
56
I
I
'r
5
I
4
Expkxabon Infrastructure Control and Protection Production. Agricultural hduslrial Social Exploration Research Nonoriented Other civil Defence and and general care of the and distribution production production structures and financed from research research exploitation of planning of environment improvement and rational and and and exploitation of GUF
the Earth Landuse of human utilization of technology technology relationships space hearth energy
■ EU15
C
1) EU15: Eurostat estimate; US: 1998.
JP
us
Sources:
Eurostat, OECD (JP, US).
1
I
EM
!41!¿«MM¡
[image:15.587.46.563.25.818.2]GBAORD
by socio-economic objective
Not only does the level of budgeting towards R&D activities differ
across countries, but priorities are also distinct. GBAORD can be
broken down into socioeconomic objectives, providing informa
tion on changing trends and attitudes towards different types of
R&D activities.
Figure 1.3. displays the various stances taken on government
budgeting to R&D in 2000 (US ■ 1998). 'Research financed from
General University Funds (GUF)' accounted for the lion's share of
EU GBAORD in 2000 (31
%),
with 'Nonoriented research' and
'Defence' each accounting for a further 15% of planned R&D
budgeting. 'Industrial production and technology', which includes
such subchapters as 'Manufacturing and processing techniques'
and 'Electronic and related industries' represented 10 % of total
EU GBAORD in 2000. 'Exploration and exploitation of the earth'
and 'Other civil research' were the socioeconomic objectives with
the lowest budgets (1.4
%
each of total EU GBAORD), just below
'Infrastructure and general planning of landuse'.
'Research financed from GUF' was also the leading socioeconomic
objective in Japan in 2000 (35.4
%
of total GBAORD). A further
18.1
%
was allocated towards 'Production, distribution and
rational utilisation of energy', which includes such research as
'Radioactive waste management' and 'Renewable energy sources'.
The lowest proportion of budgeting in Japan was allocated towards
'Control and care of the environment' where it accounted for 0.8
%
of total GBAORD in Japan in 2000 compared with 2.7
%
in the EU
and 0.8
%
in the US.
In the United States, over half of all GBAORD in 1998 was allocated
to 'Defence' (54
%).
'Protection and improvement of human
health', which comprises such subchapters as 'Medical research'
and 'Preventive medicine', took up a further fifth of government
budgeting to R&D activities and 'Exploration and exploitation of
space' just over a tenth. No data are available for 'Research
financed from GUF' and 'Other civil research' for the US.
1.3.
GBAORD —
a European perspective
This section is split into two main parts. First, levels and trends of
total GBAORD are examined and compared at the national level.
Secondly, the changing socioeconomic priorities of European
governments are briefly evaluated.
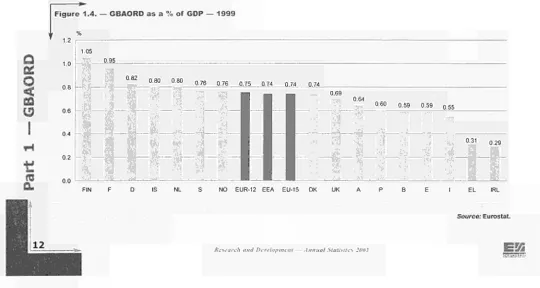
1.3.1. Total GBAORD
Whilst, in the EU, GBAORD represented 0.74
%
of GDP in 1999,
this figure conceals differences between the Member States
Figure 1.4. The highest effort in 1999 was registered by Finland
(1.05
%),
ahead of France (0.95
%).
Germany also placed more
emphasis on government budgeting towards R&D activities than
the EU average. In Belgium and Spain, budget efforts were around
80
%
of the EU average in 1999, just under 0.6
%
of GDP. Greek and
Irish GBAORD were around 40
%
of the EU average in the same year,
when measured as a percentage of GDP.
Another indicator, GBAORD as a percentage of total general
government expenditure, provides a proxy of the relative
emphasis that governments place on publicly funding R&D See
Figure 1.5. Again Finland, followed by France, budgeted more to
R&D activities than any other EU country in Finland, government
budgeting to R&D activities represented 2
%
of total general
government expenditure in 1999. The UK, which budgeted less
than the EU average when measured against GDP, budgeted over
10
%
more if taken as a proportion of total general government
expenditure. Spain, which stood at 80
%
of the EU average
for GBAORD/GDP in 1999, was at 94 % as a percentage of total
general government expenditure for the same year. This is
following a period that has witnessed strong increases in GBAORD
Figure 1.6.: the annual average growth rate of GBAORD in real
terms in Spain was 11.4
%
during the 19952000 period, although
this trails an absolute contraction in government budgeting to R&D
activities between 199095 ( 0.5
%).
Portugal, on the other hand,
Figure 1.4. — GBAORD as a % of GDP — 1 9 9 9
1.05
082
0.76
0.76
0.75
0.74
0.74
_ 0 J 4 _
064
0 6 0
0.59
0.59
0.55
031
0 29
FIN
F
D
IS
NL
S
NO
EUR-12 EEA
EU-15
DK
UK
Α
Ρ
Β
E
Source:
Eurostat
[image:16.587.14.554.524.812.2]has increased its absolute budgeting to R&D activities over the
whole of the decade, rising by an average of 6.3
%
per year
between 1990-95 and 10.6
%
per year between 1995-2000. In
both time periods, GBAORD has increased in absolute terms for a
majority of EU countries. Exceptions are the larger EU economies
of Germany, France and the UK, for which GBAORD contracted
throughout the '90s. Budgeting in Italy and the Netherlands on
average fell annually between 1990-95, but grew in the second half
Figure 1.5. — GBAORD a s a % of t o t a l g e n e r a l g o v e r n m e n t e x p e n d i t u r e — 1 9 9 9
of the '90s. GBAORD grew in Austria in the first half of the decade,
but then fell in the second.
Overall, if GBAORD at the EU level has remained stable relative to
the beginning of the '90s (measured in constant 1995 ECU/EUR,
see Part 3, Table 3), this is as a result of the smaller EU countries
increasing their government budgeting to R&D activities, offsetting
the budget reductions of the larger economies of Germany, France,
Italy and the UK.
FIN
F
UK
NL
D
EU-15
Ε
Ρ
DK
S
A
Β
I
IRL
EL
Source:
Eurostat
Figure 1.6. — Annual a v e r a g e g r o w t h of GBAORD in millions of c o n s t a n t 1 9 9 5 ECU/EUR
1 9 9 0 - 9 5 and 1 9 9 5 - 2 0 0 0 (
1)
EU-15
EEA
Β
DK
D
EL
E
F
IRL
I
NL
A
Ρ
FIN
UK
NO
IS
-6
1990-95
-3.3
-2.3
-0.5 ■
-0.5 I
f
1.9
1.4
-0.5
-0.9
-1.0
6.6
9.6
" !
|
1.8
I
;
2.6
6.2
6 3
8.3
10.3 %
12
EU-15
EEA
Β
DK
D
EL
E
F
IRL
I
NL
A
Ρ
FIN
UK
NO
IS
1 9 9 5 - 2 0 0 0
■ 0.5
■ 0.4
**"-*
-0.5
-1.2
■
-0.3
-0.5
-0.4
0.7
I
|
4.7
3.1
■
3.1
5.6
5.7
5.1
10.6
t
1) DK: 1993-95; D: 1991-95; F: 1992-95; IRL: 1995-99; FIN: 1991-94; IS: 1991-95 and 1995-99;
S not included due to numerous breaks in series;
data for latest available year are provisional except for FIN, NO and P.
E M
Research and Development
Annual Statistics 2001
Ω
a.
ι
I
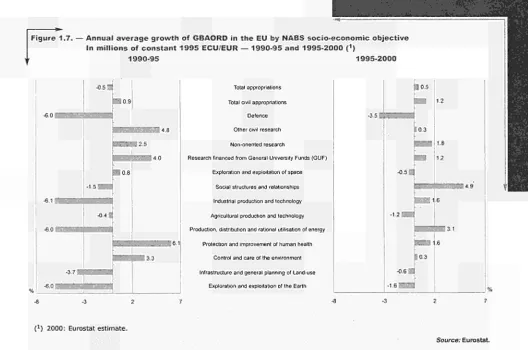
[image:17.587.35.566.44.782.2]GBAORD by socio-economic objective
Figure 1.3. showed the distribution of GBAORD by socio-economic
objectives for the EU, Japan and the US. Figure 1.7., in turn,
provides an indication of the evolution of these priorities at the
EU level during the '90s.
Budgeting for 'Defence', 'Agricultural production and technology'
and 'Exploration and exploitation of the earth' has fallen over
the whole of the decade, with 'Defence' and 'Exploration and
exploitation of the earth' contracting by an average 6
%
per year
between 1990-95. 'Agricultural production and technology', which
represented 3.5
%
of total EU GBAORD in 1990 (at constant 1995
ECU/EUR) declined by 0.4
%
during 1990-95 and by 1.3
%
between
1995-2000. In 2000, 'Agricultural production and technology'
represented 3.3
%
of EU GBAORD - recall Figure 1.3.
Of the two objectives that accounted for the most spending at
the EU level in 2000, 'Research financed from GUF' grew strongly
in the first half of the '90s and by 1.2 % in the latter, whereas
'Non-oriented research' grew by a more consistent 2.5 and 1.8
%
in 1990-95 and 1995-2000, respectively.
The highest growth in the first half of the '90s was registered for
'Protection and improvement of human health' at just over 6
%,
but this fell back to an annual average growth of around 1.6 % in
the second half of the '90s. In 2000, 40
%
of EU budgeting for this
objective was accounted for by the UK.
The strongest growth in the second half of the '90s was for the
socio-economic objective 'Social structures and relationships',
which by 2000 represented 3 % of total EU GBAORD - recall
Figure 1.3. - and includes research into such social aspects as
education and training or 'Management of businesses and institu
tions'. The growth of this objective was followed by 'Production
distribution and rational utilisation of energy' at 2.9
%,
for which
1995 was the turning point following its annual average 6
%
decline
in the first half of the '90s.
Budgeting for research on 'Control and care of the environment'
increased by an average of over 3
%
between 1990-95, but only
marginally thereafter. Germany represented around a third of total
EU budgeting to this objective in 2000.
Looking more closely at the priorities of the individual countries,
Table 1.1. shows that 'Research financed from GUF' was the highest
priority in 8 of the EU Member States. This objective accounted for
almost two thirds of total GBAORD in Austria in 2000, half of total
GBAORD in Sweden and around 45
%
in Greece, Italy and the
Netherlands.
In 2000, 'Defence' budgeting represented less than 10
%
of total
GBAORD in each of the Member States (15
%
at the EU level)
except Spain, France and the UK, where its proportion of total
GBAORD ranged from a little more than one-fifth for France to
around one-third for Spain and the UK. One should note that, for
Spain, a large proportion of the increase follows the incorporation
of budgets for a new programme into the 'Defence' budget (see
Part 2 - Definitions and methodological notes).
Denmark (12.4
%),
Ireland (20.0
%)
and Portugal (13.0
%)
devoted
a far higher proportion of their GBAORD to 'Agricultural production
and technology' than was the EU average (3.3
%).
As far as European Commission contributions go, in 1999, over a
third of its provisional Framework Programme budget for R&D
activities was allocated to 'Industrial production and technology'.
'Production, distribution and rational utilisation of energy'
represented another 15 % of this budget. The lowest socio
economic objectives were 'Exploration and exploitation of space'
(0.7
%)
and 'Exploration and exploitation of the earth' (1.9
%).
a
§
I
Research and Development Annual Statistics 200}
EM
Figure 1.7. — Annual a v e r a g e g r o w t h of GBAORD in t h e EU by NABS socio-economic objective
In millions of c o n s t a n t 1 9 9 5 ECU/EUR — 1 9 9 0 - 9 5 and 1 9 9 5 - 2 0 0 0 (
1)
1990-95
1995-2000
Total appropriations
Total civil appropriations
Defence
Other civil research
Non-oriented research
Research financed from General University Funds (GUF)
Exploration and exploitation of space
Social structures and relationships
Industrial production and technology
Agricultural production and technology
Production, distribution and rational utilisation of energy
Protection and improvement of human health
Control and care of the environment
Infrastructure and general planning of Land-use
Exploration and exploitation of the Earth
-6.1
. h l l H M U U
-6.0BBHMB
-0.5 3
-0.4"
0 9
0.8
4.8
■ 2.5
■ ■ 4 . 0
6.1
3.3
(') 2000: Eurostat estimate.
Source:
Eurostat
T a b l e 1 . 1 . — Distribution of GBAORD
'
1.
2.
3.
4.
5.
6.
7.
8.
9.
10
11
12
13 NABS
Exploration and exploitation of the Earth
Infrastructure and general planning of Land-use
Control and care of the environment
Protection and improvement of human health
Production, distribution and rational utilization of energy
Agricultural production and technology
Industrial production and technology
Social structures and relationships
Exploration and exploitation of space
Research financed from General Unnersty Funds (GUF)
Non-oriented research
Other civil research
Defence
Total civil appropriations
Total appropriations
EU-15
1.4
1.5
2.7
6.3
3.4
3.3
10.0
3.0
5.9
31.0
15.2
1.4
14.9
85.1
100
by NABS
Β
1.0
1.1
3.6
1.6
2.7
3.0
22.6
4.5
11.9
19.2
23.9
4.7
0.4
99.6
10O
DK
1.3
1 8
2 8
2 0
2 0
12 4
6 4
11.2
2 8
39 0
1 7 8
0 0
0 6
99.4
100
socio-economic
D
1.8
1 6
3.4
3 4
3.5
2 5
1 2 3
3 6
4 5
38 5
16.6
0.1
8 0
92.0
100
EL
3 8
5 1
3.3
5.8
1 5
6 9
1 3 8
4.1
0 9
45 8
8 0
0 3
0 8
99.2
100 E
2 0
0 6
2.7
4.8
3.6
4 2
1 5 8
0 6
5 5
21 4
7.3
1.2
30.2
69.8
100 F
0 6
0.7
1.8
5.6
5 1
2 5
6.4
0 7
1 1 0
1 7 9
2 2 5
2 6
22.6
77.4
100
objective
IRL
0.4
2 4
1.4
2.9
0 0
20.0
29.8
6 9
0 0
2 3 6
1 2 6
0.0
0.0
100
100 I
1 6
0.3
2.5
6.8
4 5
2 1
1 5 5
3.5
8 7
42 5
11 2
0 0
0 9
99.1
100
in
%
NL0 8
3.0
3.9
3.6
3.0
3 0
13.1
2.7
3.1
4 6 0
1 0 7
4.6
2.6
97.4
100
—
2 0 0 0 provisional (
1 A2 5
2.0
2.1
2.5
0 5
3.3
6.4
2 2
0.1
63 7
1 4 8
0 0
0.0
100
100 Ρ
1 6
7.6
4,4
6 6
0.9
13.0
1 3 0
3.4
0 5
36.1
8.2
3.4
1.2
98.8
100
FIN
1.5
2.2
2.3
6.8
5.3
5.4
28.5
5.5
2.1
26.8
12.3
0 0
1 3
98.7
100
S
1.7
4.1
1.4
1.3
5.8
1.8
5.4
5 6
3.4
50 9
0 0
11.5
7.1
92.9
100
UK
1.4
1.8
2.5
15.2
0.5
4.1
0.6
3.7
2.5
21.1
13.4
0.4
32.8
67.2
100 CEC
1.9
6.9
7.6
8.0
15.2
5.3
33.8
3.8
0.7
0.0
6.5
10.2
0.0
100
100 IS
0.0
5.3
0.6
4.2
2.5
23.5
1.2
44.3
0.0
0.0
18.3
0.0
0.0
100
100
NO
2.3
2.3
3.0
7.2
2.1
8.7
12.3
7.1
2.5
39.3
8.1
0.0
5.3
94.7
100