This is a repository copy of Volatility co-movement between Bitcoin and Ether. White Rose Research Online URL for this paper:
http://eprints.whiterose.ac.uk/151550/ Version: Accepted Version
Article:
Katsiampa, P. orcid.org/0000-0003-0477-6503 (2019) Volatility co-movement between Bitcoin and Ether. Finance Research Letters, 30. pp. 221-227. ISSN 1544-6123
https://doi.org/10.1016/j.frl.2018.10.005
Article available under the terms of the CC-BY-NC-ND licence (https://creativecommons.org/licenses/by-nc-nd/4.0/).
eprints@whiterose.ac.uk https://eprints.whiterose.ac.uk/
Reuse
This article is distributed under the terms of the Creative Commons Attribution-NonCommercial-NoDerivs (CC BY-NC-ND) licence. This licence only allows you to download this work and share it with others as long as you credit the authors, but you can’t change the article in any way or use it commercially. More
information and the full terms of the licence here: https://creativecommons.org/licenses/
Takedown
If you consider content in White Rose Research Online to be in breach of UK law, please notify us by
Volatility co-movement between Bitcoin and Ether
Abstract: Using a bivariate Diagonal BEKK model, this paper investigates the volatility
dynamics of the two major cryptocurrencies, namely Bitcoin and Ether. We find evidence of interdependencies in the cryptocurrency market, while it is shown that the two cryptocurrencies' conditional volatility and correlation are responsive to major news. In
addition, we show that Ether can be an e ective hedge against Bitcoin, while the analysis of
optimal portfolio weights indicates that Bitcoin should outweigh Ether. Understanding
volatility movements and interdependencies in cryptocurrency markets is important for appropriate investment management, and our study can thus assist cryptocurrency users in making more informed decisions.
Keywords: Bitcoin, Ether, Cryptocurrency, Diagonal BEKK, Multivariate GARCH,
Conditional volatility
1 Introduction
Cryptocurrency markets have recently received a lot of attention from the media and investors alike. Bitcoin is undoubtedly the most popular cryptocurrency with an estimated market capitalisation currently being worth $167 billion (coinmarketcap.com accessed on 12th March
2018). Since its introduction in 2009, cryptocurrency markets have rapidly grown with a total of more than 1550 existing cryptocurrencies (as of 12th March 2018). Despite its relatively
recent launch, Ether constitutes the second largest cryptocurrency in terms of market capitalisation, which is currently estimated at $72 billion (coinmarketcap.com accessed on 12th March 2018)1. Bitcoin and Ether together represented 60% of the total estimated
cryptocurrency market capitalisation at the time of writing. Although the two cryptocurrencies have several fundamental differences in purpose and capability, both of them have recently
seen gigantic price fluctuations and are increasingly used for investment and speculation purposes, despite warnings issued by different financial institutions.
Recently the literature on cryptocurrencies has rapidly emerged. For instance, recent studies
have examined the hedging capabilities of Bitcoin against other assets (Dyhrberg 2016a, 2016b; Baur et al., 2017; Bouri et al., 2017), the market efficiency of cryptocurrencies
(Urquhart, 2016; Nadarajah and Chu, 2017), and the existence of bubbles in cryptocurrencies (Cheah and Fry, 2015; Corbet et al., 2017), while the price volatility of cryptocurrencies has been studied by Katsiampa (2017) and Phillip et al. (2018), among others. More recently, the
literature has started examining the connectedness of cryptocurrencies to mainstream assets. For instance, Corbet et al. (2018) and Lee et al. (2018) studied linkages of cryptocurrencies to
traditional assets and found that cryptocurrencies are rather isolated from other markets and that correlations between cryptocurrencies and other assets are low. Nevertheless, the literature
1Due to Ether's fast growth and the fact that several industry giants have backed Ethereum, the network behind
on interdependencies within cryptocurrency markets is rather limited. To the best of the
author's knowledge, only Ciaian et al. (2017) and Corbet et al. (2018) have studied interlinkages of cryptocurrencies. More specifically, Ciaian et al. (2017) studied interdependencies between Bitcoin and other cryptocurrencies using an Autoregressive Distributed Lag model and found
that the prices of Bitcoin and other cryptocurrencies, such as Ether, are interdependent. However, the authors did not study cryptocurrencies' volatility co-movements. On the other
hand, Corbet et al. (2018) studied interlinkages between cryptocurrencies using a Dynamic Conditional Correlation model and similarly found that cryptocurrencies are interconnected with each other. Nevertheless, the authors considered only Bitcoin, Ripple and Litecoin,
excluding Ether, though.
As investors in cryptocurrencies are exposed to highly undifferentiated risks (Gkillas and
Katsiampa, 2018), examination of cryptocurrency price volatility co-movements is of utmost importance in order for investors and other market participants to better understand interlinkages within the cryptocurrency market and make more informed decisions, and
multivariate GARCH models are useful tools for analysing such interdependencies between heteroskedastic time series. Nonetheless, volatility dynamics between Bitcoin and Ether have
not been previously explored. Consequently, motivated by the Bitcoin and Ether price fluctuations and the interconnectedness of cryptocurrency markets, by employing a bivariate GARCH model, this study aims to investigate not only the volatility dynamics of Bitcoin and
Ether but also their conditional covariance and correlation, examining which important events have led to unprecedented conditional volatility and covariance levels. We also study the
2 Data and methodology
The dataset consists of daily closing prices for Bitcoin and Ether from 7th August 2015 (as the earliest date available for Ether) to 15th January 2018. The prices are listed in US Dollars and the data are publicly available online at https://coinmarketcap.com/coins/. The returns are
defined as
ln ln , (1)
where is the logarithmic price change for cryptocurrency , , and is the
corresponding price on day .
Our empirical analysis begins with producing descriptive statistics for the Bitcoin and Ether price returns. We then perform the Augmented Dickey-Fuller and Phillips-Perron unit-root tests as well as Engle's ARCH-LM test for ARCH effects in order to examine the stationarity
of the returns series and whether volatility modelling is required for the price returns of the two cryptocurrencies considered in this study. As shown in section four, the results suggest that the
price returns of both cryptocurrencies are stationary but exhibit volatility clustering. Consequently, a bivariate GARCH model can be employed in order to model the conditional variances and covariance of the two cryptocurrencies.
3 Model
The conditional mean equation of the two cryptocurrencies' price returns is given as
, (2)
where is the vector of the price returns as defined in the previous section, is the residual
vector with a conditional covariance matrix given the available information set , and
is the vector of parameters that estimates the mean of the return series2. All the three
2It is worth mentioning that in this study a simple specification for the conditional mean equation is employed
components of the mean equation are 2×1 vectors since here the focus is on the two major
cryptocurrencies, namely Bitcoin and Ether.
A popular model of conditional covariances is the BEKK model (Engle and Kroner, 1995), the covariance matrix of which is given as
, (3)
where , and are matrices of parameters with appropriate dimensions, with being an
upper triangular matrix, while the diagonal elements of , , and are restricted to be positive
(Bekiros, 2014). The diagonal elements of , , , represent the conditional variance
terms, while the off-diagonal elements of , , , , represent the conditional
covariances. Once the BEKK model parameters are estimated, the conditional correlations can be derived as
(4)
and the BEKK model thus accommodates dynamic conditional correlations as opposed to the
Constant Conditional Correlations model. The BEKK model is also viewed as an improvement to the VECH model, as the number of parameters to be estimated is reduced and the positive
definiteness of is ensured provided that WW is positive definite (Terrell and Fomby, 2006),
and to the Dynamic Conditional Correlation model (Boldanov et al., 2016), since consistency
and asymptotic normality of the estimated parameters of the latter model have not yet been established (Caporin and McAleer, 2012).
However, the parameters of the BEKK model cannot be easily interpreted, and their net effects
on the future variances and covariances cannot be easily observed (Tse and Tsui, 2002). Moreover, the BEKK model is problematic with regards to the existence of its underlying
parameter matrices A and B are diagonal and therefore their off-diagonal elements are all equal
to zero. Consequently, under the Diagonal BEKK model, the number of parameters is considerably decreased while maintaining the positive definiteness of (Terrell and Fomby,
2006). Furthermore, the QMLE of the parameters of the Diagonal BEKK model are consistent and asymptotically normal, and hence statistical inference on testing hypotheses is valid (Allen
and McAleer, 2017).
For comparison purposes, next the bivariate forms of both models are presented. The
unrestricted BEKK model in bivariate form is written as
Hence, we have that
.
As none of the above single equations solely possesses its own parameters, interpretation of the parameters could be misleading even in the case of only two time series (Terrell and Fomby, 2006). On the other hand, the bivariate form of the Diagonal BEKK model is given by
,
It can be easily noticed that in the case of the Diagonal BEKK model the number of parameters
to be estimated is significantly reduced. Therefore, in this study, the Diagonal BEKK model is employed in order to investigate volatility dynamics between Bitcoin and Ether. The model parameters are estimated by the maximum likelihood approach under the multivariate normal
and multivariate Student's t error distributions using the BFGS algorithm. The dynamic conditional correlation between Bitcoin and Ether is then calculated as
, (5)
where is the conditional variance of Bitcoin, is the conditional variance of Ether,
and is their conditional covariance.
The optimal portfolio weights are also constructed, subject to a no-shorting constrain, following Kroner and Ng (1998). The optimal weight of Bitcoin in a one-dollar portfolio
consisting only of Bitcoin and Ether is
, if . (6)
Finally, following Dey and Sampath (2018), the dynamic long/short hedge ratio between
Bitcoin and Ether is constructed as
. (7)
4 Results
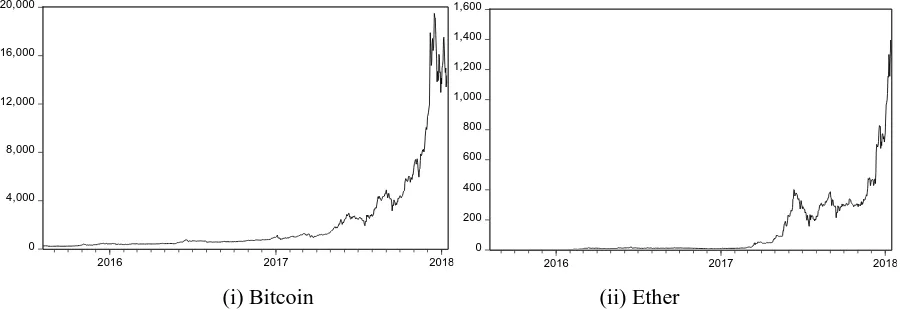
Figure 1 illustrates the prices of Bitcoin and Ether. It can be noticed that although the prices of both cryptocurrencies would increase slowly until the beginning of 2017, there was
considerable price appreciation from the second quarter of 2017 onwards, increasing the opportunities for investment and speculation. This indicates that the two cryptocurrencies seem
which measures the linear correlation between Bitcoin and Ether price returns is positive and
equal to 0.2507, and significantly different from zero at any conventional level3.
[image:9.595.72.522.156.311.2](i) Bitcoin (ii) Ether
Fig. 1 Daily closing prices of Bitcoin and Ether (in US Dollars).
Table 1 (Panel A) presents descriptive statistics for the price returns of the two cryptocurrencies. The average price returns are positive for both Bitcoin and Ether and equal
to 0.4373% and 0.6889% with a standard deviation of 3.9092% and 8.5037%, respectively. Furthermore, the price returns of both cryptocurrencies are leptokurtic as a result of significant excess kurtosis - with Bitcoin exhibiting smaller kurtosis than Ether - and negatively skewed
suggesting that it is more likely to observe large negative returns. Moreover, the Jarque-Bera test results confirm the departure from normality, while the test results for conditional
heteroskedasticity suggest that ARCH effects are present in the price returns of both cryptocurrencies. We can thus proceed with bivariate GARCH modelling to model the conditional variances and covariance of the price returns of Bitcoin and Ether. Furthermore,
the results of both unit root tests (Table 1, Panel B) suggest that stationarity is ensured. Consequently, the Bitcoin and Ether price returns are appropriate for further analysis.
3 The Spearman rank-order correlation coefficient, which is a nonparametric measure of correlation, was also
found positive and significantly different from zero at all the conventional levels, but equal to 0.1985.
0 4,000 8,000 12,000 16,000 20,000
2016 2017 2018
0 200 400 600 800 1,000 1,200 1,400 1,600
Table 1 Descriptive statistics and unit roots tests for the price returns.
Note: *** significant at the 1% level.
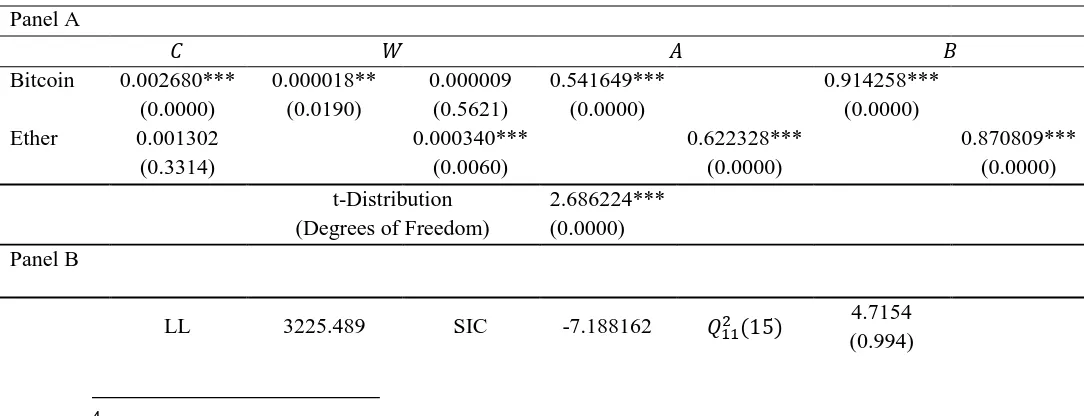
The estimation results of the Diagonal BEKK model under the multivariate normal and multivariate Student's t error distributions are reported in Tables 2 and 3, respectively. It can
be noticed that in comparison with the results obtained under the multivariate normal distribution, the log-likelihood value is increased and the values of all the three information criteria used in this study (Akaike, Schwarz, and Hannan–Quinn) are decreased under the
multivariate Student's t error distribution. The estimated model under the multivariate Student's t error distribution is thus preferred. We notice that the estimated value of the GARCH
coefficient, in particular, is equal to 0.8359 and 0.7583 for Bitcoin and Ether, respectively, indicating a relatively high degree of volatility persistence for both cryptocurrencies, with
higher volatility persistence displayed in the Bitcoin market, though. Moreover, the ARCH and GARCH coefficients are highly significant for both cryptocurrencies. The significance of the estimated ARCH coefficients suggests that news/shocks in Bitcoin (Ether) are of great
importance for Bitcoin's (Ether's) future volatility, while the significance of the estimated GARCH coefficients indicates that the persistence of shocks also affects the two
Bitcoin Ether Panel A: Descriptive statistics
Observations 892 892
Mean 0.004373 0.006889
Median 0.003306 0.000000
Maximum 0.225119 0.412337
Minimum -0.207530 -1.302106 Std. Dev. 0.039092 0.085037 Skewness -0.114590 -3.694999
Kurtosis 8.910433 67.17186
JB 1300.303*** 155083.1***
ARCH(1) 48.84901*** 40.73491*** ARCH(5) 61.68204*** 90.48128*** Panel B: Unit root test statistics
cryptocurrencies' future volatility. Similar results are obtained for the two cryptocurrencies'
[image:11.595.25.573.201.366.2]conditional covariance which is significantly affected by cross products of previous news/shocks and previous covariance terms4.
Table 2 Diagonal BEKK model parameter estimates under multivariate normal error distribution.
Panel A
Bitcoin 0.002796*** (0.0005) 0.000025*** (0.0000) 0.000016*** (0.0036) 0.407807*** (0.0000) 0.920444*** (0.0000) Ether 0.003900**
(0.0279) 0.000234*** (0.0000) 0.467085*** (0.0000) 0.873196*** (0.0000) Panel B
LL 3014.193 SIC -6.719916 5.2398 (0.990)
AIC -6.768452 HQ -6.749899 12.014 (0.678)
Notes: ** and *** indicate significance at the 5% and 1% levels, respectively. The p-values are presented in brackets. and are the Ljung-Box portmanteau test statistics for serial correlation in the univariate squared standardised residuals of Bitcoin and Ether, respectively.
Conditional variance equations with substituted coefficients:
Table 3 Diagonal BEKK model parameter estimates under multivariate Student's t error distribution.
Panel A
Bitcoin 0.002680*** (0.0000) 0.000018** (0.0190) 0.000009 (0.5621) 0.541649*** (0.0000) 0.914258*** (0.0000) Ether 0.001302
(0.3314) 0.000340*** (0.0060) 0.622328*** (0.0000) 0.870809*** (0.0000) t-Distribution
(Degrees of Freedom)
2.686224*** (0.0000) Panel B
LL 3225.489 SIC -7.188162 4.7154 (0.994)
4It is also worth mentioning that an asymmetric Diagonal BEKK model under the multivariate Student's t error
[image:11.595.26.568.517.725.2]AIC -7.242092 HQ -7.221477 12.317 (0.655)
Notes: ** and *** indicate significance at the 5% and 1% levels, respectively. The p-values are presented in brackets. and are the Ljung-Box portmanteau test statistics for serial correlation in the univariate squared standardised residuals of Bitcoin and Ether, respectively.
Conditional variance equations with substituted coefficients:
The plots of the conditional variances and covariance as well as the plot of the conditional
correlations of the price returns of Bitcoin and Ether when using the Diagonal BEKK model under the multivariate Student's t error distribution are depicted in Figures 2 and 3. It can be
noticed from Figure 2 that overall Ether exhibits higher conditional volatility than Bitcoin. Moreover, from the evolution of the conditional volatility of Bitcoin, there are few distinct episodes in 2017 that emerge from the plot, where the Bitcoin conditional volatility series has
reached unprecedented levels. More specifically, three important spikes which seem to be related to the effects of the Bitcoin hard fork, China banning Bitcoin trading, and the
announcement of the CME Group Inc. to launch Bitcoin futures, taking place in July, September, and December 2017, respectively, are observed. On the other hand, for the Ether price volatility, we observe two distinct spikes around June 2016 and February 2017, which
seem to be associated with the effects of the Ether hard fork and the formation of the Enterprise Ethereum Alliance, respectively. Furthermore, the conditional covariance between the two
cryptocurrencies, which measures the association between Bitcoin and Ether, is time-varying and mostly positive, while the highest peak in the conditional covariance of the two cryptocurrencies is observed in September 2017 and can be associated with China banning
although positive correlations mostly prevail. More specifically, Figure 3 shows that the
[image:13.595.109.479.177.468.2]conditional correlation between the price returns of Bitcoin and Ether ranges from -0.70 to 0.96, suggesting that checking the unconditional correlation only is not adequate.
Fig. 2 Conditional Variances and Covariance
Fig. 3 Conditional Correlations
[image:13.595.169.428.511.678.2]hedge ratio between Bitcoin and Ether is 0.42, suggesting that a $1 long position in Bitcoin can
[image:14.595.185.412.228.311.2]be hedged for 42 cents with a short position in Ether. In addition, the average optimal weight for the Bitcoin/Ether portfolio is 0.82, suggesting that for a $1 portfolio, 82 cents should be invested in Bitcoin and 18 cents should be invested in Ether on average.5
Table 5 Hedge ratio and portfolio weight.
Mean Panel A: Hedge ratio
Bitcoin/Ether 0.423314 Panel B: Portfolio weight
Bitcoin/Ether 0.816894
5 Conclusions
By employing a bivariate Diagonal BEKK model, this study investigated the volatility
dynamics of the two largest cryptocurrencies in terms of market capitalisation, namely Bitcoin and Ether. It was found that the price returns of both cryptocurrencies are heteroskedastic, a finding which is consistent with previous studies, and that news/shocks about the two
cryptocurrencies as well as their persistence are of great importance for the two cryptocurrencies' future volatility, while the estimated model under the multivariate Student's
t error distribution is preferred. It was also found that the two cryptocurrencies' volatility is responsive to major news. Furthermore, the bivariate framework has helped us examine not only the two cryptocurrencies' individual conditional variances but also the movements of their
conditional covariance and correlation. More specifically, the two cryptocurrencies' conditional covariance was found to be significantly affected by both cross products of
previous news/shocks and previous covariance terms, a result that supports the findings of
5It should be noticed that the selection of models affects the estimated hedge ratios and optimal portfolio weights
previous studies on the interconnectedness of cryptocurrencies. It was also shown that
time-varying conditional correlations between Bitcoin and Ether exist and fluctuate in both positive and negative regions, although positive correlations prevail, while the highest correlation was observed in September 2017 when China banned digital currency trading. Finally, it was shown
that Ether can be an e ective hedge against Bitcoin, while the analysis of optimal portfolio
weights suggested that Bitcoin should outweigh Ether.
References
Allen, D., & McAleer, M. (2017). Theoretical and Empirical Differences Between Diagonal and Full
BEKK for Risk Management (No. 17-069/III). Tinbergen Institute.
Baur, D. G., Dimpfl, T., & Kuck, K. (2017). Bitcoin, gold and the US dollar–A replication and
extension. Finance Research Letters.
Bekiros, S. D. (2014). Contagion, decoupling and the spillover effects of the US financial crisis:
Evidence from the BRIC markets. International Review of Financial Analysis, 33, 58-69.
Boldanov, R., Degiannakis, S., & Filis, G. (2016). Time-varying correlation between oil and stock
market volatilities: Evidence from oil-importing and oil-exporting countries. International Review
of Financial Analysis, 48, 209-220.
Bouri, E., Molnár, P., Azzi, G., Roubaud, D., Hagfors, L. I. (2017). On the hedge and safe haven
properties of Bitcoin: Is it really more than a diversifier?. Finance Research Letters, 20, 192-198.
Caporin, M., & McAleer, M. (2012). Do we really need both BEKK and DCC? A tale of two
multivariate GARCH models. Journal of Economic Surveys, 26(4), pp.736-751.
Cheah, E. T., & Fry, J. (2015). Speculative bubbles in Bitcoin markets? An empirical investigation into
the fundamental value of Bitcoin. Economics Letters, 130, 32-36.
Ciaian, P., Rajcaniova, M., & Kancs, d. (2017). Virtual Relationships: Short- and Long-run Evidence
from BitCoin and Altcoin Markets. Journal of International Financial Markets, Institutions &
Money, 52, 173-195.
Corbet, S., Lucey, B., & Yarovya, L. (2017). Datestamping the Bitcoin and Ethereum bubbles. Finance
Research Letters.
Corbet, S., Meegan, A., Larkin, C., Lucey, B., & Yarovaya, L. (2018). Exploring the dynamic
relationships between cryptocurrencies and other financial assets. Economics Letters, 165, 28-34.
Dey, S., & Sampath, A. (2018). Dynamic linkages between gold and equity prices: Evidence from
Indian financial services and information technology companies. Finance Research Letters, 25,
Dyhrberg, A. H. (2016a). Bitcoin, gold and the dollar–A GARCH volatility analysis. Finance Research
Letters, 16, 85-92.
Dyhrberg, A. H. (2016b). Hedging capabilities of bitcoin. Is it the virtual gold?. Finance Research
Letters, 16, 139-144.
Engle, R. F., & Kroner, K. F. (1995). Multivariate simultaneous generalized ARCH. Econometric
Theory, 11(1), 122-150.
Gkillas, K., & Katsiampa, P. (2018). An application of extreme value theory to
cryptocurrencies. Economics Letters, 164, 109-111.
Katsiampa, P. (2017). Volatility estimation for Bitcoin: A comparison of GARCH models. Economics
Letters, 158, 3-6.
Kroner, K. F., & Ng, V. K. (1998). Modeling asymmetric comovements of asset returns. The review of
financial studies, 11(4), 817-844.
Ledoit, O., Santa-Clara, P., & Wolf, M. (2003). Flexible multivariate GARCH modeling with an
application to international stock markets. The Review of Economics and Statistics, 85(3), 735-747.
Lee, D. K. C., Guo, L., & Wang, Y. (2018). Cryptocurrency: A New Investment Opportunity?. The
Journal of Alternative Investments, 20(3), 16-40.
Nadarajah, S., & Chu, J. (2017). On the inefficiency of Bitcoin. Economics Letters, 150, 6-9.
Phillip, A., Chan, J., & Peiris, S. (2018). A new look at Cryptocurrencies. Economics Letters, 163, 6-9.
Terrell, D., & Fomby, T. B. (2006). Econometric analysis of financial and economic time series.
Emerald Group Publishing.
Tse, Y. K., & Tsui, A. K. C. (2002). A multivariate generalized autoregressive conditional
heteroscedasticity model with time-varying correlations. Journal of Business & Economic
Statistics, 20(3), 351-362.