The binary millisecond pulsar PSR J1023
+
0038 during its accretion
state – I. Optical variability
T. Shahbaz,
1,2‹M. Linares,
1,2‹S. P. Nevado,
1,2P. Rodr´ıguez-Gil,
1,2J. Casares,
1,2V. S. Dhillon,
1,2,3T. R. Marsh,
4S. Littlefair,
3A. Leckngam
5and S. Poshyachinda
5 1Instituto de Astrof´ısica de Canarias (IAC), E-38200 La Laguna, Tenerife, Spain2Dept. Astrof´ısica Universidad de La Laguna (ULL), E-38206 La Laguna, Tenerife, Spain 3Department of Physics and Astronomy, University of Sheffield, Sheffield S3 7RH, UK 4Department of Physics, University of Warwick, Coventry CV4 7AL, UK
5National Astronomical Research Institute of Thailand, 191 Siriphanich Building, Huay Kaew Road, Chiang Mai 50200, Thailand
Accepted 2015 July 23. Received 2015 July 23; in original form 2015 February 3
A B S T R A C T
We present time-resolved optical photometry of the binary millisecond ‘redback’ pulsar PSR J1023+0038 (=AY Sex) during its low-mass X-ray binary phase. The light curves taken between 2014 January and April show an underlying sinusoidal modulation due to the irradiated secondary star and accretion disc. We also observe superimposed rapid flaring on time-scales as short as∼20 s with amplitudes of∼0.1–0.5 mag and additional large flare events on time-scales of∼5–60 min with amplitudes of∼0.5–1.0 mag. The power density spectrum of the optical flare light curves is dominated by a red-noise component, typical of aperiodic activity in X-ray binaries. Simultaneous X-ray and UV observations by the Swiftsatellite reveal strong correlations that are consistent with X-ray reprocessing of the UV light, most likely in the outer regions of the accretion disc. On some nights we also observe sharp-edged, rectangular, flat-bottomed dips randomly distributed in orbital phase, with a median duration of∼250 s and a median ingress/egress time of∼20 s. These rectangular dips are similar to the mode-switching behaviour between disc ‘active’ and ‘passive’ luminosity states, observed in the X-ray light curves of other redback millisecond pulsars. This is the first time that the optical analogue of the X-ray mode-switching has been observed. The properties of the passive- and active-state light curves can be explained in terms of clumpy accretion from a trapped inner accretion disc near the corotation radius, resulting in rectangular, flat-bottomed optical and X-ray light curves.
Key words: binaries: close – stars: fundamental parameters – stars: individual: PSR J1023+0038 – stars: neutron – X-rays: binaries.
1 I N T R O D U C T I O N
The Galactic source PSR J1023+0038 (=AY Sex) was discovered by Bond et al. (2002). It was initially classified as a magnetic cataclysmic variable, but subsequent radio studies revealed the true nature of the compact object, with the discovery of 1.69 ms radio pulsations, establishing without a doubt that the compact object was a rotation-powered millisecond pulsar (Archibald et al.2009).
Millisecond pulsars are formed in X-ray binaries by accreting gas from a low-mass companion star (Alpar et al.1982). The discovery of accreting millisecond X-ray pulsars (Wijnands & van der Klis
1998; Patruno & Watts2012) represented a confirmation of this
E-mail:[email protected](TS);[email protected](ML)
‘recycling’ scenario for the long-suspected evolutionary connection between low-mass X-ray binaries and rotation-powered recycled millisecond pulsars. The accreted matter spins up the neutron star to millisecond periods, but how and when the accretion process turns off remains unknown (see Tauris2012). PSR J1023+0038 has been heralded as the ‘missing link’ between radio millisecond pulsars and low-mass X-ray binaries and has given new insights into this evolutionary process.
In 2001 strong evidence for the presence of an accretion disc in PSR J1023+0038 was provided by optical observations of double-peaked emission lines, accompanied by short-time-scale flicker-ing and a blue optical spectrum (Bond et al.2002; Szkody et al.
an accreting neutron star in a low-mass X-ray binary. Optical spectra taken in 2003/2004 showed only the absorption lines from the sec-ondary star with no detectable emission lines and the radial velocity of the late-type G5 companion star was found to be modulated on the 4.754 h orbital period (Porb; Thorstensen & Armstrong2005). Optical light curves taken in 2004 revealed a single humped mod-ulation which can be explained in terms of an X-ray heated optical light curve (Thorstensen & Armstrong2005). Between 2001 and 2007 radio pulsations were found (Archibald et al.2009) and until 2013 it has been consistently observed as an eclipsing radio mil-lisecond pulsar, where the radio eclipses are attributed to ionized material in the companion’s magnetosphere (Archibald et al.2013). Given the∼0.2 Msecondary star, PSR J1023+0038 is known as a ‘redback’ system (Roberts2011), with a lower X-ray luminosity in the ‘pulsar state’ due to a pulsar-wind-driven shock near the inner Lagrangian point (Bogdanov et al.2011).
Since 2013 June, PSR J1023+0038 switched off as a radio pul-sar (Stappers et al.2013; Patruno et al.2014) and when solar con-straints were overcome, optical spectroscopy in mid-October re-vealed strong double-peaked Hαemission indicating that an accre-tion disc had re-formed (Halpern et al.2013; Linares et al.2014b). Moreover, observations showed that the X-ray emission had in-creased by a factor of at least 20 compared to previous quiescent values (Kong2013) and the UV emission had brightened by 4 mag (Patruno et al. 2014), with no detection of radio pulsations. All these factors provide compelling evidence for the presence of a re-cently formed accretion disc, indicating that PSR J1023+0038 has switched back from a radio millisecond pulsar to a low-mass X-ray binary. The X-ray light curves during the accretion phase show rect-angular flat-bottomed dips (Tendulkar et al.2014) that are similar to the mode-switching behaviour between disc ‘active’ and ‘passive’ luminosity states observed in other redback binary pulsars (Linares
2014). Coti Zelati et al. (2014) determined the near-infrared to the X-ray spectral energy distribution and find that it is well represented by a model consisting of an irradiated companion, an accretion disc and intrabinary shock emission. The authors suggest a scenario in terms of an engulfed radio pulsar which is still active, but is un-detectable at radio wavelengths due to a large amount of ionized material surrounding the compact object, material which is however not enough to totally quench the radio pulsar.
In this paper we report on long-term and high time resolution optical photometry obtained during the accretion disc/radio-quiet phase of PSR J1023+0038 in 2014. In a following paper we will present the result of the spectroscopic campaign (Linares et al., in preparation).
2 O P T I C A L O B S E RVAT I O N S A N D DATA R E D U C T I O N
A total of 24 time-resolved optical light curves of PSR J1023+0038 were obtained using four telescopes; the 0.8-m IAC80 telescope (Tenerife, Spain), the 2.4-m Thai National Telescope (TNT; Thai National Observatory, Thailand), the 2.5-m Isaac Newton Telescope (INT; La Palma, Spain) and the 4.2-m William Herschel Telescope (WHT; La Palma, Spain), during the period 2014 January to April. Conventional CCD optical light curves of PSR J1023+0038 were obtained with the IAC80+CAMELOT and the INT+WFC with plate scales of 0.30 and 0.33 arcsec pixel−1, respectively. The
ob-serving conditions were variable with seeing ranging from 1 to 2 arcsec. The exposure times used ranged from 10 to 60 s with therorRfilter depending on availability. For the WFC data the CCD was windowed to decrease the read-out time. Bias images
and flat-fields were also taken. We usedIRAF1for our data
reduc-tion, which included bias subtraction images and flat-fielding. The
VAOPHOTsoftware (Deeg & Doyle2001) was used to obtain
differen-tial light curves for PSR J1023+0038 and several comparison stars by extracting the counts using variable aperture photometry which scaled with the seeing. High time resolution light curves were ob-tained at the TNT with ULTRASPEC (Dhillon et al.2014) and at the WHT with ULTRACAM (Dhillon et al.2007). ULTRASPEC has an electron multiplier frame-transfer CCD with a pixel scale of 0.45 arcsec pixel−1and allows for single-band, high-speed
imag-ing. ULTRACAM has three frame-transfer CCDs with a pixel scale of 0.3 arcsec pixel−1, allowing one to obtain simultaneous blue-,
green- and red-band high-speed images. Due to the frame-transfer architecture of the CCDs, the dead-time is essentially zero with ULTRACAM and ULTRASPEC. With ULTRASPEC we obtained
r-band images with exposure times of 0.96 and 3.35 s, with a typi-cal photometric accuracy of 4.9 and 6.7 per cent, respectively. With ULTRACAM we obtained simultaneousu-,g- andr-band images with an exposure time of 0.28 s ingandrand 1.53 s inu, with a typical photometric accuracy of 6.0, 7.0 and 5.1 per cent, respec-tively. The ULTRACAM pipeline reduction software was used to de-bias and flat-field the data. The same pipeline was also used to obtain light curves for PSR J1023+0038 and several compari-son stars by extracting the counts using aperture photometry with variable apertures that scaled with the seeing.
For all of the data, calibrated magnitudes of the target with re-spect to a bright local standard SDSS J102343.30+003819.1 (u=
16.810,g =15.676,r=14.773 andi =14.952) were then de-termined. We checked that the local standard was not variable by comparing it to other bright stars in the field. For the data taken with theRfilter, we used the SDSS transformations2to transform ther
magnitude of the local standard toR. We checked the transformation by using the IAC80Rand WHTrlight curves taken on March 26, which overlapped in time. We binned the light curves to the same time resolution and found both light curves to match with an offset of less than 2 per cent. As a check of the photometry and system-atics in the reduction procedure, we also extracted light curves of a comparison star of similar brightness to PSR J1023+0038, which showed no significant variability above what is expected from pho-ton statistics.
3 O P T I C A L L I G H T C U RV E S
We determined the colour excess by using the empirical relation between the colour excess and the total column density of hy-drogenNH (Predehl & Schmitt1995). Using the observed value forNH = 5.2×1020cm−2 (Coti Zelati et al.2014) and the
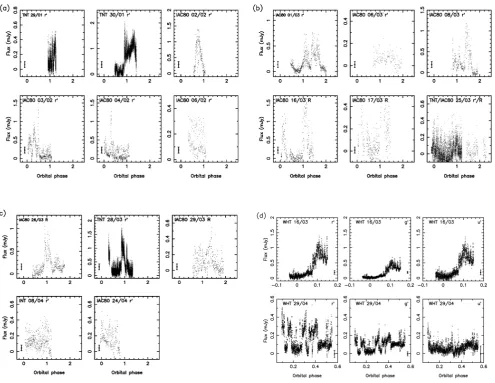
ra-tioAV/E(B − V) =3.1 (Cardelli, Clayton & Mathis 1989), we obtain a colour excess ofE(B−V)=0.073. Fig.1shows the de-reddened flux IAC80, INT, TNT and WHT light curves where we have used the colour excess determined above and then converted the magnitudes to flux density using the appropriate zero-point for each band. We have also phase folded the data using the ephemeris
Porb=0.198 096 3569 d andT0=2456642.6335 HJD (Archibald et al.2009; Linares et al., in preparation), where phase 0.0 is defined as inferior conjunction of the secondary star.
1
IRAFis distributed by the National Optical Astronomy Observatory, which is operated by the Association of Universities for Research in Astronomy, Inc., under cooperative agreement with the National Science Foundation:
http://iraf.noao.edu/.
Figure 1. Observed optical light curves of PSR J1023+0038 taken with the IAC80, INT and TNT (a–c) and the WHT (d). The light curves have been phase-folded using the ephemeris given in Section 3; phase 0.0 is defined as inferior conjunction of the secondary star. The day/month and filter are also given in each panel. The solid line is a sinusoidal modulation (the secondary star’s ellipsoidal modulation plus heated star and accretion disc) scaled to fit the lower envelope (see Section 3).
3.1 Flaring activity
The light curves show dramatic variations from night to night su-perimposed on an underlying sinusoidal modulation, which is due to a combination of the secondary star’s ellipsoidal modulation and it’s heated inner face (Thorstensen & Armstrong2005). On some nights there is additional rapid flaring (February 6, March 25, April 8) and on other nights there are further additional large flare events (January 1, February 4, March 8). In order to isolate the flaring ac-tivity (by removing the shape of the secondary star’s modulation), we subtract a scaled version of the underlying sinusoidal modula-tion, defined by fitting the lower envelope of the light curve taken on March 17 with a sine wave. The March 17 light curve was chosen because it clearly showed the sinusoidal modulation with little flar-ing behaviour. Fig.2shows the de-reddened and de-trended IAC80, INT, TNT and WHT flare light curves.
Fig.3shows the flares on February 6, March 25 and April 8. The variability represents genuine variations of the target. Noticeable from the IAC80 and INT data are numerous rapid flare events that are not resolved. The TNT March 25 data were taken with ULTRA-SPEC and so have a much higher time resolution than the IAC80
and INT data (see Table1) and so the flares are better resolved. In order to directly compare the light curves, the March 25 data were re-binned to the same time resolution as the other data. The subsequent light curves obtained are very similar and hence we can conclude that the IAC80 and INT data do not resolve the rapid flares. The TNT data show rapid flare events on time-scales of∼minutes with amplitudes of∼0.1–0.5 mag (see Fig.4). Large flare events on time-scales of∼5–60 min with amplitudes of∼0.5–1.0 mag are also seen (e.g. February 2, March 1) superimposed on the rapid flare events. In Table3, we give the fractional root mean square (rms) of the variability, determined after binning the light curves to the same time resolution of 60 s.
3.2 Rectangular dips
Figure 2. The de-reddened and de-trended optical light curves of PSR J1023+0038, obtained by subtracting a fit to the lower envelope of the light curves shown in Fig.1. (a–c) and (d) show the data taken with the IAC80, INT, TNT and the WHT, respectively. The filled circle marks the typical uncertainty in the data. The date day/month and filter are also given in each panel.
and active state) that have been observed in the X-ray light curves of PSR J1023+0038 (Tendulkar et al.2014) and other X-ray binary pulsar (see Linares2014, and references therein). The histogram of the flux values (using the flare light curves described in Section 3 with the mean de-reddened flux added to preserve the flux values) clearly show a bimodal distribution between the passive and active states (see Fig.4).
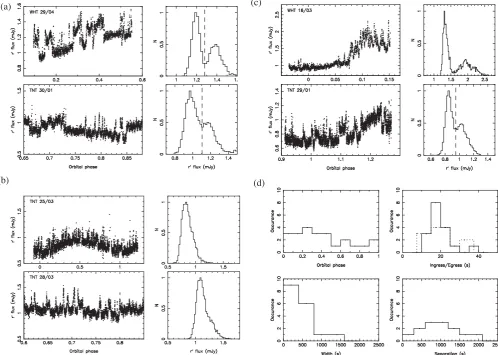
In total we identify 16 rectangular dips in the January 29, 30 and April 29 light curves. In order to estimate the properties of these dips, we fit each feature with a rectangular function, allowing us to determine the ingress, egress, duration and centre of the dip segment. We find that the dips are generally symmetrical with ingress and egress times in the range 12–35 s (median of∼20 s), a dip duration in the range 80–1300 s (median of ∼250 s) and a dip separation in the range 200–1900 s (median of ∼900 s). We also compute histograms of the observed dip phase, the duration of the dips and the separation between consecutive dips (see Fig.4); however, the low number of dips observed implies that we cannot comment on the statistical properties of the dips with confidence. In Fig.5, we show a zoom of a typical rectangular dip feature observed on April 29 with ULTRACAM. The feature is flat-bottomed with an increase in thefu/fg andfg/frcolour ratios during the dip, i.e. the dips
become more blue. We also show the colour–magnitude diagram of the whole light curve. The increase in colour ratio during the dips is clearly seen.
4 X - R AY / U LT R AV I O L E T L I G H T C U RV E S
We analysed allSwiftobservations of PSR J1023+0038 in the on-going accretion phase, taken between 2013 October 18 and 2014 June 11, including data from both the X-ray (XRT; Burrows et al.
2005) and UV/optical (UVOT; Roming et al.2005) telescopes. This amounts to 52 observations, an accumulated XRT exposure of 94 ks and a total of 84 UVOT images acquired in four different filters. Smaller sets ofSwiftobservations of PSR J1023+0038 have been analysed elsewhere (Coti Zelati et al.2014; Linares2014; Patruno et al.2014; Takata et al.2014). We used the quasi-simultaneous XRT/UVOT average flux per observation (which lasts typically between 1 and 3 ks), as we are interested in the long-term (weeks-months) X-ray-UV correlation. Because the UVOT filter configu-ration and total XRT exposure vary, each observation had UVOT data collected in one to three different filters.
Figure 3. The February 6 (bottom), March 25 (middle) and April 8 (top)
r-band de-reddened and de-trended light curves. The March 25 light curve taken with TNT+ULTRASPEC has been re-binned to the same time reso-lution as the IAC80 and INT light curves. The variability represents genuine variations of the target as indicated by the error bar plotted in the top right hand corner of each panel.
3 and 11, during which the count rate reaches∼0.6 counts s−1),
we used a 20-pixel radius extraction region and excluded the in-nermost pixels (within a 2-pixel radius) to avoid pile-up. The count rate during the remaining observations is<0.5 counts s−1(below
the PC pile-up threshold) and we used a 30 arcsec radius circular
extraction region. We subtracted the background using a nearby 60 arcsec radius source-free region, and grouped the source spectra to a minimum of 15 counts per channel. We created ancillary re-sponse files for each observation, applying the vignetting correction and using the corresponding exposure maps. After incorporating the latest XRT response matrices, we fitted each spectrum in the 0.5–10 keV band usingXSPEC(v. 12.7.1; Arnaud2006, except two
spectra which had less than 45 source counts and were not fitted). We used a power-law model corrected for absorption (withTBABS,
Wilms, Allen & McCray2000), fixing the column density at the value measured by Coti Zelati et al. (2014) from the average XRT spectrum (NH=5.2×1020cm−2). We calculated the 0.5–10 keV
X-ray luminosity from the unabsorbed flux in the same band using the distance of 1.37 kpc (Deller et al.2012).
After checking that the aspect correction was applied, we summed all extensions within each UVOT image mode file (using the
Swift FTOOL UVOTIMSUM, v. 1.6) to obtain one image per filter and observation. Because our ULTRACAM and ULTRASPEC data provide much better measurements of the fast optical vari-ability of PSR J1023+0038 (see Section 3), we do not include in this analysis UVOT high time resolution (event mode) data (Coti Zelati et al. 2014). We then performed aperture photome-try on each summed image using the standard 5-arcsec aperture radius, and a nearby source-free background region of 12 arcsec radius.
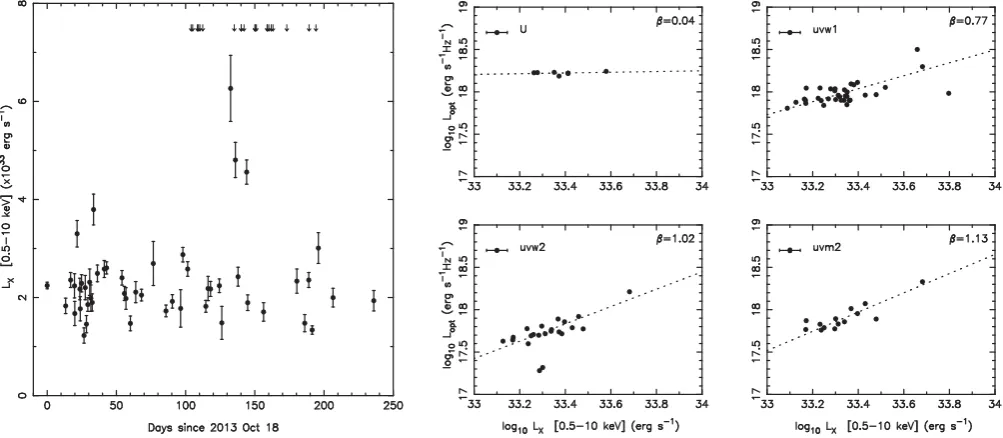
In Fig.6, we show theSwiftXRT 0.5–10 keV unabsorbed long-term X-ray light curve. The X-ray light curve shows considerable activity with an average luminosity ofLX∼2×1033erg s−1. To
search for possible X-ray/UV correlations in Fig.6we determine the simultaneous unabsorbed X-ray 0.5–10 keV and de-reddened
U,uvw1,uvm2 anduvw2-band observations. The UV data were de-reddened using the colour excess derived in Section 3. The X-ray anduvw1,uvm2 anduvw2-band data are clearly correlated, with a significance of>99 per cent. However, given that there are
Table 1. Log of optical observations. The mean observed magnitude is given in the final column. The difference between the exposure time and time resolution is due the readout time of the detector.
Telescope UTdate Start HJD−2450000 Duration (h) Exp time (s) Time res. (s) Filter Seeing (arcsec) Mag
TNT 2014-01-29 6687.18760 1.71 0.97 0.97 r 1.2 16.63
TNT 2014-01-30 6688.28886 4.51 0.97 0.97 r 1.3 16.16
IAC80 2014-02-02 6691.66953 2.53 15 30 r 1.4 16.31
IAC80 2014-02-03 6692.55923 5.02 15 30 r 1.5 16.38
IAC80 2014-02-04 6693.54567 5.24 15 30 r 1.4 16.61
IAC80 2014-02-06 6695.58626 4.15 20 47 r 1.9 16.79
IAC80 2014-03-01 6718.39729 7.43 15 30 r 1.7 16.77
IAC80 2014-03-06 6723.39929 6.06 30 149 r 1.7 16.80
IAC80 2014-03-08 6725.39641 5.37 30 45 r 1.9 16.56
WHT 2014-03-16 6733.35428 0.88 0.28 0.31 r 1.3 16.39
WHT 2014-03-16 6733.35428 0.88 0.28 0.31 g 1.5 17.40
WHT 2014-03-16 6733.35428 0.88 1.53 1.55 u 1.7 17.12
IAC80 2014-03-16 6733.36879 6.80 30 45 R 1.6 16.21
IAC80 2014-03-17 6734.38586 6.34 30 45 R 1.8 16.66
TNT 2014-03-25 6742.06245 6.19 3.37 3.37 r 1.0 16.60
IAC80 2014-03-25 6742.35805 4.15 30 45 R 2.7 16.52
IAC80 2014-03-26 6743.34121 6.60 30 45 R 1.8 16.34
TNT 2014-03-28 6745.10920 4.98 0.97 0.97 r 1.1 16.26
IAC80 2014-03-29 6746.35337 6.37 30 45 R 1.6 16.43
INT 2014-04-08 6756.35347 5.39 10 39 r 2.7 16.61
IAC80 2014-04-24 6772.37623 4.08 30 45 r 1.3 16.43
WHT 2014-04-29 6777.35771 2.17 0.28 0.31 r 1.0 16.40
WHT 2014-04-29 6777.35771 2.17 0.28 0.31 g 1.0 17.15
[image:5.595.82.514.469.734.2](a)
(b)
(c)
[image:6.595.46.545.61.416.2](d)
Figure 4. (a)–(c) The de-reddenedr-band light curves of PSR J1023+0038, taken with the TNT+ULTRASPEC and the WHT+ULTRACAM. The right-hand panel in each plot shows a histogram of the flux values after correcting for the secondary star’s trend. The mode-switching active- and passive-state behaviour is only observed in the January 29, 30 and April 29 light curves. The vertical dashed lines shown mark the cut-off flux value that defines the active flare and active passive, respectively. (d) Histograms of the observed rectangular mid-dip phase, ingress/egress times, duration and the separation between consecutive dips.
only seven points in the X-ray–Ucorrelation, the correlation is only significant at the 50 per cent level. We fit the X-ray/UV data with a power law of the formLν;UV∝LβXand determine the power-law index (see Table2).
5 O P T I C A L P OW E R D E N S I T Y S P E C T R U M
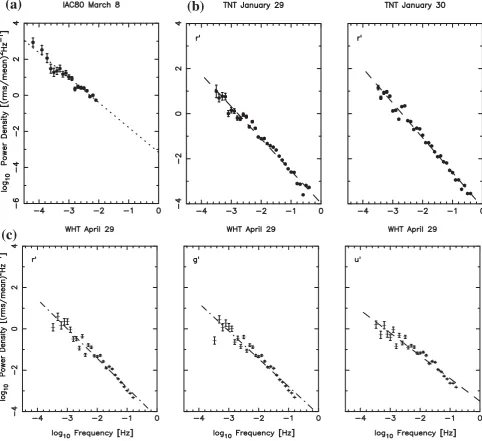
We compute the power density spectrum (PDS) of the de-reddened and trended light curves (see Section 3; with the mean de-reddened flux added to preserve the flux values) using the Lomb– Scargle method to compute the periodograms (Press et al. 1992) and the same normalization method as is commonly used in X-ray astronomy, where the power is normalized to the fractional rms amplitude per hertz (van der Klis1989). To compute the PDS we use the constraints imposed by the Nyquist frequency, the typical duration of each observation and use the recipe given in Horne & Baliunas (1986) to calculate the number of independent frequen-cies. We then bin and fit the PDS in logarithmic space (Papadakis & Lawrence1993) where the errors in each bin are determined from the standard deviation of the points within each bin. The white noise level is subtracted by fitting the highest frequencies (>300 Hz) with a white noise plus red-noise model. As an
exam-ple of the typical PDS, in Fig.7(a) we show the PDS of the light curve taken on March 8 and in Table3we give the power-law index obtained for each light curve. We find that the PDS of the flare light curves is dominated by a red-noise component with a median power-law index of−1.2, typical of aperiodic activity in X-ray bi-naries and X-ray transients in outburst and quiescence, which have a power-law index in the range−1.0 to−2.0 (Hynes et al.2003a,b; Shahbaz et al.2003, 2004, 2005,2010,2013; Zurita, Casares & Shahbaz2003).
Figure 5. Left: a close-up of the flat-bottomed dip features observed in the April 29 WHT light curve. We show the de-reddenedrand the flux ratiofu/fg
andfg/frlight curves. Notice the increase in the blue colour during the dips. The error bar marks the typical uncertainty in the data. Right: colour–magnitude diagram for the April 29 WHT data. We show the de-reddenedrand the flux ratiofu/fgandfg/frdata. The solid black and red points show the active-and passive-state data, respectively. Note the increase in colour during the dips, i.e. they become more blue.
Figure 6. SwiftXRT and UVOT light curves of PSR J1023+0038 between 2013 Oct 18 and 2014 June 11. Left:SwiftXRT 0.5–10 keV light curve. The arrows mark the time of our IAC80, INT, TNT and WHT optical data. Right:Swiftsimultaneous UVOT (U,uvw1,uvw2 anduvm2) and XRT 0.5–10 keV observations. The error bar plotted in the top-left corner of each panel. The uncertainty in the UVOT data is smaller than the symbol size. A power-law fit to the data of the formLν;UV∝L
β Xis shown.
We also compute the PDS of the multiband ULTRACAM data taken on April 29, which shows strong active/passive state be-haviour. We find the power-law index of the PDS to be−1.43±0.05,
−1.34±0.07 and−1.10±0.05 in ther,gandubands, respec-tively, which implies that there is more high frequency variability at shorter wavelengths.
For the light curves that show mode-switching behaviour (Jan-uary 29, 30 and April 29), we compute the PDS of light curves
[image:7.595.47.549.363.582.2]Table 2. Properties of the simultaneous X-ray/UV observations of PSR J1023+0038.Nis the number of simultaneous X-ray/UV observations,Ris the cor-relation coefficient andβis the power-law index of the formLν;UV∝LβX.
Band N R β
U 7 0.26 0.04(4)
uvw1 35 0.62 0.77(2)
uvm2 14 0.89 1.13(4)
uvw2 22 0.87 1.02(3)
define the time values in theg- andu-band active- and passive-state light curves. Although we find a number of interesting differences in the slope of the active- and passive-state PDS, a Monte Carlo analysis shows that the differences are due to the window function
of the light curves. We perform a simulation in which we simu-lated a red-noise light curve with the same time values, power-law index, mean and rms as ther-band light curve. We then selected active and passive sections (the same as what we observe) and the compute the power spectrum and determine the power-law index. These were then compared to the power-law index of the simulated
r-band PDS. One would expect the PDS of the active and passive light curves to be the same as the PDS of the whole light curve. However, we find that the power-law index of the active and passive light curves are very similar, but different to the power-law index of the whole light curve.
6 P R O P E RT I E S O F T H E L A R G E F L A R E
The multicolour data taken with ULTRACAM allow us to determine the colour of the large flare event and dips (see Fig.2d). The March
[image:8.595.53.536.254.695.2]Table 3. The fractional rms of ther-band flare light curves and power-law (PL) fits to the PDS. The light curves where active and passive state are seen are not included. The mean de-reddened flux values are given and the fractional rms values have been determined after binning the light curves to the same time resolution of 60 s.
Telescope UTdate Flux (mJy) rms (per cent) PL index
TNT 2014-01-29 0.94 9.5 −1.43±0.04
TNT 2014-01-30 1.53 30.0 −1.54±0.04
IAC80 2014-02-02 1.29 30.1 −1.53±0.07
IAC80 2014-02-03 1.13 21.7 −1.40±0.04
IAC80 2014-02-04 0.91 21.1 −1.39±0.04
IAC80 2014-02-06 0.82 10.3 −0.61±0.07
IAC80 2014-03-01 0.79 21.0 −0.97±0.03
IAC80 2014-03-06 0.80 6.6 −0.91±0.08
IAC80 2014-03-08 1.00 27.1 −1.34±0.05
IAC80 2014-03-16 1.23 34.6 −1.29±0.05
IAC80 2014-03-17 0.81 8.0 −0.65±0.05
TNT 2014-03-25 1.53 29.9 −1.05±0.01
IAC80 2014-03-26 0.86 8.2 −1.22±0.05
TNT 2014-03-28 1.32 23.8 −1.83±0.01
IAC80 2014-03-29 1.35 15.0 −1.14±0.05
INT 2014-04-08 1.24 9.3 −0.72±0.05
IAC80 2014-04-24 1.11 9.9 −1.06±0.07
16 light curve starts off with relative low variability (active state) which develops into a large flare event lasting at least∼30 min. In contrast, the April 29 light curve shows dips in flux. To determine the colour of the flare event we use the flare light curves computed in Section 3, where the secondary star’s sinusoidal modulation is removed and the mean de-reddened flux value is added to preserve the flux values in each band. For the March 16 data we calculate the average active state and near-peak flux values for ther-,g -andu-band light curves. The flux of the flare is then obtained by subtracting the active-state flux from the near-peak flux value. For the April 29 data we calculate the average active- and passive-state flux values. The flare of the dips is then obtained by subtracting the active-state flux from the passive-state flux (see Table4).
In an attempt to interpret the broad-band spectral properties of the flare event, we compare the de-reddened colours with the prediction
for different emission mechanisms, such as a blackbody, an optically thin layer of hydrogen and synchrotron emission. The most likely model for a thermal flare is emission from an optically thin layer of recombining hydrogen, which is the mechanism generally accepted for stellar flares in single stars and cataclysmic variables (see Kerr & Fletcher2014, and references within). We therefore determine the continuum emission spectrum of an LTE slab of hydrogen for different baryon densities,NHand temperaturesTH. For each model we then compute the given emission spectrum and the expected flux density ratiosfu/fg andfg/fr using the synthetic photometry packageSYNPHOT(IRAF/STSDAS). Given the intrinsic model flux we
can then determine the corresponding radius (RH) of the region that produces the observed de-reddened flux at a given distance of 1.368 kpc (Deller et al.2012).
In Fig.8, we show the colours of the March 16 active- and flare-state data and the expected colours for different emission models. We can see that the blackbody or synchrotron emission models do not reproduce the observed flux ratios and so these models can be ruled out. For the March 16 light curve, the active-state flux ratios (see Table4) correspond to a region with NH∼ 1025
nu-cleons cm−2andTH∼ 6600 K. The flux ratio of the flare
(near-peak flux minus active-state flux) corresponds to a region with
NH ∼ 1023 nucleons cm−2, TH ∼ 8400 K and RH ∼ 0.35 R . Hence we find that during the large flare event there is a decrease in baryon density and an increase in temperature, suggesting that the flare emission becomes hotter and more optically thin. Us-ing the distance of 1.368 kpc (Deller et al. 2012) and the cor-responding filter bandwidth, the optical peak luminosity of the large flare is 4.9, 2.9 and 3.3×1032 erg s−1in theu, g andr
bands, respectively. Although we do not observe the full decay of the flare event, we estimate that the flare lasts∼1000 s (∼0.06 in phase) with an energy of 6×1035ergs in the combinedu,gand
rbands.
For the April 29 light curve, the active-state flux ratios correspond to a region withNH∼1025nucleons cm−2andTH∼6900 K (similar
to the active state in the March 16 light curve). The flux ratio of the dips (i.e. the flux ratio between bands after subtracting the active-state flux from the passive-active-state flux in each band) corresponds to a region with NH ∼ 1030 nucleons cm−2, TH ∼ 4600 K and
Table 4. Mean flux values of the WHT light curves taken on March 16 and April 29. For the March 16 event the mean active, near peak fluxes are given. The flare flux is calculated by subtracting the near-peak flare flux from the mean active-state flux and we also give the optical luminosity of the flare. For the April 29 light curves the mean active- and passive-state fluxes are given as well as the X-ray (0.5–10 keV) to optical (u,g andr) luminosity ratio, where the X-ray active- and passive-state luminosities are 2.85×1033and 5.70×1032erg s−1, respectively (Linares2014)
UTdate Band Active-state Near-peak Peak−Active LOPT flux (mJy) flux (mJy) flux (mJy) (erg s−1) March 16 fu 0.515(2) 1.369(7 0.855(9) 4.9×1032
fg 0.398(1) 0.868(4) 0.471(4) 2.9×1032
fr 0.973(2) 1.921(8) 0.948(8) 3.3×1032
fu/fg 1.294(7) 1.576(12) 1.825(15)
fg/fr 0.409(1) 0.452(3) 0.497(2)
Active-state Passive-state Active−Passive LX/LOPT flux (mJy) flux (mJy) flux (mJy) Active Passive
April 29 fu 0.563(2) 0.538(1) 0.025(2) 9.0 1.9
fg 0.720(1) 0.632(1) 0.087(2) 6.5 1.5
fr 1.375(2) 1.174(1) 0.202(3) 6.2 1.4
fu/fg 0.523(1) 0.539(1) 0.283(21)
[image:9.595.152.444.570.731.2]Figure 8. The colour–colour diagram of the WHT light curves of PSR J1023+0038 taken on the March 16 (blue) and April 29 (green). The colour during the active state is represented by a filled square, whereas the colour of the large flare event and dips is represented by a filled circle. The dashed lines show optically thin hydrogen slab models for different baryon column densities logNH, where the numbers mark the temperature in 100 K units. From right to left we show models with logNH =22–30 nucle-ons cm−2. The solid line shows a power-law model (Fν∝να) with indices
α= −2.0 to−4.0 marked as stars. The dotted line shows a blackbody model marked in 100 K units as open squares. The large red star shows the colour of a G5 main-sequence star.
RH∼0.35 R. Note that if we assume no reddening the colour ratios change by at most 6 per cent.
7 D I S C U S S I O N
7.1 The flaring activity
Patruno et al. (2014) reported the X-ray and UV/optical signa-tures of a state change in PSR J1023+0038 during mid-2013, which coincided with the disappearance of radio pulsations and the X-rays show a softer spectrum than during the millisecond pulsar state, indicating a change in the origin of the X-ray emission.U -band variability of∼0.3 mag on time-scales of∼1 h was seen as well as X-ray flux changes by up to a factor of ∼100 on time-scales less than<10 s. During the previous active phase in 2002, slow (hours) and rapid (minutes to seconds) optical flickering was observed (Bond et al.2002). Our light curves observed in 2014 during the accretion-powered phase show rapid flaring events on time-scales of minutes with amplitudes of∼0.1–0.5 mag and/or large flare events on time-scales of∼5–60 min with amplitudes of
∼0.5–1.0 mag (see Section 3.1). The PDS of the flare light curves has a median power-law index of−1.2 (see Section 5), typical of X-ray binaries (Shahbaz et al.2003,2004,2005,2010,2013; Zurita et al.2003).
Since the accretion disc is sandwiched by a hot, optically thin, fully ionized corona, two possible origins for the flares are (1) the optically thick, geometrically thin accretion disc or (2) from the corona, leading to enhanced energy release over a short period of time. In the context of the propeller effect, the inner edge of the accretion disc rotates slower than the neutron star magnetosphere and infalling matter is no longer able to accrete on to the neutron
star, but instead is blown out of the system by a propeller (Illarionov & Sunyaev1975), leading to flaring activity. This has been used to explain the large luminosity variations in the outburst tails of SAX J1808.4−3658 (Campana, Stella & Kennea2008). Indeed, the sporadic large flaring events observed in PSR J1023+0038 during its accretion-powered phase could also be explained in terms of a propeller effect, leading to the ejection of hot optically thin fireballs, as is observed in some cataclysmic variables (Pearson, Horne & Skidmore2003).
For the large flare event observed on March 16 (lasting at least
∼30 min) where we have multicolour information, we find that the event arises from a relatively optically thin region with∼8700 K,
NH∼6×10²²nucleons cm−2and a radius of∼0.35 R
; the out-of-flare state is cooler and more optically thick (see Fig.8). The energy of the flare in the optical bandpass of 6×1035erg (see Section 6)
is two orders of magnitude larger than the optical luminosity of flares produced by chromospheric activity in flare stars (Walkowicz et al.2011). Church & Bałuci´nska-Church (2004) have measured the radial extent of the accretion disc corona (ADC) in low-mass X-ray binaries. They find the ADC extends from 20 000 km in the faintest sources to 700 000 km in the brightest, typically 15 per cent of the accretion disc radius. In this context, our data suggest that the large flares arise from a large fraction of the accretion disc, most likely from the ADC.
7.2 The X-ray/UV correlations
Power-law correlations between the optical and X-ray luminosities in an X-ray binary are naturally expected. The optical emission in low-mass X-ray binaries is generally thought to arise in the outer accretion disc as the result of X-ray reprocessing and the luminosities are correlated in the formLν;V∝LβX(V refers to the Vband) (van Paradijs & McClintock1994). The indexβdepends on the surface brightness of the accretion which is given bySν∝Tα,
whereβ=α/4 (van Paradijs & McClintock1994). In theVband
α∼2.0 and soβ∼0.5 (van Paradijs & McClintock1994). It can be shown thatαincreases with decreasing wavelengths; in the UV band,α ∼3.7 (β ∼0.9), in the Vbandα∼ 2.7 (β∼ 0.7) and in theKbandα∼1.2 (β∼0.3). Russell et al. (2006) show that similar correlations are expected when the optical flux originates in the viscously heated disc because both the X-ray and optical fluxes are linked through the mass accretion rate. For a viscously-heated steady-state disc, with outer disc temperatures of 8000–12 000 K,
βis dependent on wavelength and increases at shorter wavelength;
β∼ 0.3 in theKband,β ∼0.5 in theV band andβ∼ 0.60 in the Uband. Note that the power-law index due to an irradiated accretion disc is steeper than that due to a viscously heated disc, for a given waveband. Russell et al. (2006) have quantified the disc and jet contribution from the optical/infrared and X-ray (2–10 keV) correlation in X-ray binaries in the hard state. From an observational point of view a strong optical/X-ray luminosity correlation from quasi-simultaneous data has been observed in neutron-star X-ray binaries in the hard state, which takes the formLν;OIR∝L0.63X ±0.04
and holds over seven orders of magnitude inLX(where OIR covers theBtoK-band). The authors concluded that X-ray reprocessing dominates the optical/near-infrared emission in neutron-star X-ray binaries in the hard state, with possible contributions from a jet (only at high luminosity) and a viscously heated disc.
heated disc (0.6) and is more in line with the index expected from an irradiated accretion disc (0.9).
7.3 The rectangular dips
X-ray mode-switching behaviour observed as fast transitions be-tween passive and active states (rectangular dips), has been detected in PSR J1023+0038 (Tendulkar et al.2014; Archibald et al.2015) and other similar systems (Linares2014). These dips, which are rectangular, are distinct from the dipping activity observed in some high inclination low-mass X-ray binaries, called X-ray dippers, where intense dipping activity at specific orbital phases are observed due to azimuthal absorbing material located close to the accretion disc bulge (White, Nagase & Parmar1995).XMM–Newton observa-tions of PSR J1824−2452I, with an X-ray luminosity 1035erg s−1,
showed rectangular dips with ingress and egress times of∼200 s and dip durations of up to a few thousand seconds (Ferrigno et al.2014).
Chandraobservations in quiescence showed mode-switching be-haviour with states lasting for∼10 h and transition times of less than 500 s (Linares et al.2014a). Dips which show a spectral hardening, ingress and egress times of<10 s and durations between 200 and 800 s have also been observed inXMM–Newtonobservations of XSS J1227.0−4859 (de Martino et al.2013). Linares (2014) has shown that all three redbacks observed so far which have transitioned to the accretion phase (PSR J1023+0038, XSS J1227.0−4859 and PSR J182−2452I) show X-ray mode-switching, with little or no change in X-ray photon index. For XSS J1227.0−4859 and M28-I, where there are measurements of NH during the active and passive states, no significant change inNH is observed (de Mar-tino et al.2013; Linares et al. 2014b). NuSTARobservations of PSR J1023+0038 in 2013 October, with an average X-ray lumi-nosity of 5.8×1033erg s−1, show sharp-edged, rectangular,
flat-bottomed dips with durations of 30–1000 s, ingress and egress times of 30–60 s and typical separations of∼400 s (Tendulkar et al.2014). The X-ray luminosity of the active and passive states only changes by a factor of∼5 (Linares2014).
Our high time resolution optical observations show sharp-edged, rectangular dips (see Section 3.2), which is the first time that the optical analogue of the X-ray active/passive state mode-switching has been observed. The histogram of the optical mid-dip position as a function of orbital phase is relatively flat (see Fig.4), sug-gesting that the dips are uniformly and randomly distributed with orbital phase, similar to what has been observed in the X-rays. The time-scale properties (ingress/egress, separation, etc.) of the opti-cal and X-ray dips are very similar, which suggests that we are seeing echoes of the X-ray variability. We observe an increase in thefu/fg andfu/fg colour ratio during the dips, which is due to the disappearance of a red spectral component (see Fig.5). The X-ray photon index of the active- and passive-state X-ray data does not change significantly (Linares2014). The decrease in the X-ray luminosity between the active and passive states is a factor of∼5 (Linares2014), much larger than the decrease in optical luminosity between the active and passive states;∼10 per cent; the decrease in the X-ray-to-optical luminosity ratio during the active and passive state of a factor between 4.4 and 4.7 (see Table4).
Bogdanov et al. (2015) recently presented the results of a multi-wavelength study of PSR J1023+0038 during it’s low-mass X-ray binary state.B-band light curves taken with a cadence of 13 s dur-ing late 2013 and 2014 clearly show the secondary star’s heated ellipsoidal modulation with superimposed flaring activity, similar to our optical light curves (see Section 3). The authors also obtained considerable simultaneousXMM–NewtonX-ray andB-band light
curves taken with a time resolution of 10 s. They find that none of theB-band light curves show the mode-switching behaviour as seen in the X-rays. At first light this seems to contradict our find-ings, where we clearly observe optical mode switching in some of our high time resolution light curves. However, it should be noted that in the ULTRACAM data, where mode switching is observed, the mode switching is strongest in therband and is significantly weaker in thegandubands; the mode-switching flux changes by a factor of 17, 14 and 5 per cent in ther-,g- andu-band light curves, respectively (see Fig.1d and Table4). Therefore, it is not surprising that theB-band light curves obtained by Bogdanov et al. (2015) do not show clear discernible mode-switching behaviour.
Bogdanov et al. (2015) extensive XMM–Newton observations allowed them to and observe the source in various states:∼20,∼70 and∼10 per cent of the time in the low- (passive), high- (active) and flare state, respectively. Our ground-based optical observations total about 96 h. During this time, we find the source to be in the flare state for∼10 h. Although we identify passive/active state behaviour in only 6 h of data, it should be noted that the poor time resolution of the IAC80 and INT data does not allow us to resolve the rapid flaring. It is clear that more extensive high time resolution optical data is needed before we can compare the properties of the optical and X-ray state changes.
7.3.1 Proposed scenario for the optical and X-ray mode-switching
The details of the interaction between the rotating magnetosphere of the neutron star and the inner accretion flow are complicated (e.g. see Uzdensky2004; Lai2014. However, it is generally assumed that accretion on to the neutron star’s surface occurs when a geometri-cally thin disc(truncated at the ‘magnetospheric radius’rm; where the ram pressure of the gas balances the pressure of the magnetic field; Pringle & Rees1972) is less than the corotation radius,rcor
(the radius where the disc Keplerian frequency matches the neutron star spin frequency, which is 24 km for PSR J1023+0038). If the in-ner edge of the disc extends inside the pulsar’s light-cylinder radius (rlc; where the field lines attached to the neutron star synchronously rotate with the star at a velocity equal to the speed of light) but lies outsidercor, ‘ propeller accretion’ can occur (Illarionov & Sunyaev
1975). In this case the pressure of infalling material is balanced by the magnetic field of the neutron star outsiderlc(rmrcor) and the infalling matter does not reach the neutron star surface. The resulting centrifugal barrier created by the rotating neutron star ex-pels the material from the system and the radio pulsar’s emission is quenched (Spruit & Taam1993; Rappaport, Fregeau & Spruit
2004). However, it is worth noting that the radiation pressure of a radio pulsar does not necessarily have to disrupt the disc and the disc can remain stable outsiderlc(Eks¸˙I & Alpar2005).
The recent detection of X-ray pulsations in PSR J1023+0038 during the accretion active state (Archibald et al.2015; Bogdanov et al.2015) implies that channelled accretion, similar to that seen in higher luminosity accreting millisecond X-ray pulsars, is occurring at a much lower accretion rate, implying that the inner edge of the accretion disc lies close torcorand a propeller does not form. In this case material can accumulate nearrcor and non-stationary accre-tion can occur as matter piles up around the intrinsically unstable magnetospheric boundary. Accretion discs accreting on to the mag-netosphere of a rotating star can end up in a trapped state, in which the inner edge of the disc stays nearrcor. The captured material can form a quasi-spherical shell (Pringle & Rees1972; Shakura et al.
accretion can occur (D’Angelo & Spruit2010,2012). As noted by Patruno et al. (2014), variations in the mass accretion rate of the accretion disc can move the inner disc radius by a factor of 2 or 3. The viscous time-scale defines the time-scale for this drift and to reach a viscous time-scale of 10–100 s requires a region with an annulus of radius∼10–100 km. The thermal time-scale is given by
ttherm∼(H/R)2tvis(whereHandRare the height and radius of the
disc) and for an inner thin disc withH/R<0.02 impliesttherm<few seconds, much lower than the time-scales observed. Thus, in prin-ciple, fluctuations in the mass accretion rate can movermoutside
rlc,which allows the radio pulsar to turns on, triggering a transition to the passive state, where the lower X-ray luminosity is produced by a shock between the pulsar wind and innermost accretion flow. An increase in the mass accretion rate pushes the inner edge of the disc back inside the light cylinder and turns off the radio pulsar. The X-ray pulsations are only observed in the active state and not in the passive-state light curves, which suggests that the switching between the passive and active states results in transitions between a non-accreting pure propeller mode and an accreting trapped-disc mode (Archibald et al.2015).
To explain the optical/X-ray timing and spectral properties of the passive- and active-state light curves, we propose a scenario in which the optical flux during the passive and active states arise from the viscously-heated and X-ray reprocessed disc, respectively, as well as from the irradiated secondary star. High-energy photons (presumably X-rays) produced in the inner parts of the accretion disc, very close to the compact object, photoionize and heat the sur-rounding outer regions of gas in the accretion disc and secondary star. These regions later recombine and cool, producing lower en-ergy photons. This results in reprocessed optical and UV radiation arising from a volume of significant spatial extent, that is imprinted with the same variability as the X-ray signal. The steeper PDS at shorter wavelengths suggests more high frequency variability aris-ing from regions closer to the compact object, as expected. An increase in the mass accretion rate pushes the inner edge of the disc inwards, past some critical radius which lies most likely nearrlc, and the radio pulsar turns off. During this accretion-powered active state, matter is accreted on to the neutron star surface via the mag-netic poles, resulting in X-ray pulsations (Archibald et al.2015), as well as irradiating the outer parts of the accretion disc. The build-up and release of mass in a trapped disc at some critical radius leads to clumpy accretion on to the neutron star’s surface, as depicted by the rectangular flat-bottom light curves. A decrease in the mass accretion rate moves the inner edge of the accretion disc outwards allowing the radio pulsar to turn on, triggering a transition to the rotation-powered passive state, where the lower X-ray luminosity is produced by a shock between the pulsar wind and innermost accretion flow and the viscously-heated accretion disc.
8 C O N C L U S I O N S
Below we list the main results of this paper.
(i) Our long-term time-resolvedr-band light curves taken be-tween 2014 January and April show an underlying sinusoidal mod-ulation due to the irradiated secondary star and accretion disc. We also observe superimposed rapid flaring on time-scales less than minutes with amplitudes of∼0.1–0.5 mag, and further additional large flare events on time-scales of∼5–60 min with amplitudes of
∼0.5–1.0 mag. The PDS of the flare light curves is dominated by a red-noise component with a power-law index typical of aperiodic activity in X-ray binaries.
(ii) The UV and X-ray luminosities are strongly correlated sug-gesting that the same emission mechanism is powering part of the X-ray and UV emission. The power-law index of the X-ray/UV lu-minosity correlation is consistent with an irradiated accretion disc. (iii) For the large flare event observed on March 16 where we have colour information, we find that the event arises from a relatively optically thin region with temperature∼8700 K,NH∼6×10²²
nu-cleons cm−2and a radius of∼0.35 R
, possibly from the ADC. (iv) On some nights we also observe sharp-edged, rectangular, flat-bottomed dips randomly distributed with orbital phase. These rectangular dips are similar to the mode-switching behaviour be-tween active and passive luminosity states observed in the X-ray light curves of other similar millisecond pulsars. The dips have a median duration and ingress/egress time of∼250 and∼20 s, respec-tively and we observe an increase in the blue colour ratio during the dips. This is the first time that the optical analogue of the X-ray mode-switching has been observed.
To explain the timing and spectral properties of the active- and passive-state light curves, we propose a scenario in which the optical flux during the passive and active states arise from the viscously-heated and X-ray reprocessed disc and changes in the inner disc radius, which lies nearrcor. An increase in the mass accretion rate leads to an accretion-powered active state, where matter is accreted on to the neutron star surface via magnetic poles, resulting in X-ray pulsations (Archibald et al.2015), as well as irradiating the outer parts of the accretion disc. A decrease in the mass accretion rate moves the inner disc’s edge outwards, triggering a transition to the rotation-powered passive state, where the lower X-ray luminosity is produced by a shock between the pulsar wind and the innermost accretion flow and the viscously-heated accretion disc. The optical/ X-ray timing properties of the passive- and active-state light curves, can be explained in terms of transitions between a non-accreting pure propeller mode accretion and an accreting trapped-disc mode accretion with X-ray reprocessing, during which clumpy accretion from a trapped inner accretion disc near the corotation radius results in rectangular, flat-bottomed optical and X-ray light curves.
AC K N OW L E D G E M E N T S
TS would like to thank Mallory Roberts and Rene Breton for use-ful discussions. This research has been supported by the Spanish Ministry of Economy and Competitiveness (MINECO) under the grants AYA2010-18080, AYA2012–38700 and AYA2013-42627. PRG is supported by a Ram´on y Cajal fellowship RYC–2010– 05762. VSD, SPL and ULTRACAM are supported by STFC grant ST/J001589/1. Based on scheduled observations made with the William Herschel Telescope and the Isaac Newton Telescope oper-ated on the island of La Palma by the Isaac Newton Group in the Spanish Observatorio del Roque de Los Muchachos of the Insti-tuto de Astrof´ısica de Canarias and on observations made with the IAC80 telescope operated on the island of Tenerife by the Instituto de Astrof´ısica de Canarias in the Spanish Observatorio del Teide.
R E F E R E N C E S
Alpar M. A., Cheng A. F., Ruderman M. A., Shaham J., 1982, Nature, 300, 728
Archibald A. M. et al., 2009, Science, 324, 1411
Archibald A. M., Kaspi V. M., Hessels J. W. T., Stappers B., Janssen G., Lyne A. 2013, preprint (arXiv:1311.5161)
Archibald A. M. et al., 2015, ApJ, 807, 62
Arnaud K. A. 1996, in Jacoby G. H., Barnes J., eds, ASP Conf. Ser. Vol. 101, XSPEC: The First Ten Years, in Astronomical Data Analysis Software and Systems V. Astron. Soc. Pac., San Francisco, p. 17
Bogdanov S., Archibald A. M., Hessels J. W. T., Kaspi V. M., Lorimer D., McLaughlin M. A., Ransom S. M., Stairs I. H., 2011, ApJ, 742, 97 Bogdanov S. et al., 2015, ApJ, 806, 148
Bond H. E., White R. L., Becker R. H., O’Brien M. S., 2002, PASP, 114, 1359
Burrows D. N. et al., 2005, Space Sci. Rev., 120, 165 Campana S., Stella L., Kennea J. A., 2008, ApJ, 684, L99 Cardelli J. A., Clayton G. C., Mathis J. S., 1989, ApJ, 345, 245 Church M. J., Bałuci´nska-Church M., 2004, MNRAS, 348, 955 Coti Zelati F. et al., 2014, MNRAS, 444, 1783
D’Angelo C. R., Spruit H. C., 2010, MNRAS, 406, 1208 D’Angelo C. R., Spruit H. C., 2012, MNRAS, 420, 416 de Martino D. et al., 2013, A&A, 550, A89
Deeg H. J., Doyle L. R., 2001, in Borucki W. J., Lasher L. E., eds, Third Workshop on Photometry. p. 85
Deller A. T. et al., 2012, ApJ, 756, L25 Dhillon V. et al., 2007, MNRAS, 378, 825 Dhillon V. S. et al., 2014, MNRAS, 444, 4009 Eks¸˙I K. Y., Alpar M. A., 2005, ApJ, 620, 390 Ferrigno C. et al., 2014, A&A, 567, A77
Halpern J. P., Gaidos E., Sheffield A., Price-Whelan A. M., Bogdanov S., 2013, Astron. Telegram, 5514, 1
Horne J. H., Baliunas S. L., 1986, ApJ, 302, 757
Hynes R. I., Charles P. A., Casares J., Haswell C. A., Zurita C., Shahbaz T., 2003a, MNRAS, 340, 447
Hynes R. I. et al., 2003b, MNRAS, 345, 292 Illarionov A. F., Sunyaev R. A., 1975, A&A, 39, 185 Kerr G. S., Fletcher L., 2014, ApJ, 783, 98 Kong A. K. H., 2013, Astron. Telegram, 5515, 1
Lai D. 2014, The Strongest Magnetic Fields in the Universe, Space Science Reviews, Springer, Berlin, preprint (arXiv:1411.7995)
Linares M., 2014, ApJ, 795, 72
Linares M. et al., 2014a, MNRAS, 438, 251
Linares M., Casares J., Rodriguez-Gil P., Shahbaz T., 2014b, Astron. Tele-gram, 5868, 1
Papadakis I. E., Lawrence A., 1993, MNRAS, 261, 612 Patruno A., Watts A. L., 2012, preprint (arXiv:1206.2727) Patruno A. et al., 2014, ApJ, 781, L3
Pearson K. J., Horne K., Skidmore W., 2003, MNRAS, 338, 1067 Predehl P., Schmitt J. H. M. M., 1995, A&A, 293, 889
Press W. H., Teukolsky S. A., Vetterling W. T., Flannery B. P., 1992, in Numerical recipes in FORTRAN. The Art of Scientific Computing, 2nd edn. Cambridge Univ. Press, Cambridge
Pringle J. E., Rees M. J., 1972, A&A, 21, 1
Rappaport S. A., Fregeau J. M., Spruit H., 2004, ApJ, 606, 436
Roberts M. S. E., 2011, in Burgay M., D’Amico N., Esposito P., Pellizzoni A., Possenti A., eds, AIP Conf. Proc. Vol. 1357, Radio Pulsars: An Astrophysical Key to Unlock the Secrets of the Universe. Am. Inst. Phys., Melville, NY, 127
Roming P. W. A. et al., 2005, Space Sci. Rev., 120, 95
Russell D. M., Fender R. P., Hynes R. I., Brocksopp C., Homan J., Jonker P. G., Buxton M. M., 2006, MNRAS, 371, 1334
Shahbaz T., Dhillon V. S., Marsh T. R., Zurita C., Haswell C. A., Charles P. A., Hynes R. I., Casares J., 2003, MNRAS, 346, 1116
Shahbaz T., Hynes R. I., Charles P. A., Zurita C., Casares J., Haswell C. A., Araujo-Betancor S., Powell C., 2004, MNRAS, 354, 31
Shahbaz T., Dhillon V. S., Marsh T. R., Casares J., Zurita C., Charles P. A., Haswell C. A., Hynes R. I., 2005, MNRAS, 362, 975
Shahbaz T., Dhillon V. S., Marsh T. R., Casares J., Zurita C., Charles P. A., 2010, MNRAS, 403, 2167
Shahbaz T., Russell D. M., Zurita C., Casares J., Corral-Santana J. M., Dhillon V. S., Marsh T. R., 2013, MNRAS, 434, 2696
Shakura N., Postnov K., Kochetkova A., Hjalmarsdotter L., 2012, MNRAS, 420, 216
Spruit H. C., Taam R. E., 1993, ApJ, 402, 593 Stappers B. W. et al., 2013, Astron. Telegram, 5513, 1 Szkody P. et al., 2003, AJ, 126, 1499
Takata J. et al., 2014, ApJ, 785, 131 Tauris T. M., 2012, Science, 335, 561 Tendulkar S. P. et al., 2014, ApJ, 791, 77
Thorstensen J. R., Armstrong E., 2005, AJ, 130, 759 Timmer J., Koenig M., 1995, A&A, 300, 707 Uzdensky D. A., 2004, Ap&SS, 292, 573
Van Der Klis M., 1989, in Ogelman H., van den Heuvel E. P., eds, Timing Neutron Stars: Proceedings of the NATO Advanced Study Institute on Timing Neutron Stars. Kluwer, New York, p. 27
van Paradijs J., McClintock J. E., 1994, A&A, 290, 133 Vaughan S., 2005, A&A, 431, 391
Walkowicz L. M. et al., 2011, AJ, 141, 50
White N. E., Nagase F., Parmar A. N., 1995, in Lewin W. H. G., van Paradijs J., van den Heuvel E. P. J., eds, X-Ray Binaries. Cambridge Univ. Press, Cambridge, p. 1
Wijnands R., van der Klis M., 1998, Nature, 394, 344 Wilms J., Allen A., McCray R., 2000, ApJ, 542, 914 Zurita C., Casares J., Shahbaz T., 2003, ApJ, 582, 369