Aggregate Productivity in the Philippine Economy
Myrna S. Austria
A Dissertation Submitted for the Degree of Doctor of Philosophy at the Australian National University
Declaration
Except where otherwise indicated, this thesis is my own work.
Myma S. Austria
Acknowledgements
I am deeply indebted to Dr. Rod Tyers, my supervisor, for providing intellectual nourishment and direction, particularly in the latter stages of my research, and for ensuring that the goal of completion was always in sight. His meticulous approach to reviewing my initial drafts has not only improved my work, but more importantly, it has provided a sense of perspective in the study. For his guidance and moral support, I will always be grateful. My deep gratitude also goes to Dr. Will Martin who supervised me in the early stages of my work. His breadth of knowledge saved me from many dead ends, especially during the difficult period of identifying my research topic. He was of great help in bringing to my attention some of the extensive literature related to my topic, including the latest on econometric techniques.
I also wish to thank the other members of my thesis committee. Professor Helen Hughes devoted a great deal of her time to reading drafts of chapters and her comments and suggestions have been very beneficial. Moreover, Professor Hughes' general leadership on development policy and her concern for the intellectual nourishment of students working in her field will always be warmly appreciated. Dr. Steve Dowrick advised me on the cross-country analysis part of the dissertation. As a leader in this field himself, his suggestions and comments were invaluable. Dr. Hal Hill's encouragement and the interest he has shown in reading the initial drafts of my chapters have also been of great value, particularly considering his special knowledge of the Philippines and other ASEAN economies.
the organization and especially during my stay in Australia. I thank the Australian International Development Assistance Bureau (AIDAB) for my scholarship. The Philippine Institute for Development Studies (PIDS), the University of the Philippines, School of Economics (UPSE) and the NEDA, Central Office all provided me with assistance, support and facilities during my fieldwork in the Philippines.
To my friends and colleagues at the ’PhD hut', especially Noi Treerat, Shu- juan Lin, Johannes Herdeschee, Cao Yong, Sione Kioa, Merlyne Paunlaqui and Elizabeth Go, I offer thanks for making my stay at the National Centre for Development Studies (NCDS) pleasant and memorable. To the staff of the NCDS, my thanks for all the help and assistance provided during my years of study.
To the members of the Graduate House Christian Fellowship Group, thank you for sharing with me not only the joy and laughter of academic life, but also its sorrow and tears. The Monday fellowship meetings have encouraged me to live a life worthy of the love of Jesus Christ My heartfelt thanks go to Jacob Adetunji, Melanie Milo, Sonny and Rachel Roxas, Edith Samson and Florence Soriano for all their support and encouragement not only in my studies but more importantly in my personal and spiritual life.
On the home front, I owe a great deal to Mayumi Quintos. She has always been ready to extend help (often with just one phone call) in gathering and sending any materials and data which I needed. Her friendship will always be treasured. I also wish to thank my friends in NEDA, especially Lynvic Ballesteros and Lucy Torio, for keeping me posted with the latest news from the office.
Abstract
The Philippines has been the weakest growth performer among the ASEAN countries. This thesis combines both econometric techniques and a computable general equilibrium model to examine the reasons for the country's poor economic performance. Growth models are developed showing the country's declining productivity performance, not only relative to the average of the middle income countries, but also relative to the country's past record. These confirm that aggregate productivity growth was at its worst during the government investment boom period of the late 1970s and early 1980s.
In addition, the cross country growth model shows that the investment rate in the Philippines was lower than the average of the middle income countries in contrast to the relatively higher investment rate in other ASEAN countries. During the periods when the country's growth performance was above the average of the middle income countries, the lower investment rate partially offset the contribution of other factors.
as might have been associated with the political instability of the early 1980s, the effects of capital flight are investigated. The results confirm that these not only reduce output in the short run but also total factor productivity.
Table of Contents
Pages
Declaration ii
Dedication iii
Acknowledgements iv
Abstract vii
Table of Contents ix
List of Tables xii
List of Figures xvii
Glossary xix
Chapter 1 Introduction 1
Objectives of the Study 3
Organization of the Study 4
Chapter 2 Philippine Economic Performance and Policies 6
Patterns of Overall Growth, 1950-89 7
Structure of the Philippine Economy 9
External Environment 19
Trade and Industrial Policies 23
Fiscal Policies 39
Monetary and Financial Policies 56
Summary 60
Chapter 3 The Economic Performance of the Philippines in Comparison with
Other Middle Income Countries 67
Factors Affecting Economic Growth: A Supply-Side Analysis 68
Modelling Growth and Technological Progress 73
Data Sources and Variables 81
Empirical Results 85 Growth Performance of the Philippines Relative to the Average
Performance of the Middle Income Countries 91
Summary and Conclusions 97
Chapter 4 Factor Rewards, Inflation and Productivity: A Time Series
Analysis 100
Output Supply and Prices 102
Dynamics 107
Data Sources 108
Behavior of the Variables 110
Empirical Findings 118
Sources of Growth 122
S ummary and Conclusions 125
Chapter 5 Effects of Trade Policies on Intersectoral Resource Allocation
and Industry Structure 127
The 'Industrial Organization' Approach to Trade and Trade
Liberalization 128
Industrial Structure in the Philippines 141
A General Equilibrium Model with Imperfect Competition 147
Solution of the Model 154
Effects of Trade Reform with Constant Oligopoly Pricing
Behavior 157
Effects of Trade Reform Combined with More Competitive
Pricing Behavior 160
Sensitivity of Results 163
Chapter 6 Industry-level Productivity Increase, Allocation of Investment
and Capital Exit 175
The Equilibrium Effects of Increasing Industry-level Productivity 176 Total Factor Productivity Performance of Industries 177 Effects of Increasing Industry-level Total Factor Productivity 180
Allocation of Investment 185
Effects of the Misallocation of Investment 189
Effects of Capital Exit 193
Summary and Conclusions 196
Chapter 7 Summary and Conclusions 199
Appendix A The Structure of the Model 203
Appendix B Summary of Data Gathering and Parameterization of the Model 214
List of Tables
Table Tide Page
2.1 A verage annual growth rate o f real G D P, 1950-89, A S E A N
(per cent) 7
2.2 A verage annual growth rates o f population and per capita real
G D P, A S E A N , 1950-85 (per cent) 9
2.3 Distribution o f G D P by sector, A S E A N , 1960, 1976, 1980 and
1989 (per cent) 10
2.4 A verage annual growth rate o f real value added by sector,
A S E A N , 1960-89 (per cent) 11
2.5 Distribution and growth o f em ploym ent by sector, Philippines,
1960-87 (per cent) 12
2.6 Urban and rural em ploym ent, unem ploym ent and under
em ploym ent, Philippines, 1956-87 (per cent) 13
2.7 Indices and average growth rates o f real daily w age rates,
skilled and unskilled workers, Philippines, 1950-80 (per cent) 14 2.8 L egislated real daily rates for agriculture and non-agriculture
w ages, Philippines, 1972-89 14
2.9 Percentage share in G D P and average annual real growth rate o f private consum ption, governm ent consum ption and
exports, A S E A N , 1960, 1976, 1980 and 1989 (per cent) 16 2 .1 0 A verage annual growth rate o f real gross dom estic investm ent,
selected countries, 1960-89 (per cent) 18
2.11 Incremental capital-output ratio, Philippines, 1951-89 19
2 .12 A verage effectiv e protection rates, by end use, Philippine
manufacturing, 1 9 6 1 ,1 9 6 5 and 1974 and 1985 (per cent) 24 2.13 A verage effectiv e rates o f protection by sector, Philippines,
1 9 6 5 ,1 9 7 4 , 1979 and 1985 (percent) 25
2.14 Proportional rates o f change in the user costs o f capital and
labor, BO I registered firms, Philippines (per cent) 26
2.15 Distribution o f real manufacturing output by industry group,
Philippines, 1956-89 (per cent) 34
2 .16 A verage annual growth rates o f real manufacturing output by
2.17 Structure of imports, Philippines, 1949-87 (per cent) 36 2.18 Average annual growth rate of real merchandise exports,
Philippines 1950-88 (per cent) 37
2.19 Distribution of exports by commodity group, Philippines,
1955-87 (per cent) 37
2.20 Resource balance as a percentage of GDP, ASEAN, 1960,
1976, 1980 and 1989 (per cent) 38
2.21 Gross domestic savings as a percentage of GDP, selected
countries, 1960, 1976,1980 and 1989 (per cent) 38
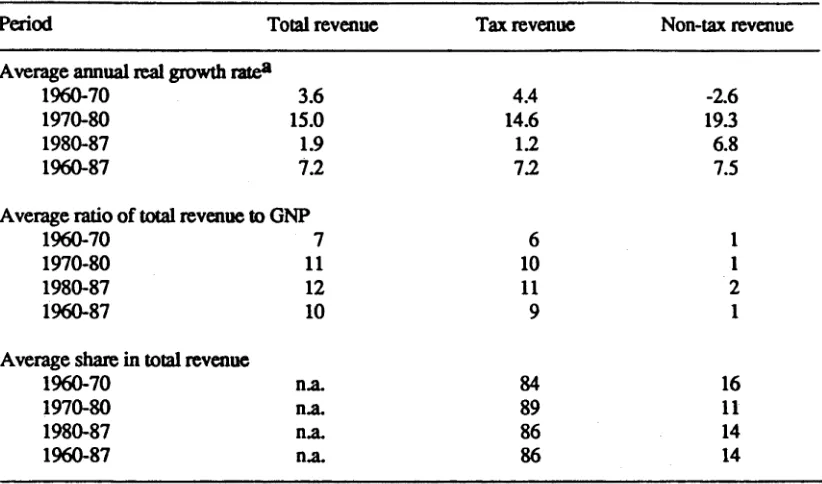
2.22 National government revenue, Philippines, 1960-87 (per cent) 40 2.23 Average distribution of national tax revenue by type,
Philippines, 1960-87 (per cent) 40
2.24 National government expenditures, Philippines 1960-87
(percent) 41
2.25 Real national government expenditures on a cash basis, Philippines,
1965-89 (1972 prices) 42
2.26 Real capital outlays of the national government, Philippines,
1970-89 (1972 prices) 44
2.27 Distribution of public sector investment and saving by level of
government, Philippines, 1975-84 (per cent) 45
2.28 Investment in public sector enterprises as a percentage of gross
domestic investment, Philippines, 1975-84 46
2.29 Financing of budget deficits, Philippines, 1975-84 48
2.30 Domestic debt of the national government, Philippines, 1970-89 49
2.31 Outstanding external debt, Philippines, 1970-89 53
2.32 Debt indicators, Philippines, 1970-89 (per cent) 54
2.33 M2/GDP ratio, ASEAN (per cent) 57
A.2.1 Distribution of unemployed persons, by highest grade completed,
Philippines 1965,1980 and 1987 (per cent) 62
A.2.2 Distribution of overseas landbased workers, by country of
destination, Philippines, 1975,1980 and 1987 (per cent) 62 A.2.3 Distribution and growth rate of overseas landbased workers,
by major occupation group, Philippines, 1973, 1980, 1987
A.2.4 Foreign income generated by overseas workers as a percentage
of merchandise exports, Philippines, 1976, 1980, 1983 and 1985 63 A.2.5 Real national government expenditures on a cash basis, Philippines,
1965-89 (1972 prices) 64
A.2.6 Real national government capital outlays, Philippines, 1970-89 65 A.2.7 Nominal and real deposit and lending rates, Philippines,
1956-88 (percent) 66
3.1 Characteristics of 46 middle income countries, 1960-85 83
3.2 Regression results 87
3.3 Parameter estimates 88
3.4 Sources of growth in forty-six middle-income countries, 1960-85 90 3.5 Explaining differences in the average growth rates of selected
countries, 1960-85 93
A.3.1 List of middle income countries included in the sample 99 4.1 Augmented Dickey-Fuller test on the stationarity of variables 115 4.2 Tests on the cointegration between GDP and the explanatory
variables 116
4.3 Estimation results 119
4.4 Sources of growth, Philippines 1950-87 (per cent) 122
4.5 Distribution of the sources of growth in the Philippines, various
studies (per cent) 123
5.1 Average capital utilization rates in Colombia, Israel,
Malaysia and the Philippines, 1972-73 (per cent) 136 5.2 Three-establishment concentration ratios, Philippines,
1970 (per cent) 142
5.3 Capital utilization in Philippine manufacturing, by industry,
1972 (percent) 144
5.4 Index of capital utilization, Philippines 1956-80 (1972=100) 145 5.5 Number of establishments and the ratio of output per
establishment to MES, Philippine manufacturing, 1983 146 5.6 Implicit tariff rate and export subsidy rate, Philippines,
selected years (per cent) 147
5.8 Equilibria solved for the m odel 156 5.9 Econom y-w ide effects o f trade reform with constant oligopoly
pricing behavior (percentage changes) 157
5.10 Sectoral effects o f trade reform with constant oligopoly
pricing behavior (percentage changes) 158
5.11 Econom y-w ide effects o f trade reform com bined w ith m ore
com petitive pricing behavior (percentage changes) 161
5.12 Sectoral effects o f trade reform com bined with m ore com petitive
pricing behavior (percentage changes) 162
5.13 Elasticities o f sensitivity for the food, beverages and
tobacco industry (trade reform com bined with m ore com petitive
pricing behavior, free entry equilibrium ) 165
A.5.1 Four-establishm ent concentration ratio, food industry,
Philippines, 1978 (p ercen t) 167
A .5.2 Four-establishm ent concentration ratio, hom e appliance industry,
Philippines, 1978 (p ercen t) 167
A .5.3 Four-establishm ent concentration ratio, textile industry,
Philippines, 1978 (per cent) 168
A .5.4 Spearm an rank correlation test for concentration ratio and
capital utilization rate 169
A .5.5 Industry classification from the 1983 66 x 66 Input-O utput
table, Philippines 170
A .5.6 A verage im plicit tariff rate, Philippines, 1983 and 1988 172 6.1 A verage annual grow th rate o f TFP, Philippine agriculture,
1950-84 (per cent) 178
6.2 G row th rate o f TFP, Philippine m anufacturing, 1960, 1972,
1976,19 80 and 1983 179
6.3 A verage annual grow th rate o f TFP w ithin and betw een industry,
Philippine m anufacturing, 1956-80 (per cent) 180
6.4 Econom y-w ide effects o f a 10 per cent productivity increase
(percentage changes) 181
6.5 Sectoral effects o f a 10 per cent productivity increase
(percentage changes) 183
6.6 R anking o f industries by productivity im pact 187
6.7 D istribution and average annual real grow th rate o f loans,
6.8 Distribution and average annual real growth rate of investment
in Philippine manufacturing, by industry, 1976-83 (per cent) 189 6.9 Economy-wide effects of capital exit (due to a risk premium of
10 per cent on capital cost) 195
6.10 Sectoral effects of capital exit (due to a risk premium of 10
per cent on capital cost) 195
A.6.1 Spearman rank correlation test on TFP growth and capital
utilization rate 197
A. 6.2 GDP, with and without the boom (P million at 1972 prices) 198 B. 1 Summary of data gathering and calibration of the model 225
B.2 Summary of parameters and their estimation 227
B.3 Philippine social accounting matrix, 1983 (thousand pesos) 229 B.4 Elasticities of substitution, export demand elasticities and share
of fixed capital and fixed labor to total payments to capital
List of Figures
Figure Tide Page
2.1 Average annual growth rate of real GDP, Philippines, 1950-89
(per cent) 8
2.2 Real investment as a percentage of real GDP, ASEAN, 1960-85
(per cent) 17
2.3 Real investment as a percentage of real GDP, Philippines and
selected Latin American countries, 1960-85 (per cent) 17 2.4 Growth rate of economic activity, Organization for Economic
Cooperation and Development (OECD) countries, 1970-86
(per cent) 20
2.5 Balance of trade as a percentage of gross national product (GNP),
Philippines, 1950-88 (per cent) 20
2.6 Terms of trade, Philippines, 1950-85 (1972=100) 21
2.7 Real international interest rate, 1965-90 (per cent) 22
2.8 Nominal exchange rate, 1960-82 (P/$US) 27
2.9 Average annual growth rate of real value added, by sector,
Philippines, 1950-89 (per cent) 33
2.10 Interest payments as a percentage of current operating expenditures and total government expenditures, Philippines, 1975-89
(per cent) 43
2.11 Budget surplus(deficit)/GNP ratio, Philippines, 1960-88 (per cent) 47 2.12 Real and nominal interest rates on Treasury Bills, Philippines,
1970-89 (per cent) 50
2.13 Inflation rate, Philippines, 1951-88 (per cent) 51
2.14 Current account surplus/deficits as a percentage of GNP,
Philippines, 1970-88 (per cent) 56
2.15 Real deposit and lending interest rates, Philippines, 1960-88
(per cent) 58
4.1 Aggregate supply curve 104
4.2 Index of nominal wage and price level, Philippines, 1950-80
4.3 Trends in capital and GDP, Philippines, 1950-87 111
4.4 Trends in labor force, Philippines, 1950-87 111
4.5 Trends in the annual growth of capital, labor and GDP,
Philippines, 1951-87 112
4.6 Trends in annual inflation, expected inflation and the difference
between actual and expected inflation, Philippines, 1953-87 112 4.7 Trends in the annual change in inflation, expected inflation
and difference between actual and expected inflation,
Philippines, 1954-87 113
4.8 Annual growth rates of total factor productivity, Philippines,
1951-87 (percent) 124
4.9 Capital stock, net investment and gross domestic product,
Philippines, 1950-87 (billion constant pesos) 125
5.1 Increasing cost 132
5.2 Decreasing cost 132
5.3 Model solution 150
6.1 Investment, with and without the boom, Philippines, 1950-87
(P billion at 1972 prices) 190
6.2 Capital stock, with and without the investment boom, Philippines,
1950-87 (P billion at 1972 prices) 191
6.3 Inflation rate, with and without the investment boom,
Philippines, 1951-87 (percent) 192
6.4 Expected inflation rate, with and without the investment boom,
Philippines, 1953-87 (per cent) 192
6.5 Gross domestic product, with and without the investment boom,
Glossary
A bbreviation:
ADB Asian Development Bank
ADF Augmented Dickey-Fuller test
ANU The Australian National University
ASEAN Association of South East Asian Nations
BOI Board of Investment
BOP Balance of payments
CB Central Bank of the Philippines
CES Constant elasticity of substitution
CGE Computable general equilibrium
COE Current operating expenditures
DBP = Development Bank of the Philippines
DF Dickey-Fuller test
ECM Error correction model
EPP Exports Priorities Plan
EPR Effective protection rate
EPZ Export Processing Zone
GDP Gross domestic product
GFIs = Government financial institutions
GLS Generalized least squares
GNP Gross national product
I/O Input-output table
ICOR Incremental capital-output ratio
EEDB International Economic Data Bank
IM F = In tern atio n al M onetary F und IP P = In v e stm en t P riorities Plan
IS IC = In tern atio n al S tandard In dustrial C la ssificatio n L B P = L and B an k o f the Philippines
L M = L ag ran g e m u ltiplier
L S D V = L e a st sq u ares dum m y v ariable
M E P S = M in im u m efficien t scale as a p e rc en ta g e o f in d u stry size M E S = M in im u m e fficien t scale
M T I = M in istry o f T rad e and Industry
N B E R = N a tio n al B ureau o f E co n o m ic R ese arch N C S O N a tio n al C en su s and S tatistics O ffice
N E D A = N a tio n al E co n o m ic and D e v e lo p m e n t A u th o rity N LS = N o n -lin e a r least squares
N S C B = N atio n al S tatistical C o ordinatio n B o ard
O E C D = O rg a n iz atio n fo r E con om ic C o o p eratio n an d D e v elo p m e n t
PD = P resid e n tia l d ecree
PN B = P h ilip p in e N ational B ank P S E s = P u b lic sec to r enterprises P V B = P h ilip p in e V eterans' B an k
R A = R ep u b lic A c t
R S S = R esid u a l su m o f squares S A M = S o cial a cc o u n tin g m atrix T F P z= T o tal fa c to r p roductivity T R P = T a riff re fo rm p rog ram
U N = U n ite d N atio n s
U N ID O = U n ite d N a tio n s In d ustrial D e v e lo p m e n t O rg a n iz atio n U S A = U n ite d S tates o f A m erica
For tables: = zero
= not available = insignificant n.a. = not applicable
Notes:
Chapter 1
Introduction
The economic performance of the Philippines has been the weakest among the Association of Southeast Asian Nations (ASEAN). The poor comparative growth achieved in the country raises the question as to why growth has been low. What went wrong? Several factors could affect a country's growth and development. These include, among others, natural resource endowments, the form of government (and hence, the credibility of policies), the cultural heritage, economic size, population, location and historical and initial conditions of development (Kuznets 1965, 1966; Chenery and Syrquin 1975; Chenery 1979). None of these factors, nor any combination of them, however, have provided an adequate single framework to explain the success or failure of any country or groups of countries (Riedel 1988; Hughes 1988a). The economic performance of Indonesia and Malaysia (both well- endowed with natural resources), for example, has been poor compared with that of Hong Kong and Singapore (Riedel 1988). Thailand and the Philippines, on the other hand, have similar resource endowments, but the economic performance of the latter has been less satisfactory than the former, especially in the 1980s (Mackie 1988).
industrial countries and the oil price shocks have been associated with a continuous decline in the terms of trade of the Philippines since the 1960s and the sudden rise in the external cost of capital in the 1980s. These have affected all developing countries, however, although in varying degrees. In these unfavorable domestic and international environments, much depends on the capacity of the government to make second best policy choices which will yield sustainable economic growth.
A range of disparate policy regimes, adopted during the last four decades, saw growth episodes characterized by booms and busts. In the 1950s and 1960s, the country was a classic case of the 'import substitution syndrome' based on the expansion of consumer goods production for the domestic market behind high protective walls, giving rise to import-dependent, inward-looking and capital intensive industries and an oligopolistic industrial structure characterized by unrealized scale economies. In the 1970s and 1980s, however, external debt ballooned as a result of imprudent fiscal spending. To accommodate this, monetary conduct was expansionary relative to what it had been in the 1950s and 1960s.
Objectives of the Study
This thesis is an analysis of the economic performance of the Philippines. While several studies have already been undertaken to examine the determinants of the country’s long term growth, these studies were limited to simple growth accounting. The approach adopted here goes beyond growth accounting and combines both econometric techniques and computable general equilibrium model to address the following issues:
(1) How far from the average growth of middle income countries was the Philippines' performance and what factors explain the deviations?
(2) To what extent have the biases and distortions fostered by trade and industrial policies hampered the efficient allocation of resources and hence, how much has this intersectoral resource misallocation caused low aggregate productivity? This study looks particularly at trade reform to examine these policies, focusing on imperfect competition and unrealized scale economies as sources of inefficiency.
(4) Macroeconomic uncertainty and political instability, especially in the early 1980s, caused capital flight. How much of the reduction in output and aggregate productivity in the 1980s arises from the exit of capital?
Organization of the Study
The thesis is organized as follows:
Chapter 2 presents a broad picture of the Philippines' growth and development during the last four decades with emphasis on how domestic policies have influenced the growth and structure of the country. Comparisons are made with other ASEAN countries as well as with some Latin American countries.
Chapter 3 examines how far the growth record of the Philippines deviates ffom the average growth of middle income countries. A growth model is used that captures the effects of factor inputs, exports and technological catch-up in explaining differences in the growth performance of middle income countries. Sources of deviations are then identified and analyzed.
Chapter 4 is a time series econometric analysis of the determinants of the long term growth of the country, with emphasis on the performance of productivity growth. Specification of the growth model is of the error correction form, incorporating the dynamic adjustment of the economy from its short run position to its long run trend.
Chapter 6 discusses the effects of industry-level productivity increases, the allocation of investment and the exit of capital using the same general equilibrium model employed in Chapter 5. The effects of the investment boom are also discussed using the growth model developed in Chapter 4.
Chapter 7 contains a summary and some general conclusions.
Chapter 2
Philippine Economic Performance and Policies
The Philippines has been the weakest growth performer among the ASEAN countries. While other ASEAN countries experienced rapid structural change, the absence of transformation is very conspicuous in the Philippines. Because of its relatively low growth of aggregate output and relatively rapid population growth, unemployment and underemployment have remained high. This pattern of economic performance has led to the Philippines being described as a Latin American country misplaced in Asia.
Patterns of Overall Growth, 1950-89
The country had a fast start in the 1950s registering the highest average annual growth rate of gross domestic product (GDP) among its neighbors in Southeast Asia for the period 1950-60 (Table 2.1). During the first half of the 1950s, the economy actually experienced a record real growth rate of 8.2 per cent per annum, the highest growth relative to any period of comparable length in Philippine history. This is somewhat misleading, however, because this initial boost to growth was the result of the postwar reconstruction and development and the adoption of import substitution policies which gave sudden profitability to the production of light consumer goods. Failure to sustain the remarkable performance was already visible in the latter half of the 1950s when growth began to falter. The growth rate fell to an average of 4.8 per cent per annum between 1955 and 1960.
Table 2.1 Average annual growth rate of real GDP, 1950-89, ASEAN (per cent)
Country 1950-60 1960-70 1970-80 1980-85 1980-89
Philippines 6.9 5.3 6.4 -0.1 0.7
Indonesia • • 3.7b 9.1 5.5 5.3
Malaysia 4.9a 6.2 10.0 4.4 4.9
Singapore •• 9.0 9.0 12.4 6.1
Thailand 3.3 7.7 7.4 4.5 7.0
a 1955-60 b 1962-70
Note: Except for 1980-89, GDP was measured using purchasing power parity at constant 1980 international prices.
[image:28.550.79.495.405.578.2]The economy then slowed in 1960-70. The gap between the Philippines and other ASEAN countries widened further during 1970-80 although the country's performance was comparable to its record growth levels in the 1950s. The economic crisis experienced by the Philippines in the early 1980s has pulled its growth performance down to dismal levels for the first time in the country's post-war history. Plagued by political difficulties, the country slipped backwards as shown in Figure 2.1. Most of the countries in the region experienced a slowdown in the early to mid-1980s, but the Philippines was the only one with a negative growth rate during the period. Growth started to pick up after the Aquino administration took over in 1986, but the growth momentum was not sustained. As shown in Figure 2.1, the country's growth declined after 1988. Throughout 1980-89, the country was again the weakest performer among the ASEAN countries.
Figure 2.1 Average annual growth rate of real GDP, Philippines, 1950-89 (per cent)
Ü 4
-1950 1953 1956 1959 1962 1965 1968 1971 1974 1977 1980 1983 1986 1989
Year
Not only was the Philippines' GDP growth low, but the country's average annual population growth rate during 1960-85 was the highest among the ASEAN countries (Table 2.2). Real GDP per capita in the country registered the highest growth rate in the 1950s. Because of unsustained output growth and rapid population growth, the country's growth of per capita real GDP lagged behind other ASEAN countries.
Table 2.2 Average annual growth rates of population and per capita real GDP, ASEAN, 1950-85 (per cent)
1950-60 1960-70 1970-80 1980-85 1960-85
Population
Philippines 2.8 3.0 2.7 2.5 2.8
Indonesia „ 2.1b 2.3 2.1 2.2C
Malaysia 3.03 2.8 2.5 2.5 2.6
Singapore • • 2.3 1.5 1.2 1.8
Thailand 2.5 3.1 2.5 2.1 2.6
Per capita real GDP
Philippines 4.0 2.3 3.6 -2.6 1.8
Indonesia „ 1.6b 6.6 3.4 4.1c
Malaysia 1.8a 3.3 7.4 1.9 4.6
Singapore .. 6.5 7.3 11.1 7.7
Thailand 0.8 4.4 4.8 2.3 4.1
a 1955-60 b 1962-70 c 1962-85
Note: For international comparability, per capita GDP was based on purchasing power parity at constant 1980 international prices.
Source: Summers, R. and Heston, A., 'A new set of international comparisons of real product and price levels: estimates for 130 countries, 1950-85', Review of Income and Wealth, 1988, 34:14-21, Table 2.
Structure of the Philippine Economy
the light of the policies that prevailed.
Despite efforts to industrialize, the drop in the share of agriculture in GDP has been small. This is in marked contrast to Thailand and Indonesia where there was a substantial decline in the share of agriculture over the years.
Table 2.3 Distribution of GDP by sector, ASEAN, 1960,1976,1980 and 1989 (per cent)
Sector Philippines Indonesia Malaysia Singapore Thailand
Agriculture
1960 26 54 37 4 40
1976 29 29 29 2 30
1980 23 26 24 1 25
1989 24 23 •• 0 15
Industry
1960 28 14 18 18 19
1976 34 34 30 35 25
1980 37 42 37 37 29
1989 33 37 •• 37 38
Manufacturing
1960 20 8 9 12 13
1976 „ „ .. ,,
1980 26 9 23 28 20
1989 22 17 •• 26 21
Services
1960 46 32 45 78 41
1976 37 37 41 63 45
1980 40 32 39 62 46
1989 43 39 •• 63 47
Note: Since manufacturing is the most dynamic part of the industry sector, its share in GDP is shown separately.
Source: World Bank, World Development Report, Oxford University Press, New York (various issues).
accounted for by manufacturing also remained relatively constant between 1960 and 1989.
The growth of the different sectors in the Philippines was also low compared with other ASEAN countries (Table 2.4). Thailand recorded higher growth rates in all sectors and periods, except in agriculture for 1970-80, than did the Philippines. While Indonesia had lower sectoral growth than the Philippines in the 1960s, the picture was reversed in the 1970s and 1980s, except for agriculture during 1970-80. The industry sector plunged to a negative annual growth rate during 1980-89. Manufacturing hardly grew, a stark contrast to the relatively higher growth rates of the sector in Indonesia and
Thailand-Table 2.4 Average annual growth rate of real value added by sector, ASEAN, 1960-89 (per cent)
Sector Philippines Indonesia Malaysia Singapore Thailand
Agriculture
1960-70 4.3 2.7 5.0 5.6
1970-80 4.9 3.8 5.1 1.8 4.7
1980-89 2.0 3.2 3.9 -5.7 4.1
Industry
1960-70 6.0 5.2 12.5 11.9
1970-80 8.7 11.1 9.7 8.8 10.1
1980-89 -0.8 5.3 6.5 5.0 8.1
Manufacturing
1960-70 6.7 3.3 13.0 11.4
1970-80 7.2 12.8 11.8 9.6 10.6
1980-89 0.5 12.7 8.0 5.9 8.1
Services
1960-70 5.2 4.8 7.7 9.1
1970-80 5.4 9.2 8.2 8.5 7.3
1980-89 1.2 6.6 3.9 7.0 7.4
Note: Since manufacturing is the most dynamic part of the industry sector, its growth is shown separately.
Employment, unemployment and underemployment. The employment structure reflects the structure of output. Agriculture has continued to be the major employer of labor since the 1950s (Table 2.5). Although its share has been declining, the change has been small. On the other hand, the industry sector made only a small contribution to employment generation. Its share was almost constant through the years. The manufacturing sector even registered a decline in its share of total employment. With the decline in agricultural employment and the inability of industry to absorb labor, services has been the accommodating sector.
Table 2.5 Distribution and growth of employment by sector, Philippines, 1960-87 (per cent)
Year Agriculture Industry Manufacturing3 Services Total
Percentage distribution^
1956 60 15 12 24 100
1960 61 15 12 24 100
1970 54 17 12 27 100
1980 51 16 11 32 100
1987 48 15 10 37 100
Average annual growth rate
1960-70 1.6 3.6 2.7 5.1 2.9
1970-80 3.3 3.1 3.0 5.4 3.8
1980-87 2.3 2.5 1.8 5.3 3.4
aSince manufacturing is the most dynamic part of the industry sector, its percentage share of cent because the share of industries falling outside these classifications are not included.
Sources: National Economic and Development Authority, Philippine Statistical Yearbook, Manila (various issues); National Statistical Coordination Board, Philippine Statistical Yearbook, Manila (various issues).
employment and growth rate are shown separately. bThe percentage distribution may not add to 100 per
university graduates among the unemployed. The proportion increased from 13 per cent in 1965 to 30 per cent in 1987 (Appendix Table A.2.1).
Table 2.6 Urban and rural employment, unemployment and underemployment, Philippines, 1956-87 (per cent)
Rates Average growth rate
1956 1968 1975 1980 1987 1975-80 1980-87
Employment
Urban .. 92 92 86 1.6 6.5
Rural .. 97 96 93 2.9 2.0
All areas 90 92 96 95 91 2.5 3.4
Unemployment
Urban .. 8 8 14 2.8 15.6
Rural .. 3 4 7 10.7 12.0
All areas 10 8 4 5 9 6.3 13.9
Underemployment
Urban 9 22 15 22.5 1.7
Rural „ 10 23 27 23.0 4.5
All areas 19 25 13 21 22 22.8 3.7
Sources: National Economic and Development Authority, Philippine Statistical Yearbook, Manila, (various issues); National Statistical Coordination Board, Philippine Statistical Yearbook, Manila, 1988; Tidalgo, L., "Labor markets, labor flows and structural change in the Philippines', in Pang Eng Fong (ed), Labour Market Developments and Structural Change: The Experience of ASEAN and
Australia, Singapore University Press, Singapore, 1988; National Economic and Development
Authority, Compendium of Philippine Social Statistics, Manila, 1986.
Table 2.7 Indices and average growth rates of real daily wage rates, skilled and unskilled workers, Philippines, 1950-80 (per cent)
Year Nominal Real ,1972 =100)
Skilled Unskilled Skilled Unskilled
Index
1950 60.9 41.1 137.9 93.0
1955 59.6 49.7 141.5 117.6
1960 62.7 50.6 133.3 107.6
1965 68.2 60.9 115.2 102.7
1970 90.6 88.4 114.4 111.4
1975 119.7 120.1 72.7 72.9
1980 180.9 151.5 63.7 53.4
Average annual growth rate
1950-60 n.a. n.a. -0.3 1.5
1960-70 n.a. n.a. -1.5 0.3
1970-80 n.a. njL -5.7 -7.8
Source: National Economic and Development Authority, Philippine Statistical Yearbook, Manila (various issues).
Table 2.8 Legislated real daily rates for agriculture and non-agriculture wages, Philippines, 1972-89
Amount (P) Average annual
Sector (1978 prices) growth rate (%)
1972 1980 1989 1972-80 1980-89
Non-agriculture, Metro Manila 16.23 19.36 17.37 2.2 -1.2
Non-agriculture, outside Metro Manila 17.35 19.00 18.97 1.1
-Agriculture, plantation 10.30 16.39 16.49 6.0
-Agriculture, non-plantation 10.30 12.30 12.64 2.2 0.3
Source: National Economic and Development Authority, Philippine Statistical Yearbook, Manila, (various issues).
are production process workers, transport equipment operators, laborers, and service workers like house maids (Appendix Table A.2.3).
The government actually encouraged and facilitated overseas employment as a means of reducing domestic underemployment and unemployment and as a source of much needed foreign exchange, especially in the early 1980s when a balance of payments crisis put severe economic strain in the country. As a percentage of the labor force, overseas employment increased from less than 1 per cent during 1975-79 to about 2 per cent during 1980-87. Earnings from overseas employment expanded from 7 per cent of merchandise exports in 1975 to 19 per cent in 1983 but declined to 12 per cent in 1985 (Appendix Table A.2.4). These recorded amounts would be much higher if remittances through informal channels were taken into account.
Table 2.9 Percentage share in GDP and average annual real growth rate of private consumption, government consumption and exports, ASEAN, 1960,1976,1980 and 1989 (per cent)
Sector Philippines Indonesia Malaysia Singapore Thailand
Percentage share in GDP: Private consumption
1960 76 80 62 95 76
1976 65 66 53 60 68
1980 67 57 51 59 66
1989 73 53 52 46 61
Government consumption
1960 8 12 11 8 10
1976 10 9 15 11 11
1980 8 13 17 11 12
1989 9 9 14 11 10
Exports of goods and services
1960 11 13 54 163 17
1976a 19 22 50 160 22
1980 20 31 60 • • 25
1989 25 26 74 191 36
Average annual real growth rate*5: Private consumption
1960-70 4.7 4.1 4.2 5.4 7.0
1970-80 5.0 8.1 7.2 6.8 6.3
1980-89 3.1 4.3 3.3 5.6 7.2
Government consumption
1960-70 5.0 0.9 7.5 12.6 9.7
1970-80 7.2 12.9 9.9 6.4 9.2
1980-89 1.4 4.4 2.5 7.1 5.6
a 1977 bNo data for exports of goods and services
Figure 2.2 Real investment as a percentage of real GDP, ASEAN, 1960-85 (per cent)
fc 20
-Malaysia
Philippines
Singapore
Thailand
Indonesia
Source: Summers, R. and Heston, A., 'A new set of international comparisons of real product and price levels: estimates for 130 countries, 1950-85*, Review o f Income and Wealth, 1988, 34:14-21, Table 2.
Figure 2.3 Real investment as a percentage of real GDP, Philippines and selected Latin American countries, 1960-85 (per cent)
Year
Philippines
~ ~ ~ Mexico
* * ‘ Argentina
--- Chile
--- Brazil
[image:38.550.82.482.400.614.2]Table 2.10 Average annual growth rate of real gross domestic investment, selected countries, 1960-89 (per cent)
Country 1960-70 1970-80 1980-89
Indonesia 4.6 14.4 6.8
Malaysia 7.5 10.3 1.3
Singapore 20.5 6.7 2.8
Thailand 15.8 7.7 5.7
Philippines 8.2 10.5 -7.8
Argentina 4.1 2.9 -7.8
Brazil 7.0 9.7 0.7
Chile 4.2 -1.8 2.7
Mexico 9.6 7.4 -5.0
Source: World Bank, World Development Report, Oxford University Press, New York (various issues).
Table 2.11 Incremental capital-output ratio, Philippines, 1951-89
Period ICOR Period ICOR
1951-55 1.8 1970-75 3.9
1955-60 3.1 1975-80 4.4
1960-65 3.8 1980-85 12.8
1965-70 4.0 1985-89 4.4
Note: ICOR is computed as the ratio of investment as a proportion of GDP in a given year to the growth o f GDP in the following year. Data shown refers to the average for the period.
Sources: National Economic and Development Authority, Philippine Statistical Yearbook, Manila (various issues); National Statistical Coordination Board, Philippine Statistical Yearbook, Manila, 1988 and 1990.
External Environment
Before analyzing the domestic policies of the Philippines, it is best to present the external factors that have affected the country's economic performance. While part of the country's economic difficulties can be traced to the global environment, it was the character of the country's economic policies that have aggravated the impacts of the external shocks to the domestic economy.
their energy requirements. The excess of imports over exports was highest in the Philippines between 1973 and 1983 (Figure 2.5), reflecting an extraordinary capital inflow during this period, to which this discussion returns.
Figure 2.4 Growth rate of economic activity, Organization for Economic
Cooperation and Development (OECD) countries, 1970-86 (per cent) 10
8 6 4
— 2
I 0
Ö -2 cu-4
-6 -8 -10
1970 1972 1974 1976 1978 1980 1982 1984 1986
Year
Source: International Monetary Fund, World Economic and Financial Survey, Washington EXT, 1987.
Figure 2.5 Balance of trade as a percentage of gross national product (GNP), Philippines, 1950-88 (per cent)
[image:41.550.81.480.465.694.2]The above external factors were associated with the country's deteriorating terms of trade (Figure 2.6). This was also accompanied the decline in the international cost of capital (Figure 2.7). Like many developing countries, the very low and periodically negative real interest rates in the 1970s enabled the Philippines to obtain substantial amount of foreign loans. However, the increased foreign borrowing enabled the favored groups of the government to undertake inefficient projects and hence, debt service payments increased. These were aggravated by the unforeseen rise in borrowing rates in the 1980s (Figure 2.7), precipitating a balance of payments (BOP) crisis.
Figure 2.6 Terms of trade, Philippines, 1950-85 (1972=100)
170 150
-no
Figure 2.7 Real international interest rate, 1965-90 (per cent)
Oh 0
-Note: Real interest rate is calculated as the London interbank offered rate (LIBOR) minus inflation as measured by the US GNP deflator.
Source: International Monetary Fund, International Financial Statistics Yearbook, Washington DC (various issues).
Trade and Industrial Policies
Industrialization has been a major development goal for the Philippines since its independence, yet the pace of industrialization has been slow by comparison with the ASEAN countries. This section examines the different trade regimes the country had undergone during the last four decades and how they have affected the economic growth and structure of the economy.
Import substitution, 1950-69. In response to a severe balance of payments (BOP) problem in 1949 brought about by expenditure on imports for reconstruction and rehabilitation after the war, the Philippine government imposed import and foreign exchange controls. Although import controls were originally intended to run for a year, they became permanent instruments in 1950. The emphasis shifted from solely BOP considerations to domestic industry protection to foster import substitution. Restrictions on imports were made in such a way that more foreign exchange was allocated to the import of 'essential' goods such as capital and intermediate goods and less to 'non-essential' finished consumer goods. Controls were also accompanied by the overvaluation of the Philippine peso arising from the maintenance of the pre-war exchange rate of P2 to $US1 (Power and Sicat 1971; Baldwin 1975; Bautista, Power and Associates 1979).
imperfectly competitive behavior were fostered.
The increasing dependence of domestic industries on imports and the inability of the country to stimulate exports worsened the trade deficits in the late 1950s and prompted the government to lift import controls and devalue the currency. Nonetheless, decontrol and devaluation were accompanied by fiscal incentives to the favored industries. Such incentives, embodied in the Basic Industries Act (RA 3127) and Investment Incentives Act (RA 5186), included tax exemptions, tax credits and tax deductions. In addition, tariffs, although introduced in 1957, became the main instruments of protection. The tariff structure had the same protective effects as the control system, that is, bias in favor of consumer goods relative to capital and intermeditate goods (Table 2.12) and bias against exports and agriculture (Table 2.13). Hence, the same resource allocation that the controls had encouraged was perpetuated by the tariff structure that replaced them.
Table 2.12 Average effective protection rates, by end use, Philippine manufacturing, 1961,1965 and 1974 and 1985 (p er c e n t)
1961 1965 1974 1985
Consumption goods 64 70 77 42
Intermediate goods 25 27 23 33
Inputs into construction 49 55 16 31
Capital goods 16 16 18 25
Total manufacturing 46 51 44 36
Tabic 2.13 Average effective rates of protection by sector, Philippines, 1965, 1974,1979 and 1985 (per cent)
Sectors 1965 1974 1979 1985
Agriculture and primary 17* 9 1 -1
Manufaturing 51 44 40 23
Exportables .. .. 1 1
Importables •• •• 58 33
All sectors (average) .. 36 24 12
Exportables -19** 4b -3 -3
Importables •• 61c 44 25
aAgriculture only. ^Exports ^on-exportable
Sources: Power, J. and Sicat, G., The Philippines: Industrialisation and Trade Policies, Oxford University Press, London, 1971:99, Table 4.9 and Table 4.10; Tan, N., The structure of protection and resource flows in the Philippines', in Bautista, Power and Associates, Industrial Promotion
Policies in the Philippines, Philippine Institute for Development Studies, Manila, 1979:144, Table 4;
Power, J. and Medal la, E., Trade liberalization in the Philippines: assessment of progress and agenda for future reform', PIDS Working Paper No. 86-01, Manila, 1986:27, Table 4.
Export promotion, 1970-1979. Another BOP crisis occurred in the late 1960s. The policy response was again a devaluation of the peso but this time it was combined with a shift to an outward-oriented industrial strategy. The latter was made more explicit with the passing of the Export Incentives Act (RA 6135) in 1970 that granted exporters with more fiscal incentives in addition to those specified in RA 5186 (Bautista and Power 1979; Gregorio 1979; Alburo and Shepherd 1985).
Table 2.14 Proportional rates of change in the user costs of capital and labor, BOI registered firms, Philippines (per cent)
% change User cost of capital
RA 5186
New project -39 to -42
Expansionary project -49 to -71
RA 6135
New project -15 t o -18
Expansionary project -30 to -44
Cost of labor
Non-exporting firm, RA 5186 -4
Exporting firm, RA 5186 or 6135 -22
Source: Gregorio, M., 'An economic analysis o f the effects o f Philippine fiscal incentives for industrial promotion', in Bautista, Power and Associates, Industrial Promotion Policies in the Philippines, PIDS, Manila, 1979:209.
The government also designed an export financing scheme to ensure access to finance by exporters, especially small and infant exporters, given the imperfections in the country's financial market. However, the financing scheme failed in providing exporters with easy access to finance (World Bank 1987b). There was discrimination between large and small/infant exporters. Export processing zones (EPZ) were also established but the social and economic costs of establishing and maintaining the zone exceeded the benefits derived (Warr 1985). The exchange rate also gradually rose throughout the decade after the devaluation in 1970, reaching P7.38 to $US1 in 1979 but the exchange rate was still overvalued, as reflected in the
Figure 2.8 Nominal exchange rate, 1960-82 (P/$US)
4
1960 1962 1964 1966 1968 1970 1972 1974 1976 1978 1980 1982
Official rate
Black rate
Year
Source: Intal, P. and Power, J., Trade, Exchange Rate and Agricultural Pricing Policies in the Philippines, World Bank, Washington DC, 1990.
On top of all these export incentives, however, was the distorted tariff structure. No attempt was made to eliminate or improve the tariff system (Bautista 1989). Quantitative restrictions on imports were reintroduced and even increased in the 1970s (Power and Medalla 1986). Since the main source of the bias was not eliminated under the new trade regime, it was not surprising that the old industrial structure was preserved in the 1970s. The bias in favor of manufacturing, especially consumption goods, continued while exports and agriculture were penalized (Tables 2.12 and 2.13).
international financial organizations like the World Bank (WB) and the International Monetary Fund (IMF) to call for structural reforms. New lending arrangements for structural adjustment loans from the WB, for example, required policy reforms that fostered efficiency in resource allocation.
In the Philippines, the social and economic unrest was magnified by the deteriorating leadership effectiveness of the Marcos administration. Internal pressure groups, led by academic and government technocrats, lobbied for reforms. The need for industrial reforms were initially spelt out in studies conducted by the International Labor Organization (International Labor Office 1974) and the World Bank (Cheetham 1976). Both studies strongly recommended trade liberalization and expansion of exports, especially of labor intensive manufactures, to revive the stagnating economy. Specific recommendations included the removal of the fiscal incentives, gradual removal of import restrictions and the reduction of tariff rates. Although these recommendations were made in the early 1970s and could have redirected the growth of the economy if implemented at that time, they were undermined by government officials who were members of the boards of directors of protected industries (Bautista 1989).
aggravating the BOP crisis.
The fciriff reform program (TRP) which began in 1981 was the central element of the trade policy reform. The program aimed to reduce tariff rates and establish more uniform tariff levels over the period 1981-85. (Power and Medalla 1986; Alburo and Shepherd 1986; Fabella 1989). The TRP was completed largely on schedule in 1985. Nevertheless, the escalating tariff structure remained the same (Tables 2.12 and 2.13). The program failed to increase the low effective protection rate (EPR) of the penalized sectors, agriculture and exports.
The import liberalization program, on the other hand, was designed to gradually remove import restrictions on regulated commodities and on banned nonessential or unclassified consumer goods. Regulated commodities are those that required prior approval from the government before importation. The liberalization of the banned items was completed almost on schedule (Power and Medalla 1986). However, the removal of restrictions on regulated commodities never occurred. The implementation was interrupted in 1983 by the political turmoil arising from the assassination of the government opposition leader, Benigno Aquino. Foreign exchange and import controls were imposed in response to yet another balance of payments crisis. In fact, the system of trade controls became even more distortionary. The number of regulated items increased and the system of approval of imports became more restrictive with foreign exchange rationing, thus the liberalization of the banned items was offset
Industry reforms were also undertaken. In 1983, under Batasang Pambansa
391 (Republic Act), value added rather than investment or measured capacity became the criterion for granting tax privileges and other incentives. In 1987, however, the Omnibus Investment Code was passed whereby incentives to industries were once again based on investment and measured capacity, signalling the return to emphasis on capital intensive industrialization in the 1990s (Fabella 1989).
The government, through the Ministry of Trade and Industry (MTT), also embarked in the early 1980s on promoting eleven industrial projects which were large-scale, capital-intensive and heavily foreign debt-financed. These projects included a copper smelter, a phosphate fertilizer plant, diesel engine manufacturing, a cement industry, a coco-chemical plant, an aluminum smelter, integrated pulp and paper, a petro chemical complex, heavy engineering industries, an integrated steel project and an alcogas distillery. Some of these industries needed imported raw materials, but those that relied on domestic raw materials were allowed to purchase them at prices fixed by the government below world prices. This not only taxed the producers of domestic raw materials but also contradicted the trade liberalization objectives of attaining efficiency and international competitiveness. Despite these deficiencies, the MTI did not shelve the projects prior to the 1983 BOP crisis, an indication of the ministry's strong influence in policy making (Bautista 1989).
loans during the 1970s relieved pressure on the country's international reserves until
the early 1980s and thus prevented the currency from depreciating.
Complete liberalization o f the trade regime was not attained. Nevertheless,
the liberalization program was considered by Bautista (1989) to be the most
significant attempted so far in the country. Various interest groups with conflicting
interests had to be considered Advocates of free trade had always lobbied for a
liberalized trade regime. On the other hand, the business class, whose interests had
always been safeguarded by the Marcos regime, naturally resented the move for
reforms. W ithin the government bureaucracy itself, there also existed strong
opposition, much stemming from self-interest Reforms meant loss o f jobs for some
and o f bureaucratic power for others. The ministries potentially affected naturally
adopted very rigid positions on liberalization. In the end, vested interests won and
Effects of trade and industrial regimes
(i) Output structure and growth. The response of economic growth to changing trade regimes was marked by periods of high growth, particularly in the manufacturing sector, during the first two or three years of each regime. These were followed by a decline that signalled the next change of policies (Figure 2.9).
The trade and industrial policies affected the relative prices in each sector and hence, the pattern of production. The price and profit incentives which favored protection of industry, particularly manufacturing, drew resources towards this sector and resulted in its high growth performance at the expense of the agriculture and services sectors.
Table 2.15 Distribution of real manufacturing output by industry group, Philippines, 1956-89 (per cent)
Industry 1956 1960 1970 1975 1980 1985 1989
Food, beverages and tobacco 44 41 46 44 44 48 44
Garments, textiles and footwear 9 8 9 9 9 9 11
Wood and paper products 11 10 6 6 6 6 6
Chemicals 10 10 6 9 10 8 7
Petroleum and coal products a a 7 8 6 5 5
Minerals 9 12 11 10 11 10 11
Transport equipment 2 2 4 4 4 1 1
Machinery 2 4 8 7 8 9 11
Miscellaneous manufactures 12b 12b 3 3 3 4 4
included in miscellaneous manufactures. ^Includes petroleum and coal products.
Note: 1956 and 1960 were measured at 1938 prices; the rest of the figures were measured at 1972 prices.
Sources: National Economic and Development and Authority, Philippine Statistical Yearbook,
Manila (various issues); National Statistical Coordination Board, Philippine Statistical Yearbook,
Manila, 1988; Baldwin, R., Foreign Trade Regimes and Economic Development: The Philippines,
Columbia University Press, New York, 1975:124, Table 6.2.
Table 2.16 Average annual growth rates of real manufacturing output by industry, Philippines, 1956-89 (per cent)
Industry 1956-60 1960-70 1970-80 1980-85 1980-89
Food, beverages and tobacco 4.4 11.4 6.0 0.4 1.9
Garments, textiles and footwear 3.2 11.7 6.1 -1.2 3.6
Wood and paper products 4.0 3.4 6.0 -1.9 1.5
Chemicals 6.2 3.8 13.1 -6.3 -3.0
Petroleum and coal products a a 4.7 -3.4 0.3
Minerals 14.2 9.4 5.8 -2.4 2.4
Transport equipment 6.4 16.6 7.2 -31.2 -12.5
Machinery 26.6 18.1 6.5 1.3 5.3
Miscellaneous manufactures 6.3b 8.3b 5.0 4.6 4.5
Total manufacturing 6.3 10.1 6.5 -1.5 1.7
included in miscellaneous manufactures. ^Includes petroleum and coal products.
Note: For 1956-1960, the percentage distribution from Baldwin (1975) were applied with the total manufacturing output from NEDA (1979) to get the output value uski in the growth estimation. Sources: National Economic and Development Authority, Philippine Statistical Yearbook, Manila (various issues); National Statistical Coordination Board, Philippine Statistical Yearbook, Manila,
1988.
The high dependence on imports in the development process is shown by the relatively high share of intermediate and raw materials and capital goods in total imports since 1949 (Table 2.17).
Table 2.17 Structure of imports, Philippines, 1949-87 (per cent)
Year Consumer goods Capital goods Intermediate and raw materials
1949 37 14 49
1955 26 21 53
1960 16 39 45
1965 22 37 41
1970 11 42 47
1975 16 33 51
1980 18 26 56
1987 30 18 52
Sources: National Economic and Development Authority, Philippine Statistical Yearbook, Manila (various issues); National Statistical Coordination Board, Philippine Statistical Yearbook, Manila, 1988.
Tabic 2.18 Average annual growth rate of real merchandise exports, Philippines 1950-88 (per cent)
Period Growth rate Period Growth rate
1950-60 5.8 1970-80 7.4
1960-70 10.5 1980-88 2.4
Note: Merchandise exports at current prices were deflated by the GNP deflator (1972 = 100).
Source: International Monetary Fund, International Financial Statistics Yearbook, Washington DC, 1989 and 1990.
Because trade policies were biased against exports, especially manufacturing exports, the country relied heavily on traditional exports such as sugar and coconut products (Table 2.19). These commodities go to volatile international market characterized by price instabilities and hence, make the economy more vulnerable to BOP crises.
Table 2.19 Distribution of exports by commodity group, Philippines, 1955-87 (per cent)
Commodity 1955 1960 1965 1970 1975 1980 1987
Coconut products 36 33 34 19 20 14 10
Sugar and sugar products 26 25 18 17 27 11 1
Forest products 11 18 24 26 11 8 5
Mineral products 7 7 9 20 14 18 4
Fruits and vegetables 1 5 2 3 5 6 7
Abacca products 7 8 3 2 1 1 1
Tobacco products 1 1 2 1 2 1 0
Mineral fuel and lubricants 0 0 1 2 2 1 1
Chemicals 0 0 0 0 1 2 4
Textiles 1 1 1 0 1 1 1
Miscellaneous manufactures 9 3 5 10 16 38 62
Re-exports 1 - - - - 1 3
Sources: National Economic and Development Authority, Philippine Statistical Yearbook, Manila (various issues).
Commodities need not be a constraint for the growth of industries if only domestic savings are high. Going back to the accounting identity discussed earlier, investment can be financed by domestic savings (private and government) with constant export surplus. In the Philippines, exports were below imports (Table 2.20). Up until 1980, savings in the country were moving in the same trend as Thailand (Table 2.21). In
1989, however, it was more comparable with some of the Latin American countries.
Table 2.20 Resource balance as a percentage of GDP, ASEAN, 1960,1976,1980 and 1989 (per cent)
Sector Philippines Indonesia Malaysia Singapore Thailand
1960 13 -14 -2
1976 -6 2 10 -12 A
1980 -5 8 3 -13 -5
1989 -1 2 4 8 -2
Note: Resource balance is defined as exports of goods and services minus imports of goods and services.
Source: World Bank, World Development Report, Oxford University Press, New York (various issues).
Table 2.21 Gross domestic savings as a percentage of GDP, selected countries, 1960,1976,1980 and 1989 (per cent)
Country 1960 1976 1980 1989
Indonesia 8 25 30 37
Malaysia 27 32 32 34
Singapore -3 29 30 43
Thailand 14 22 22 29
Philippines 16 25 25 18
Argentina 21 25 19
Brazil 21 23 20 26
Chile 25 15 16 24
Mexico 18 24 26 18
Fiscal Policies
A prudent fiscal policy is necessary for a stable macroeconomic environment. Taxes and government expenditures affect the allocation of resources. On the other hand, the mode of financing budget deficits affects key economic variables such as exchange rate, inflation rate and interest rate.