1.3 mm Wavelength VLBI of Sagittarius
A*: Detection of Time-Variable
Emission on Event Horizon Scales
The Harvard community has made this
article openly available.
Please share
how
this access benefits you. Your story matters
Citation
Fish, Vincent L., Sheperd S. Doeleman, Christopher Beaudoin, Ray
Blundell, David E. Bolin, Geoffrey C. Bower, Richard Chamberlin, et
al. 2011. “1.3 mm Wavelength VLBI of Sagittarius A*: Detection of
Time-Variable Emission on Event Horizon Scales.” The Astrophysical
Journal 727 (2) (January 10): L36. doi:10.1088/2041-8205/727/2/l36.
Published Version
10.1088/2041-8205/727/2/l36
Citable link
http://nrs.harvard.edu/urn-3:HUL.InstRepos:32086436
arXiv:1011.2472v1 [astro-ph.GA] 10 Nov 2010
1.3 mm WAVELENGTH VLBI OF SAGITTARIUS A*: DETECTION OF TIME-VARIABLE EMISSION ON EVENT HORIZON SCALES
VINCENTL. FISH1, SHEPERDS. DOELEMAN1, CHRISTOPHERBEAUDOIN1, RAYBLUNDELL2, DAVIDE. BOLIN1,3, GEOFFREYC. BOWER4, RICHARDCHAMBERLIN5, ROBERTFREUND6, PERFRIBERG7, MARKA. GURWELL2, MAREKIHONMA8, MAKOTOINOUE9,
THOMASP. KRICHBAUM10, JAMESLAMB11, DANIELP. MARRONE12,13, JAMESM. MORAN2, TOMOAKIOYAMA8, RICHARD
PLAMBECK4, RURIKPRIMIANI2, ALANE. E. ROGERS1, DANIELL. SMYTHE1, JASONSOOHOO1, PETERSTRITTMATTER6, REMOP. J. TILANUS7,14, MICHAELTITUS1, JONATHANWEINTROUB2, MELVYNWRIGHT4, DAVIDWOODY11, KENH. YOUNG2, LUCYM.
ZIURYS6
Draft version November 11, 2010
ABSTRACT
Sagittarius A*, the ∼ 4×10⁶ M⊙ black hole candidate at the Galactic Center, can be studied on
Schwarzschild radius scales with (sub)millimeter wavelength Very Long Baseline Interferometry (VLBI). We report on 1.3 mm wavelength observations of Sgr A* using a VLBI array consisting of the JCMT on Mauna Kea, the ARO/SMT on Mt. Graham in Arizona, and two telescopes of the CARMA array at Cedar Flat in California. Both Sgr A* and the quasar calibrator 1924−292 were observed over three consecutive nights, and both sources were clearly detected on all baselines. For the first time, we are able to extract 1.3 mm VLBI in-terferometer phase information on Sgr A* through measurement of closure phase on the triangle of baselines. On the third night of observing, the correlated flux density of Sgr A* on all VLBI baselines increased relative to the first two nights, providing strong evidence for time-variable change on scales of a few Schwarzschild radii. These results suggest that future VLBI observations with greater sensitivity and additional baselines will play a valuable role in determining the structure of emission near the event horizon of Sgr A*.
Subject headings: Galaxy: center — submillimeter: general — techniques: high angular resolution —
tech-niques: interferometric
1. INTRODUCTION
The case for linking Sgr A*, the radio source at the cen-ter of the Milky Way, with a supermassive black hole is very strong. Mass estimates inferred from stellar orbits, proper mo-tion studies that indicate Sgr A* is nearly momo-tionless, VLBI observations that reveal it is ultracompact, and short-timescale variability from radio to X-rays all point towards Sgr A*’s as-sociation with a∼4×10⁶M
⊙black hole (Reid 2009, and
ref-erences therein). At a distance of∼8 kpc, the Schwarzschild radius of this black hole subtends RSch∼10µas, making the
vfish@haystack.mit.edu
1Massachusetts Institute of Technology, Haystack Observatory, Route
40, Westford, MA 01886, USA
2Harvard-Smitshonian Center for Astrophysics, 60 Garden St.,
Cam-bridge, MA 02138, USA
3University of Arizona, Tucson AZ, 85721, USA
4University of California Berkeley, Dept. of Astronomy, Radio
Astron-omy Laboratory, 601 Campbell, Berkeley, CA 94720-3411, USA
5Caltech Submillimeter Observatory, 111 Nowelo St., Hilo, HI 96720,
USA
6Arizona Radio Observatory, Steward Observatory, University of
Ari-zona, 933 North Cherry Ave., Tucson, AZ 85721-0065, USA
7James Clerk Maxwell Telescope, Joint Astronomy Centre, 660 North
A’ohoku Place, University Park, Hilo, HI 96720, USA
8National Astronomical Observatory of Japan, Osawa 2-21-1, Mitaka,
Tokyo 181-8588, Japan
9Institute of Astronomy and Astrophysics, Academia Sinica, P.O. Box
23-141, Taipei 10617, Taiwan
10Max-Planck-Institut für Radioastronomie, Auf dem Hügel 69,
D-53121 Bonn, Germany
11OVRO, California Institute of Technology, 100 Leighton Lane, Big
Pine, CA 93513-0968, USA
12Kavli Institute for Cosmological Physics, University of Chicago,
5640 South Ellis Avenue, Chicago, IL 60637, USA
13Hubble Fellow
14Netherlands Organization for Scientific Research, Laan van Nieuw
Oost-Indie 300, NL2509 AC The Hague, The Netherlands
apparent size of its event horizon the largest that we know of. VLBI at (sub)millimeter wavelengths is ideally suited to observing Sgr A* on these angular scales. Previous 1.3 mm VLBI detections of Sgr A* on a Hawaii-Arizona baseline es-tablished the existence of coherent structures on scales of a few RSch(Doeleman et al. 2008).
Current 1.3 mm VLBI observations can be used to address two fundamental questions concerning the nature of Sgr A*. The first is whether the accretion flow surrounding Sgr A* exhibits an expected “shadow” feature that occurs due to the strong gravitational lensing near the black hole. Emission from the accretion flow is preferentially lensed onto the last photon orbit, resulting in a relatively dim central region en-circled by a brighter annulus (Falcke et al. 2000). A second question is whether the flaring behavior exhibited by Sgr A* has its origins in compact structures that arise near the black hole event horizon. Broadband flares on timescales ranging from minutes to hours are well-documented (Marrone et al. 2008; Yusef-Zadeh et al. 2009; Dodds-Eden et al. 2009) and imply time-variable structures in the innermost accretion re-gion. If small-scale variable structures are present, 1.3 mm VLBI can sensitively monitor the changing morphology of Sgr A* using non-imaging techniques with time resolutions of tens of seconds (Doeleman et al. 2009; Fish et al. 2009b).
We report on new 1.3 mm VLBI observations of Sgr A* us-ing a four-telescope array. These observations confirm event horizon scale structure within Sgr A*, impose new constraints on accretion models for Sgr A*, and reveal time-dependent variability on scales of a few RSch.
2. OBSERVATIONS
Sgr A* and several calibrator sources were observed with
four telescopes at three observatories: the James Clerk
2 Fish et al.
in Hawaii, the Arizona Radio Observatory’s Submillimeter Telescope (ARO/SMT; S) in Arizona, and two telescopes of the Combined Array for Research in Millimeter-wave Astron-omy (CARMA; C and D, located∼60 m apart) in California. On Mauna Kea, the Submillimeter Array (SMA) housed the VLBI recording system and synthesized the hydrogen maser based VLBI reference used at the JCMT. Masers at all sites were checked against ultra-stable crystals; combined losses due to maser instabilities and local oscillator decoherence are estimated to be.5%. Observations occurred over three nights: 2009 April 5–7 (days 95–97). Sources were observed in left circular polarization in two 480 MHz bandwidths cen-tered at 229.089 and 229.601 GHz (low and high bands). Data recorded at all sites was shipped to MIT Haystack Observa-tory in Westford, Massachusetts for processing on the Mark4 VLBI correlator. Once correlated, data for each scan (typi-cally 10–15 minutes) were corrected for coherence losses due to atmospheric turbulence and searched for detections using methods detailed in Doeleman et al. (2001, 2008). Atmo-spheric coherence times ranged from a few to∼20 s, depend-ing on weather conditions at each telescope.
3. CALIBRATION
The VLBI correlation coefficient for each baseline was multiplied by the geometric mean of the System Equivalent Flux Density (SEFD) of both antennas. The SEFD is a prod-uct of antenna gain (Jy/K) and the opacity-corrected system temperature, which was measured just prior to each VLBI scan using a vane calibration technique that corrects for the at-mosphere. For the JCMT and ARO/SMT, antenna gains were determined from observations of planets at several points dur-ing the multiple day campaign, and the gains were observed to be stable. Relative gains for the two CARMA dishes were estimated using observations taken by CARMA in interfero-metric array mode before each VLBI scan, and the gains were then set to a common flux scale using planet scans at the end of each night.
The flux densities of all VLBI targets (Sgr A*, 1924−292,
M87, 3C273, 3C345, 1733−130, 3C279, 0854+201) were
measured with CARMA. For Sgr A*, data with baselines shorter than 20 kλwere discarded to filter out extended emis-sion in the Galactic center. The measured flux densities of all sources increased from day 95 to day 96 and from day 96 to day 97. We attribute this systematic trend to errors in the planet calibrations made shortly after sunrise, when an-tenna focus, pointing offsets, and atmospheric coherence typ-ically change. The flux density measured for the calibrator 1924−294, observed over the same time and elevation ranges as Sgr A*, was 9.95, 10.21, and 10.75 Jy on days 95, 96, and 97. We normalized CARMA gains to a constant flux density of 10.25 Jy on all three days. The resulting measured flux den-sities for Sgr A* are 3.03, 3.16, and 3.61 Jy on days 95, 96, and 97, respectively. We adopt these fluxes for all subsequent analysis.
As shown in the upper panels of Figures 1 and 2, there are still noticeable variations in the correlated flux densities even after renormalizing the day-to-day flux scales. These residual calibration errors and amplitude variation can be corrected for by making three simplifying assumptions that allow us to use standard “self-calibration" techniques. First, the flux densities of detections in the low and high bands, which differ by only 0.2% in frequency, are assumed to be equal in each scan. Sec-ond, flux densities on the SC and SD baselines are assumed to be equal. While one could in principle require that JC and
JD flux densities be equal as well, the signal-to-noise ratio (SNR) is generally much lower on the JC and JD baselines than on the shorter VLBI baselines (SC and SD), since both 1924−292 and Sgr A* are more resolved on longer baselines. Third, CARMA antenna gains are adjusted to make the cor-related flux density on the CD baseline (with a fringe spacing measured in arcseconds) equal to the total flux density mea-sured each night by CARMA. This final constraint enforces a constant source flux density over the duration of each night of observation. While some of the observed variation in Sgr A* over the course of a night may be due to intrinsic variabil-ity, the 1924−292 data exhibit similar scatter, suggesting that calibration errors may dominate over source variability. Com-bined, these assumptions result in a closed-form solution for gain-correction coefficients for telescopes C, D, and S in each band. Henceforth, we will use the term “gain-corrected” to refer to flux densities that have been multiplied by these gain-correction coefficients. We note that if the total flux density (CD) is varied, the SJ flux densities are unchanged while other flux densities vary as the square root of the factor.
The quasar 1924−292 was easily detected on all baselines
(Table 1). On each scan, low-band and high-band fluxes
after a-priori calibration track each other consistently (Fig-ure 1). After gain correction assuming a total flux density of 10.25 Jy, the data from all three days are highly consis-tent with one another. The SC and SD baselines show con-sistent variation in the correlated flux density that is repeated each day. The long-baseline detections (SJ, JC, and JD) also show day-to-day repeatable behavior, indicating detection of stable source structure presumably associated with a jet (Shen 1997). The consistency of these data demonstrates the validity of the gain-correction technique. Based on the statistics of the data on scans of 1924−292, systematic errors are estimated to
be∼5%.
4. RESULTS
We report the first 1.3 mm VLBI detections of Sgr A* on Hawaii-California baselines with correlated flux densi-ties for several scans of&400 mJy on the JC and JD base-lines during day 96 (Figure 2). Nondetections on the JC and JD baselines on day 95 are attributable to the higher opac-ity at the JCMT on that day. The robust detections on the long (Hawaii-Arizona and Hawaii-California) baselines con-firm the detection of event horizon scale structure reported in Doeleman et al. (2008).
Because Sgr A* was detected on baselines between all three sites, we are able to measure closure phase: the sum of inter-ferometric phase around a closed triangle of baselines. This quantity is relatively immune to calibration errors and in gen-eral provides important constraints on source structure. On the CARMA-ARO/SMT-JCMT triangle, the phase closures on Sgr A* for day 96 (5 independent measurements) were computed using 10-second coherent integrations, which were averaged over full 10-minute VLBI scans to increase SNR (Rogers et al. 1995). Because of the relatively low SNR on the long baselines to the JCMT, it is only possible to say that the closure phases are consistent with a value of zero with a variation of±40◦.
4.1. Variability
The arcsecond-scale flux density of Sgr A* on days 95 and 96 is the same to within uncertainties in the flux scale, but on
FIG. 1.— Top: Observations of 1924−292. Detections are color-coded by baseline. Squares indicate low-band data and circles indicate high-band data. The day 97 a-priori calibration is noticeably poorer at CARMA. Bottom: Same, after gain correction. Errorbars include a 5% systematic component. The gain-corrected data exhibit much higher day-to-day repeatability. The red dashed line shows the assumed CD flux (the associated flux scale uncertainty is∼5%, modulo
uncertainties in planet fluxes). Gain-corrected SC and SD data are equal by definition.
brightening is accompanied by changes on VLBI scales as well. First, the SC/CD and SD/CD flux density ratios are higher on day 97 than on days 95 and 96 (Figure 2). Sec-ond, there are more Hawaii-California detections during day 97, and the apparent flux densities on these baselines are on average higher than on day 96. Third, the flux densities on the SJ baseline are also larger on day 97. These differences are consistent with an episode of variability in Sgr A* dur-ing which the small-scale structure increased in flux density between days 96 and 97.
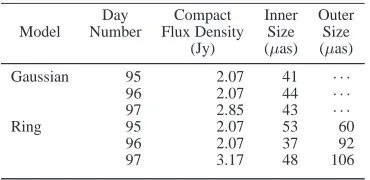
4.2. Geometrical Models of the Structure of Sgr A* Though our data are better calibrated than in the previ-ous epoch (Doeleman et al. 2008), the structure of Sgr A* is poorly constrained because millimeter VLBI detections of Sgr A* remain limited in terms of baseline length and orien-tation. As a result, many models can be made to fit the data: extended double sources, large rings, combinations of large-and small-scale components, etc.
Nevertheless, with the caveat that this small dataset should not be overinterpreted, it is instructive to investigate the two classes of models originally considered by Doeleman et al. (2008) to fit the 1.3 mm VLBI data obtained in 2007: cir-cular Gaussians and rings. All of the 2007 data points could be fitted by a single Gaussian component. In contrast, we note a loss of∼1 Jy of correlated flux density between the connected-element (CD) and SC/SD baselines (Figure 3). In the context of Gaussian models of emission on RSch scales,
this suggests the existence of additional variable structure on
scales between those probed by the SC/SD (a few hundred microarcseconds) and the CD (a few arcseconds) baselines.
We adopt this assumption to estimate the size of the inner accretion flow in Sgr A*. Effectively, this reduces to fitting all of the VLBI data excluding the CD data points. For the Gaus-sian model, the best fits imply a flux density of 2.07+0.14
−0.15 Jy
and a size of 41.3+−54..43µas (FWHM; errors are 3σ) on day 95 and 2.07+0.19
−0.19Jy and 44.4+ 3.0
−3.0µas on day 96 (Figure 3 and
Ta-ble 2). These values are consistent with the single compact component Gaussian fit of Doeleman et al. (2008), who esti-mated a flux density of 2.4±0.5 Jy and a size of 43+14
−8 µas
(before deconvolution of the expected interstellar scattering; 37µas unscattered) for the 230 GHz emission. On day 97, the best fit model has a much higher flux density of 2.85+0.29
−0.28 Jy
but a similar FWHM of 42.6+−32..19 µas. Despite the increase in flux density observed on day 97, the diameter of the fit-ted compact component in Sgr A* on that day is identical (to within the errors) to the values for the size obtained on days 95 and 96.
4 Fish et al.
FIG. 2.— Same as Figure 1 but for Sgr A*. Only scans for which detections are seen in both bands on the CD, SC, and SD baselines are shown.
whether a significant correlation exists between the flux den-sity and size of the emission in Sgr A* (Bower et al. 2004; Lu et al. 2010). However, the size of the emission at these wavelengths is dominated by interstellar scattering effects.
Future 1.3 mm VLBI observations with higher sensitivity, sufficient to robustly measure the closure phase, will be an important discriminant between these and other models. For example, an elliptical Gaussian distribution will result in zero closure phase on any triangle of baselines, while a ring model can result in closure phases of 180 degrees depending on the orientation and length of the array baselines. The ring mod-els shown in Figure 3 all have closure phases of zero on the CARMA-ARO/SMT-JCMT triangle of baselines, consistent with the measured closure phases (Section 4). However, a
ring model with a null near 3.4 Gλbetween the
CARMA-JCMT and ARO/SMT-CARMA-JCMT baselines, would produce a clo-sure phase of 180 degrees, which is strongly ruled out by the April 2009 data. Measurement on an intermediate baseline in the 1−2 Gλrange would provide a powerful discriminant between large classes of geometrical models.
5. DISCUSSION
5.1. Implications for Accretion and Flare Models The flux density of Sgr A* on VLBI scales is seen to in-crease from day 95/96 to day 97. During the first∼1 hour on day 97, when the atmosphere at CARMA was relatively sta-ble, the data are consistent with a constant flux density, sug-gesting that the flux density increased before observations on day 97 but held steady at a higher level than on the previous nights. This behavior is consistent with other (sub)millimeter
observations, which show variability punctuated with peri-ods when the flux density is stable (e.g., Marrone et al. 2006; Yusef-Zadeh et al. 2009; Kunneriath et al. 2010).
The flux density increase appears to be due to an event that establishes a new steady-state in Sgr A*. If instead the flux density increase is due to a short-duration event that con-cluded before the start of observations on day 97, the un-changing size of the compact region (as implied by Gaussian models in Section 4.2) and the timescale over which the com-pact flux density is seen to be constant limits the expansion speed of the region to be highly nonrelativistic (v.0.05c, consistent with Lu et al. 2010) and much lower than the sound speed (c/√3) (Marrone et al. 2008), in contrast with relativis-tic jet models (e.g., Falcke et al. 2009). While a low expan-sion speed is predicted by adiabatically-expanding plasmon models (Yusef-Zadeh et al. 2009), these models also predict an increase in source size. Our observations detect Sgr A* after the increase in flux density has occurred, but we do not find evidence of an increase in source size as predicted by adiabatic expansion. Future, more sensitive observations of Sgr A* before, during, and after a flare event will be neces-sary to more fully understand the mechanism responsible for variability in Sgr A*.
5.2. Physical Models of the Structure of Sgr A*
incli-FIG. 3.— Correlated gain-corrected flux density plots. Solid lines show best-fit circular Gaussian models of the compact emission in Sgr A* and are consistent with a source size of approximately 43µas on all days. The dotted lines show the best ring model fits to Sgr A* data.
nation of the disk and the spin of the black hole. Radia-tively inefficient accretion flow models and some general relativistic magnetohydrodynamic simulations found that the Doeleman et al. (2008) data were already sufficient to rule out a low-inclination (i.e., nearly face-on) disk (Broderick et al. 2009; Mo´scibrodzka et al. 2009). Low-inclination disk mod-els are qualitatively similar to the ring model in Section 4.2, with a “null” in the correlated flux density as a function of baseline length whose depth decreases with increasing disk inclination (Dexter et al. 2009; Fish et al. 2009a). The loca-tion of this null as a funcloca-tion of baseline length is set by the ratio of the mass of the black hole and the distance to Sgr A*, which is determined to within a few percent (Ghez et al. 2008; Gillessen et al. 2009).
Emission in high-inclination models is dominated by the highly Doppler-boosted approaching side of the disk. High-inclination disk models exhibit a monotonic decrease in flux density as baselines approach the length of the SJ baseline, with long-baseline correlated flux densities highly dependent on the orientation of the disk in the plane of the sky. The decline of correlated flux density with baseline length from Hawaii-California to Hawaii-Arizona baselines requires that the inclination be&40◦in several disk models that were
con-sistent with the 2007 data (Dexter et al. 2009; Broderick et al. 2009). The impact of the 2009 Hawaii-California detections on the 2007 fits is to strengthen the constraint on inclination in these models (e.g., Broderick et al., private communication).
6. SUMMARY
VLBI observations of Sgr A* at 1.3mm wavelength in 2009 have robustly confirmed the detection of Schwarzschild
ra-dius scale structures reported in Doeleman et al. (2008). On the third of three days of observations, the total flux density
of Sgr A* was observed to have increased by∼17%,
indi-cating an episode of variability similar to those described in multi-wavelength monitoring campaigns (e.g., Marrone et al. 2008; Yusef-Zadeh et al. 2009). The VLBI data support a pic-ture in which this flux density increase is due to a brightening of structure on scales of only a few RSch. Having achieved
the dual technical milestones of successfully detecting closure phase and developing robust methods of amplitude calibra-tion, it is clear that future (sub)millimeter VLBI observations with higher sensitivity and many more baselines will be able to powerfully constrain models of Sgr A* on event horizon scales.
High-frequency VLBI work at MIT Haystack Observatory is supported by grants from the National Science Foundation (NSF). ARO receives partial support from the NSF ATI pro-gram. The Submillimeter Array is a joint project between the Smithsonian Astrophysical Observatory and the Academia Sinica Institute of Astronomy and Astrophysics and is funded by the Smithsonian Institution and the Academia Sinica. Funding for ongoing CARMA development and operations is supported by the NSF and the CARMA partner universities. DEB acknowledges support from the NSF Research Experi-ences for Undergraduates program.
6 Fish et al.
REFERENCES Bower, G. C., Falcke, H., Herrnstein, R. M., Zhao, J.-H., Goss, W. M., &
Backer, D. C. 2004, Science, 304, 704
Broderick, A. E., Fish, V. L., Doeleman, S. S., & Loeb, A. 2009, ApJ, 697, 45
Dexter, J., Agol, E., & Fragile, C. 2009, ApJ, 703, L142 Dodds-Eden, K., et al. 2009, ApJ, 698, 676
Doeleman, S. S., et al. 2001, AJ, 121, 2610 Doeleman, S. S., et al. 2008, Nature, 455, 78
Doeleman, S. S., Fish, V. L., Broderick, A. E., Loeb, A., & Rogers, A. E. E. 2009, ApJ, 695, 59
Falcke, H., Markoff, S., & Bower, G. C. 2009, A&A, 496, 77 Falcke, H., Melia, F., & Agol, E. 2000, ApJ, 528, 13
Fish, V. L., Broderick, A. E., Doeleman, S. S., & Loeb, A. 2009a, ApJ, 692, L14
Fish, V. L., Doeleman, S. S., Broderick, A. E., Loeb, A., & Rogers, A. E. E. 2009b, ApJ, 706, 1353
Ghez, A., et al. 2008, ApJ, 689, 1044
Gillessen, S., Eisenhauer, F., Trippe, S., Alexander, T., Genzel, R., Martins, F., & Ott, T. 2009, ApJ, 692, 1075
Kunneriath, D., et al. 2010, A&A, 517, A46
Lu, R. S., Krichbaum, T. P., Eckart, A., König, S., Kunneriath, D., Witzel, G., Witzel, A., & Zensus, J. A. 2010, A&A, in press, arXiv:1010.1287 Markoff, S., Bower, G. C., & Falcke, H. 2007, MNRAS, 379, 1519 Marrone, D. P., Moran, J. M., Zhao, J.-H., & Rao, R. 2006, ApJ, 640, 308 Marrone, D. P., et al. 2008, ApJ, 682, 373
Mo´scibrodzka, M., Gammie, C. F., Dolence, J. C., Shiokawa, H., & Leung, P. K. 2009, ApJ, 706, 497
Noble, S. C., Leung, P. K., Gammie, C. F., & Book, L. G. 2007, Classical and Quantum Gravity, 24, 259
Reid, M. 2009, International Journal of Modern Physics D, 18, 889 Rogers, A. E. E., Doeleman, S. S., & Moran, J. M. 1995, AJ, 109, 1391 Shen, Z. -Q., et al. 1997, AJ, 114, 1999
[image:7.612.150.461.255.738.2]Yuan, F., Quataert, E., & Narayan, R. 2003, ApJ, 598, 301 Yusef-Zadeh, F., et al. 2009, ApJ, 706, 348
TABLE 1
GAIN-CORRECTEDDETECTIONS OF1924−292ANDSGRA*
Day UT Time u v Flux Density σ
TABLE 1
GAIN-CORRECTEDDETECTIONS OF1924−292ANDSGRA*
8 Fish et al.
TABLE 1
GAIN-CORRECTEDDETECTIONS OF1924−292ANDSGRA*
11 50 SC both -547 137 2.68 0.17 SJ low -3250 -1377 0.38 0.09 12 20 SC both -581 173 2.62 0.16 SJ low -3362 -1167 0.48 0.08 SJ high -3362 -1167 0.48 0.08 JC low 2781 1340 0.67 0.13 JC high 2781 1340 0.79 0.23 JD low 2781 1340 0.54 0.12 JD high 2781 1340 0.76 0.17 12 40 SC both -598 198 2.73 0.18 SJ low -3404 -1023 0.68 0.11 SJ high -3404 -1023 0.37 0.08 JD low 2807 1221 0.59 0.16 13 25 SC both -619 257 2.91 0.22 SJ low -3405 -697 0.41 0.09 JC low 2786 953 0.70 0.17 JD low 2786 953 0.67 0.17 13 40 SC both -621 276 2.94 0.28 SJ low -3375 -589 0.41 0.11
TABLE 2
MODELFITS TOSGRA* DATA
Day Compact Inner Outer Model Number Flux Density Size Size
(Jy) (µas) (µas) Gaussian 95 2.07 41 · · ·
96 2.07 44 · · ·
97 2.85 43 · · ·
Ring 95 2.07 53 60