White Rose Research Online URL for this paper: http://eprints.whiterose.ac.uk/86432/
Version: Accepted Version
Article:
Gleeson, HF, Miller, RJ, Tian, L et al. (2 more authors) (2015) Liquid crystal blue phases: stability, field effects and alignment. Liquid Crystals, 42 (5-6). pp. 760-771. ISSN
0267-8292
https://doi.org/10.1080/02678292.2014.1002821
[email protected] https://eprints.whiterose.ac.uk/ Reuse
Unless indicated otherwise, fulltext items are protected by copyright with all rights reserved. The copyright exception in section 29 of the Copyright, Designs and Patents Act 1988 allows the making of a single copy solely for the purpose of non-commercial research or private study within the limits of fair dealing. The publisher or other rights-holder may allow further reproduction and re-use of this version - refer to the White Rose Research Online record for this item. Where records identify the publisher as the copyright holder, users can verify any specific terms of use on the publisher’s website.
Takedown
If you consider content in White Rose Research Online to be in breach of UK law, please notify us by
Liquid Crystal Blue Phases: stability, field effects and alignment.
Helen F Gleeson 1, R J Miller1, L Tian1, V Gšrtzà2 and J W Goodby2
The School of Physics and Astronomy, The University of Manchester, Manchester M13 9PL, UK
The School of Chemistry, University of York, Heslingden, York YO10 5DD, UK
Abstract.
The blue phases are fascinating structures in liquid crystals, fluids with true
crystalline order. The blue phases were discovered in the 1970s and were the
subject of extensive research in the 1980s, when a deep understanding of many of
their properties was established. The discovery that the blue phases could be
stabilized to exist over wide temperature ranges meant that they became more than
scientific curiosities and led to a recent resurgence in research into them as they
offer some promise in applications. This paper considers some important aspects of
the blue phases that are recurrent topics in their research. It describes: factors
affecting blue phase stability, demonstrating on the role of the bend elastic constant;
field effects, including the Kerr effect, electrostriction and relaxation phenomena; and
alignment, in particular production and control of blue phase monodomains. The
dependence of these phenomena on the physical properties of the liquid crystalline
system, including the twist and bend elastic constants and the dielectric anisotropy is
emphasized wherever possible. The paper links work carried out in the 1980s with
contemporary research, using a few key examples to show how there is still much to
understand in this beautiful topic.
1. Introduction and historical perspective.
The first observation of a liquid crystal blue phase is sometimes attributed to Reinizer
who, according to correspondence with Lehmann, noticed a blue flash at the
transition between the two liquid phases in his pioneering experiment in 1888. In fact,
as with many other liquid crystal phases, George Gray played a key part in the
Author for correspondence
à
discovery of the blue phases as clearly distinct thermodynamic phases when he
published a systematic study of cholesteryl-based compounds in the 1950s1. This,
together with my enduring interest in the blue phases, has led me (HFG) to choose
this topic for this paper in memory of George.
George was responsible both for the discovery of blue phases in chiral materials not
based on cholesteryl-derivatives, as well as for naming these phases. Dave Coates,
a well-known liquid crystal chemist, worked with George in Hull in the 1970s,
synthesizing a series of chiral nematic materials that included the 2-methyl-butyl
chiral group. On asking Dave what the amorphous blue/gray texture was that he saw
in the polarizing microscope at the transition between the chiral nematic and
isotropic phase, Dave apparently told George ÔI donÕt know, but itÕs definitely blue!Õ.
The blue phases in these materials were reported in a key paper published in 19732
and the terminology Ôblue phaseÕ was born.
My own involvement with the blue phases came very early in my career and began
exactly 10 years after GeorgeÕs seminal paper on them. I was a fresh-faced
postgraduate student in 1983 working on a project studying the optical properties of
those same chiral nematic liquid crystals, invented at Hull. My supervisor, Harry
Coles, suggested that it might be interesting to investigate electro-optic effects in the
blue phases of the materials and I presented my first work on switching in the blue
phases at the International Liquid Crystal Conference in York in 1984. George Gray
was the Chair of the Conference, Harry was the Secretary and David Dunmur was
the Treasurer. I was privileged to get to know George well at a very early stage of my
research career; all of the postgraduate students got roped into helping at the
conference since in those days academics did all the work rather than conference
organizing bodies. It was a fantastic and fun experience, culminating in a boat race
on the lake at York in which most of us (including George) ended up extremely wet!
Two years later, George acted as my external PhD examiner and I was both
honoured and terrified - he was without doubt the best-known and most highly
respected chemist in liquid crystals. I should emphasise that he was never anything
other than kind and encouraging to young researchers and the fact that I thought his
responsibility for the terror on my shoulders! My work on blue phases had formed a
chapter of my thesis3 and included switching studies in blue phases I and II (BPI and
BPII) as well as the fog phase4, 5, 6. It was the last of these topics that caused my
next panic. George asked me what the difference was between the Ôfog phaseÕ and
the ÔGray phaseÕ. I was terrified Ð I was sure that they were the same thing but that
the ÔGray phaseÕ was terminology commonly used at the time to acknowledge
George who, after all, was responsible for the Ôblue phaseÕ terminology. I felt my
grasp on the PhD quickly slipping away. I had no option but to admit to what I
thought was a dreadful mistake on my part. George responded gently in his lovely
Scottish lilt ÔAh, thanks Helen, that clears up something IÕve been wondering about
for a whileÕ. I was awarded my PhD.
It is a privilege to be able to dedicate this paper to George who remained a
wonderful friend and supporter throughout my career. I have retained my fascination
with the blue phases since those early days and this paper considers features that
have remained important for more than 30 years now; factors affecting stability,
switching phenomena and alignment. This is not a review paper, but describes
selected research in each of these areas, hopefully offering some new insights as
well as a link between the past and present. My co-authors are past students of mine,
so are also part of GeorgeÕs extended research family.
2. Factors affecting blue phase stability; the role of elastic constants.
For the first couple of decades following their discovery, the blue phases were a
scientific curiosity because they were stable over only very narrow temperature
regimes (often as little as 0.1K and rarely more than 1K) Ð they were consequently
difficult to study and the prospect of applications was remote. The formation of cubic
phases from chiral molecules depends on frustration7, and it was clear from the
earliest theoretical and experimental studies that chirality was a key factor in
stabilizing the blue phases. Indeed, reasonably good agreement had been
established between theoretical and experimental phase diagrams, as described in
the review by Crooker in 19898. The blue phases are formed from double-twist
three dimensions will clearly involve chirality, the energy cost of forming the defects
will certainly include the other Frank elastic constants. Indeed, the expression for the
elastic energy of blue phases given by Meiboom et al9 includes the splay, twist, bend
and saddle-splay elastic constants (!
!!! !!!! !!! and !!∀ respectively) as well as the
chirality, !!. While the role of chirality was clear, it was increasingly obvious that
other parameters must be important; blue phases extending over ~4K were
observed in systems that had similar chirality to materials with more typical ranges of
stability of ~1K5.
Some work aiming to understand how the physical properties affected the blue
phase stability was undertaken in the 1990s10. Although it is impossible to measure
the elastic constants in the blue phases, measurements were made 2K below the N*
to blue phase transition in a range of related materials, allowing the influence of
different parameters to be compared. It is worth noting that measurements simply
made at room temperature cannot be used to infer anything about the blue phases
as all of the relevant physical parameters depend on the order parameter, and this
itself takes values depending on the temperature difference with respect to the
phase transition. While the dependence of blue phase stability on the pitch and twist
elastic constant in the underlying N* phase was of little surprise11, the influence of
other parameters was demonstrated for the first time10. Miller and Gleeson used
measurements of two different electric field thresholds in the N* phase to determine
both the twist and bend elastic constants, each 2K below the N* to blue phase
transition, figure 1. The relevant threshold equations are12, 13:
!!∀ !
!! !!!! !
! !!!!!!!
!!!!!!!!!
!!!!!!!∀ !
!!
!!
!
!!
!!!!!!!!!!!!!!!!!!!!!!!!!!!!!!!!!!!!!!!!!!!!
Here, !!!∀ and !!∀ are the field thresholds for the occurrence of periodic distortions
in the N* state and from the N* to unwound nematic state respectively; ! is the
sample thickness. The twist and bend elastic constants are !
!! and !!! respectively,
!! is the helicoidal pitch, while !!! !! and !! are the parallel and perpendicular
dielectric constants and the dielectric anisotropy of the system. Details of the
measurement of the physical parameters are described in Refs 10 and 11. The
equations were used to evaluate !!∀ in the past
11
and while the trends described
here remain the same, the absolute values of the twist elastic constant are slightly
different.
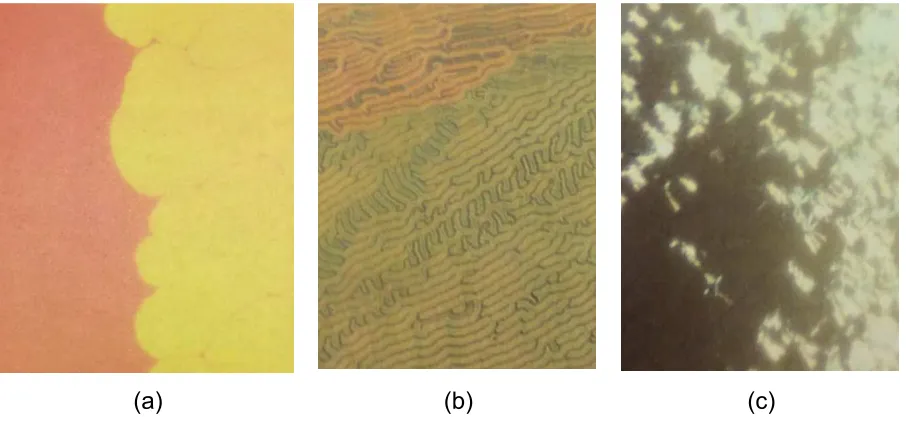
(a) (b) (c)
Figure 1. The visual appearance of (a) the undistorted N* state in a mixture comprising 20.1±0.2 mole percentage of CE2 in 4CB, (b) just above the threshold for
periodic distortion and (c) at the threshold to the unwound nematic state10.
Equations (1) are readily rearranged to allow the twist and bend elastic constants to
be deduced, making use of the relationship ! ! ! !:
!!!!
!!!!
!
!
!!!∀!
!!!! !
! !!∀ !
!!!!!!!!!
!!!!!!!!!∀!
!!!! !!!!!!!!!!!!!!!!!!!!!!!!!!!!!!!!!!!!!!!!
Miller evaluated the elastic constants for materials based on host nematics with 20
mole% of the chiral material CE2, 2K below the transition to the blue phase. The
host nematics selected were the nCB (cyanobiphenyl) materials with n=4, 5, 6 and 7,
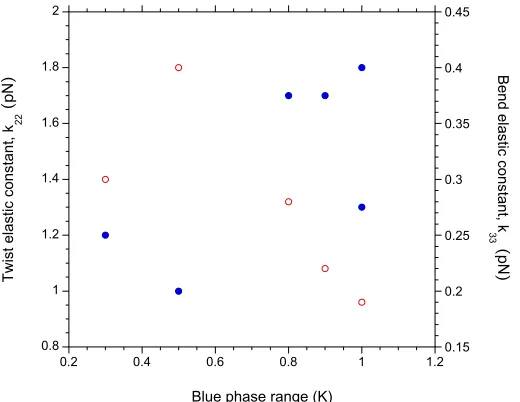
and PCHn (phenylcyclohexane) materials with n=4 and 5. Figure 2 shows the
relationship between the twist and bend elastic constants 2K below the transition and
the total blue phase range in each of these materials. It can be seen that the blue
phase range increases with !
!!, but decreases with increasing !!!.
[image:6.595.72.525.154.367.2]!
!! and !!!, respectively, may be understood simplistically in the context of the
double twist structure in the blue phases. Figure 2 shows that a larger value of !!! is
associated with a wider blue phase range. The free energy density around the
central axis of a double twist tube9 is reduced by increasing !
!!. Thus, increases in
!
!! make the double twist structure, and hence the blue phases, more stable with
respect to the N* phase; this is the result reported in Ref 11.
Figure 2. The twist and bend elastic constants, !
!! (closed, blue symbols) and !!!
(open, red symbols) determined for a series of material based on cyanobiphenyls
and phenylcyclohexane nematic hosts doped with the chiral liquid crystal CE210,11,
showing the correlations with blue phase range.
Figure 2 also shows a clear correlation between the blue phase stability and !!!,
such that a smaller value of !!! gives a wider blue phase. Again, some insight can
be gleaned by considering the double twist tube structure in more detail. The free
energy density increases rapidly away from the central axis due to increasing bend
distortions in the director field. This effect is noticeable even at distances of the order
of a one eighth turn of the helix, which is the radius of the double twist tubes
considered in the defect theory9. The total free energy of the double twist structure,
and hence the blue phases, is consequently reduced relative to the N* phase by a
reduction in !!! so that a smaller bend elastic constant would be associated with a
wider blue phase range. Again, this is reflected in figure 2.
Of course the blue phase structure also includes disclinations and any consideration
0.8 1 1.2 1.4 1.6 1.8 2 0.15 0.2 0.25 0.3 0.35 0.4 0.45
0.2 0.4 0.6 0.8 1 1.2
T w ist e la st ic co n st a n t, k 2 2 ( pN ) Be n d e la st ic co n st a n t, k 3
3 (
pN
)
[image:7.595.169.429.224.425.2]of the free energy must take into account the positive contribution these make to the
total free energy of the blue phase structures. This is proportional to (!
!!+!!∀),
where !
!∀ is the saddle-splay elastic constant. Irrespective of the value of !!∀, the
energy cost of forming the disclinations will tend to counteract the stabilizing effect of
increases in !
!! on the double twist structure. This means that the correlations seen
in figure 2 between !
!! and !!! and the blue phase stability would not be expected to
be simple and more sophisticated theoretical studies have offered further insights
into the role of the elastic constants. Alexander and Yeomans14 published a
theoretical analysis of the free energy of the blue phases using a modified
Landau-de Gennes approach which can accommodate a temperature-Landau-depenLandau-dent N* pitch
and demonstrated a strong dependence of the region of stability on the elastic
constants, though it should be noted that these were not the Frank elastic constants.
Theoretical approaches that describe the dependence of blue phase stability on the
various Frank elastic constants has been revisited recently by Fukuda15, who also
describes how a smaller bend elastic constant is expected to enhance blue phase
stability. Indeed, there are a growing number of experimental reports that describe
the importance of a small bend elastic constant in stabilizing blue phases, making
use of new materials with complex molecular geometry. For example, the nematic
phases of bent-core liquid crystals have been considered as hosts for blue phase
mixtures and Hur et al 16 describe a correlation between the ratio of the splay and
bend elastic constants, !!! !
!! of the host materials measured 20K below the
nematic to isotropic transition and the blue phase stability, with lower !!! enhancing
the range. Tanaka and Yoshizawa17 report that blue phases mixtures formed from
U-shaped oligomers with a small bend elastic constant also have an enhanced
range; they additionally note that a large molecular biaxiality should contribute to a
broad blue phase range. It has been demonstrated that bent-shaped molecules can
exhibit unusually small bend elastic constants18 , 19, so bent-core materials are
interesting candidates for inclusion in blue phase mixtures. Indeed, such
enhancement has been reported in blue phases formed with bent-core material
included in the mixtures20 , 21, 22 , 23. However, it is more complicated to consider
whether such enhancement will always be found in bent-core based systems. Tian24
oxaxiazole-based nematic systems doped with chiral molecules, summarized in
Table 1. These mixtures differ from many others that have been studied in that they
all contain at least 50% of the bent-core nematic component. In fact, rather narrow
blue phase ranges are found, contrasting with reports of enhanced ranges in other
bent-core systems. Further, the mixtures all only exhibited BPI and the fog phase
(Figure 3), which is expected of systems that exhibit blue phases at the long pitch
end of the blue phase stability regime25. The elastic constants of the bent-core
nematic hosts19 are also shown in Table 1. In all cases, although the bend elastic
constant is rather small, the twist elastic constant is even smaller. The combination
of a relatively long pitch, small twist coefficient and a somewhat larger bend elastic
constant would seem to explain the modest enhancement seen in the blue phase
range in these mixtures.
Material Composition Total BP range
(K)
Elastic constants 10K below the N-I transition. k22 (pN) k33 (pN)
M93R C5-Ph-ODBP-Ph-OC12
+8% R1011
0.7 0.6 2.5
M90R OC12-Ph-ODBP-Ph-OC12
+8% R1011
1.0 1.0 3.7
M93CB C5-Ph-ODBP-Ph-OC12
+33% CB15
1.2 0.6 2.5
M93CE C5-Ph-ODBP-Ph-OC12
+50% CE1
1.3 0.6 2.5
Table 1. The composition and some related physical characteristics of the mixtures
forming blue phases, containing bent-core nematic liquid crystals. The elastic constants are from [19]
It is important to mention the significant body of work that has been carried out
achieving and understanding the stabilization of the blue phases that has not relied
on a consideration of the elastic behaviour of the system. Well-known approaches
such as polymer stabilization and inclusion of colloidal particles that accumulate in
the defects offer a successful approach to significant broadening of the blue phases
been inspired by the realization that the Kerr effect in blue phases could potentially
provide an effective electro-optic display mode, discussed further below.
Figure 3. Photomicrograph showing BPI and the fog phase in the mixture M93R. Spectroscopy measurements reveal that the blue (465nm) and red (647nm) regions are the [2 0 0] and [1 1 0] surfaces of BPI respectively, judged by the relationship
between the reflection wavelengths (647 465! !). The dark region is the fog phase
(BPIII). The magnification is approximately 100x and the sample is viewed in reflection between crossed polarizers.
3. Switching phenomena in blue phases.
The electric field effects that can be observed in blue phase systems are extremely
rich25, 26. The blue phase lattice can undergo electrostriction, causing a shift in the
Bragg reflection wavelength, the Kerr effect can be observed and made use of in
display devices, and there is considerable scope to induce transitions between
phases with different lattice structures and to chiral nematic focal conic textures or
the unwound nematic state. Significant hysteresis is observed in these field-induced
transformations and in many of the field effects. Some of the earliest work on
electric-field effects in blue phases dates back to around 1980, when the
field-induced transitions from the blue phases to N* and unwound N states and the
colour-shift that is associated with electrostriction were observed27, 28, 29. All of these
phenomena were found to be strongly frequency and voltage dependent and to
[image:10.595.135.459.134.379.2]understanding of these transitions30. For example, understanding the field-induced
transitions in BPIII (the fog phase), first described at the end of the 1980s6, 31, 32, and
including a field-induced phase locally similar to BPII and a transition to an unwound
N state,has benefited from recent numerical studies33.
The colour-shift observed as a result of electrostriction in BPI and BPII depends
approximately on the square of the applied field and the response time is relatively
fast, of the order of tens of milliseconds4. However, a colour change that is the result
of switching between lattice faces can also be induced, for example a
frequency-induced transition in BPII between a green-reflecting colour (~510nm) and an orange
colour (~605nm) has been reported4. Such a transition is consistent with a
transformation between the [1, 1, 1] and [1, 1, 0] orientations of BPII which would
give a ratio of ! ! ! !!!! between the reflection wavelengths. It is interesting that
the transformation was caused by a frequency switch with the [1, 1, 1] (orange)
orientation stable at high frequencies while the [1 1 0] orientation is the ground state
for that system, demonstrating that specific unit cell orientations can be induced by
application of a suitable electric field. An important observation is that control of the
blue phase crystal lattice orientation by electric field treatment offers an invaluable
way to produce uniform orientation of the crystallites, which is usually random if the
texture is produced thermally, over a large area.
Although early papers suggested that the field-induced colour changes in and
between blue phases might be useful for devices, it is the Kerr effect that has so far
proven to be the most likely electro-optic phenomenon in blue phases to be made
use of in applications34. The Kerr effect results in an induced birefringence !! with a
magnitude that depends on the square of the applied field in the Ôlow fieldÕ regime,
!! ! !��!!, where K is the Kerr constant of the material and λ is the wavelength.
Large magnitude Kerr effects have been reported in several blue phase systems35, 36,
including some that have not had the benefit of polymer stabilization37. Of course
polymer stabilization has the important advantage that the blue phase is extended to
a useful range. The material parameters that influence the magnitude of the Kerr
effect in the blue phases are not fully understood, though Equation (3) appears to
! ! ��
!!! ! !!!!
!!!!!
�� !! !!!!!!!!!!!!!!!!!!!!!!!!!!!!!!!!!!!
The parameters are those in the underlying N* phase, ! being an elastic constant in
the one elastic constant approximation and !! the birefringence37, 38. Certainly,
materials with larger values of !! and !! with small elastic constants appear to
exhibit a larger Kerr effect, which is maximized in BPI37.
As already mentioned, both the Kerr effect and electrostriction phenomena show a
quadratic dependence on the applied field. This means that the application of an
electric field to a blue phase system is likely to cause both types of response and this
can result in complicated dynamics. Two-stage switching has been reported in
studies of the dynamic response of electrostriction, with both fast (~100µs) and
slower (~1ms) components contributing5. A similar two-stage response has been
described recently in a polymer stabilized blue phase system, with the faster
response associated with the Kerr effect39 and the slower due to electrostriction.
Interestingly, polymer stabilization constrains electrostriction phenomena more than
the Kerr effect, modifying the dynamics of the system. The relative contribution of
each effect can be determined37, 40, indicating that a judicious choice of material
could allow the Kerr response and electrostriction to be deconvoluted and studied
separately. It will be interesting to take advantage of such material design to allow a
deeper understanding of the dynamics of electric-field effects in blue phase mixtures
to develop in the future.
4. Alignment of the blue phase lattices.
The crystal lattices of blue phase structures lead to remarkably beautiful liquid
crystalline textures, some of which allow direct visualization of the cubic symmetry41.
Perhaps the most obvious phenomenon that affects the blue phase texture is the
pinning effect of the device itself on the structure, which has been studied by several
groups42, 43. The nature of the transitions between blue phases also appears to be
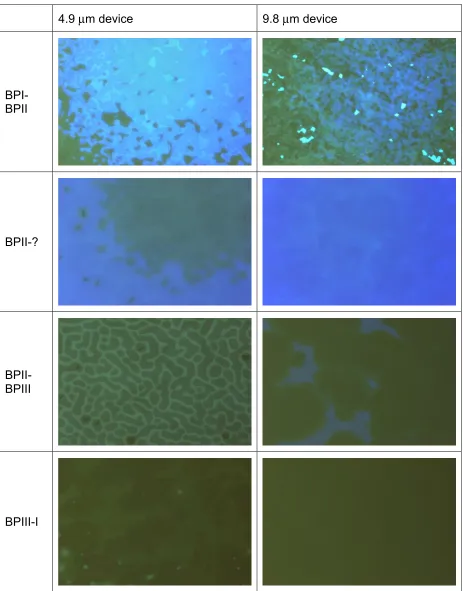
quite sensitive to the cell thicknesses, as shown in Figure 4; in particular, the BPII to
4.9 µm device 9.8 µm device
BPI-BPII
BPII-?
BPII-BPIII
BPIII-I
[image:13.595.67.530.68.659.2]The lattice spacing in blue phases changes slightly with temperature, but strong
anchoring constrains the value it can take to fit within the device thickness, in the
same way as the N* pitch is constrained to half-integer values, leading to pitch jumps.
In some cases, the effect of anchoring is negligible44, but in others, large effects are
seen. Figure 5 shows the reflection spectra determined in the BPI of a mixture
(denoted M1) comprising 47.5%w/w TM75A and 52.2%w/w TM74A¤; Kossel
diagrams show that the reflections are from the [1 1 0] surface. Two distinct peaks
are observed in the high and low temperature regions, with a combined peak
reminiscent of a selective reflection peak in an N* phase at intermediate
temperatures. A Ôconfinement ratioÕ, ! ! can be defined for blue phases, where ! is
the device thickness and ! is the blue phase lattice parameter, which aids the
interpretation of reflection spectra in blue phases. In the case of the spectra in Figure
5, the confinement ratio takes values of 13 and 13.5 for the peaks at 508.8nm and
524.9nm respectively.
Figure 6 shows the dependence of both the Bragg peak wavelength and the
associated confinement ratio with temperature. It can be seen that there is a rapid
change in both at the transition to the supercooled regime of BPI, but that the lattice
then remains stable. There is an interesting reflection observed at 309K in this
system, discussed further below. A significant hysteresis can be measured in the
confinement ratio of the system on heating and cooling; heating from N* to BPI tends
to cause this system to adopt values of ! ! of 14 at the N* to BPI transition, then
13.5 and 13 at the highest temperature end of the BPI regime, while on cooling ! !
is 13 just below the transition from BPII, passes through 13.5 and then becomes 14
just below the transition to the N* phase. Although hysteresis is well-known for pitch
jumps in the N* phase45, this effect is less well-studied in the blue phases though
there is no doubt that understanding pinning effects and hysteresis is of relevance to
the use of blue phases in devices42.
¤
500 550 0 1 2 3 (c) (b) In te n s it y (a rb .) Wavelength(nm) (a) 500 550 0 1 2 3 500 550 0.0 0.5 1.0 1.5 In te n s it y (a rb .) Wavelength (nm) Multi-peak fit In te n s it y (a rb .) Wavelength(nm) Figure 5. Experimentally determined spectra in the BPI of M1 with Gaussian fits to the blue phase peaks. (a) 309.74 K; a single peak is centred at 524.9 nm. (b) 309.78 K; the single peak is centred at 508.8 nm. (c) 309.77 K; an excellent fit is found by fixing two single peak positions at 508.8 nm and 524.9 nm, and fitting both the peak intensities separately.
The supercooled BPI undergoes a further textural change deep into the state, seen
only for very slow cooling rates, of the order of 0.02 Kmin-1; this is the anomalous
data point at 309.0K in Figure 6 labeled BPS. Analogous behaviour was reported by
Demikhov et al46, 47, with the suggestion that the peak could be associated with a
further blue phase structure. The Bragg peak associated with the data point at
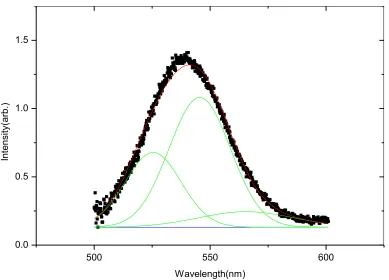
309.0K in Figure 7 is much broader than those normally associated with blue phase
reflections and is shown Figure 8. In fact this peak could be formed from several
pinned structures and Figure 8 shows a fit made up of contributions of three of the
pinned lattices with reflections at 525nm, 542nm and 562nm. Again, it would appear
that rather than a new phase forming, there is a large change in the lattice around
the BP to N* phase transition, which is manifest over a very restricted set of
[image:15.595.89.496.89.382.2]
Figure 6. The selective reflection wavelength (black squares, left axis) and the confinement ratio (red empty squares, right axis) as a function of temperature for the mixture M1, measured on cooling. Note that the system is supercooled below 309.6 K. The width of the blue phase I on heating is measured to be less than 0.5 K.
500 550 600
0.0 0.5 1.0 1.5 In te n s it y (a rb .) Wavelength(nm)
Figure 7. The experimentally measured reflection peak at 309 K (black dots), with the three individual peaks with centres at wavelengths 525 nm, 542 nm and 562 nm that are used to fit the spectrum (green lines). The red line shows the sum of the three (green) Gaussian functions.
309.0 309.2 309.4 309.6 309.8 310.0
500 510 520 530 540 550 560 570 580 R e fl e ct io n W a ve le n g th (n m) Temperature(K) Normal BPI Suppercooling BPI BPS? 13.0 13.5 14.0 14.5 15.0 C o n fi n e me n t R a ti o ! Supercooled BPI ÔNormalÕ BPI
[image:16.595.145.469.80.293.2] [image:16.595.95.484.388.668.2]Alignment layers typically used for nematic liquid crystals, such as rubbed polyimide,
can result in large, uniform areas of blue phase structure if the cooling rate is
sufficiently slow. Figure 8 shows such a sample, grown in the mixture M1 by cooling
at a rate of 0.01Kmin-1 from the isotropic phase, through BPII to BPI and holding for
4 hours in BPI to anneal the structure. The BPI orientation is identified as the [1 1 0]
surface via Kossel diagrams, and Figure 8 shows an obvious anisotropy of the
structure when viewed with crossed (linear) polarizers; the individual blue phase
platelets appear subtly different for different orientations with respect to the
polarizer/analyzer. Such effects are visually clear and were reported in some of the
earliest studies of blue phases48. Larger uniform areas are required for spectral
studies of such phenomena to avoid averaging across many blue phase platelets;
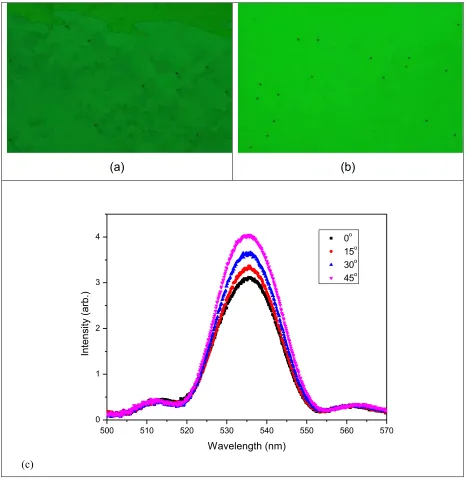
these can be obtained by electric field treatment, as described in Section 2. Figure 9
shows the appearance of the BPI structure in this system before and after
electric-field alignment; uniform areas as large as 2 x 2 mm2 can be grown in a 5µm thick
device following field treatment that unwinds the BPI structure into the N state. This
monodomain satisfies the conditions for studying blue phase optics in detail as
described in theoretical papers49.
(c)
(d) (e)
[image:18.595.83.509.72.491.2](a) (b)
(c)
500 510 520 530 540 550 560 570 0
1 2 3
4 0o
15o 30o 45o
In
te
n
si
ty
(a
rb
.)
[image:19.595.65.532.70.550.2]Wavelength (nm)
Figure 9. BPI before (a) and after (b) field treatment. The black dots are spacers. (c) the blue phase spectra for various orientation angles of the rubbing direction with respect to the polarizer.
The reflection spectra measured from the uniform BPI structure are also shown in
Figure 9 for different orientations of incident linearly polarized light. The shape of the
Bragg peaks are identical for all orientations, but the amplitude clearly depends on
the orientation with a maximum occurring when the rubbing direction on the device is
at 45û to the polarizer direction; the intensity is a minimum when the polarization
direction aligns with the rubbing direction. The modulation in the intensity is
phenomenon. Observations of this anisotropy in the reflections from blue phase
platelets was originally thought to be inconsistent with a cubic structure which should
be optically isotropic. However, such observations of the anisotropy in the Bragg
scattered intensity are consistent with calculations by Belyakov et al49 and Bohley50.
In fact exactly the same experimental situation (light propagating along the [1 1 0]
axis of BPI) was considered in detail by Belyakov et al51. In principle, detailed
analysis of the optics of blue phases could lead to a far better understanding of them.
For example, the analysis of many-wave scattering in Kossel diagrams from BPII
which allows determination of the phase of the scattering structures, indicates
discrepancies with the generally accepted structure of the phase52, demonstrating
that there is much we still donÕt understand about these fascinating states of matter.
5. Concluding remarks.
The blue phases, which began as a scientific curiosity and, through chance, ended
up having some of the strangest names in liquid crystals (the blue phases are by no
means always blue!), have been ÔrediscoveredÕ in the past decade because of
important work that allowed them to extend over useful temperature ranges and
advances in understanding and controlling their electro-optic response. They remain
challenging systems to understand from a fundamental point of view. I think that
George would have been fascinated by the complex but beautiful relationship
between blue phase stability, the electro-optic response and the material parameters
that can, in principle, be engineered by careful molecular design and synthesis.
There is much still to understand in the control of blue phase stability, but it is clear
that understanding physical properties such as the elastic constants which can be
controlled by the molecular structure is vital.
Acknowledgements
The work included in this paper was carried out with financial support from the
EPSRC (including grant numbers EP/G023093 and EP/D055261/1), Merck Ltd
References
1Gray GW. The mesomorphic behaviour of the fatty esters of cholesterol.
J Chem
Soc.1956;3733-3739
2 Coates D and Gray GW. Optical studies of amorphous liquid-holesteric-liquid crystal
transition Ð blue phase. Physics Letters A. 1973;45(2):115-116
3 Gleeson HF. Optical and Electro-optical Properties of Chiral Mesophases. PhD Thesis,
University of Manchester. 1986
4 Gleeson HF, Simon R and Coles HJ. Electric field effects and two frequency colour
switching in the cholesteric and blue phases of nematic/cholesteric mixtures. Mol. Cryst. Liq.
Cryst. 1985;129:37-52
5 Coles HJ and Gleeson HF. Electric field induced phase transitions in blue phases of chiral
nematic liquid crystals. Mol. Cryst. Liq. Cryst. 1989;167:213-226
6 Gleeson HF and Coles HJ. Dynamic properties of blue phase mixtures. Liquid Crystals.
1989;5(3):917-926
7 Dubois-Violet E and Pansu B, Frustration and related topology of blue phases Mol. Cryst.
Liq. Cryst. 1988;165:151-182
8 Crooker PP. The blue phases Ð a review of experiments. Liquid Crystals. 1989;5:751-775 9 Meiboom S, Sethna PJ, Anderson PW and Brinkman WF.Theory of the blue phase of
cholesteric liquid crystals. Phys. Rev. Lett. 1981;46:1216-1219
10 Miller RJ. Structural Studies of Chiral Frustrated Liquid Crystals. PhD Thesis, University of
Manchester. 1993
11
Miller RJ and Gleeson HF. The influence of pretransitional phenomena on blue phase range. Liquid Crystals. 1993;14:2001-2011
12 de Gennes PG. Calcul de la distortion dÕune structure cholesterique par un champ
magnetique. Solid State Comm. 1968;6, 163-165
13
Hurault JP. Static distortions of a cholesteric planar structure induced by magnetic or ac electric fields. J. Chem. Phys. 1973; 59:2068-2075
14 Alexander GP and Yeomans JM. Stabilizing the blue phases. Phys. Rev. E.
2006;74:061706
15
Fukuda J. Stabilization of blue phases by the variation of elastic constants. Phys. Rev. E.
2012;85:020701
16 Hur S-T, Gim M-J, Yoo H-J, Choi S-W and Takezoe H. Investigation for correlation
between elastic constant and thermal stability of liquid crystalline blue phase 1. Soft Matter. 2011;7:8800-8803
17
Tanaka M and Yoshizawa A. U-shaped oligomers with a molecular biaxiality stabilizing
blue phases. J Mater. Chem. C. 2013;1:315-320
18
Kaur S, Addis J, Greco C, Ferrarini A, Gortz V, Goodby JW and Gleeson HF.
Understanding the distinctive elastic constants in an oxadiazole bent-core nematic liquid crystal. Phys. Rev. E. 2012;86:041703
19 Kaur S, Liu H, Addis J, Greco C, Ferrarini A, Gortz V, Goodby JW and Gleeson HF. The
influence of structure on the elastic, optical and dielectric properties of nematic phases formed from bent-core molecules. J Mat Chem C. 2013;1(40):6667-6677
20 Lee M, Hur ST, Hong SH, Lee HJ, Shin ST, Choi SW, Song K. Temperature dependent
behaviours of Blue Phase 1 observed for a bent-core molecular system. Mol. Cryst. Liq. Cryst. 2011;550:1-6
21 Wang HF, Zheng ZG, Shen D. Blue phase liquid crystals induced by bent-shaped
molecules based on 1,3,4-oxadiazole derivatives. Liquid Crystals 2012;39:99-103
22 Zheng ZG, Shen D, Huang P. Wide blue phase range of chiral nematic liquid crystal
doped with bent-shaped molecules. New Journal of Physics, 2010;12:113018
23 He WL, Wang L, Cui XP, Xie MW, Yang H. Wide Temperature Range Blue Phase Liquid
24 Tian L. Liquid crystal blue phases for electro-optic displays. PhD Thesis, University of
Manchester, 2013.
25
Collings PJ. Volume 4, ÔThe Handbook of Liquid CrystalsÕ, Ed. JW Goodby, PJ Collings, T Kato, C Tschierske, HF Gleeson and P Raynes, Wiley VCH, Germany (2014)
26 Kitzerow HS. The effect of electric fields on blue phases.
Mol. Cryst. Liq. Cryst. 1991;202
51-83
27
Armitage D and Cox RJ. Liquid crystal blue phase to isotropic transition and electric-field response Mol. Cryst. Liq. Cryst. Letts. 1980;64:41-50
28 Finn PL and Cladis PE. Cholesteric blue phases in mixtures and in an electric field.
Mol.
Cryst. Liq. Cryst. 1982;84:159-192
29
Heppke G, Krumrey M and Oestreicher F. Observation of electro-optical effects in blue phase systems. Mol. Cryst. Liq. Cryst. 1983;99:99-105
30 Henrich O, Marenduzzo D, Stratford K, and Cates ME
. Thermodynamics of blue phases in electric fields. Phys. Rev. E. 2010;81:031706
31 Yang DK and Crooker PP. Blue phase III of chiral liquid crystals in an electric field. Phys.
Rev. A, 1988;37:4001-4005
32 Kitzerow H-S, Crooker PP and Heppke G. Line-shapes of field-induced blue phase-III
selective reflections. Phys. Rev. Lett, 1991;67:2151-2154
33 Henrich O, Stratford K, Cates ME, and Marenduzzo D. Structure of Blue Phase III of
Cholesteric Liquid Crystals. Phys. Rev. Lett. 2011;106:107801
34Chen Y and Wu ST, J. Recent Advances on Polymer-Stabilized Blue Phase Liquid Crystal
Materials and Devices. Applied Polymer Science, 2014;131:40556
35 Yan J, Cheng H-C, Gauza S, Li Y, Jiao M, and Rao L. Extended Kerr effect of polymer
stabilized blue phase liquid crystals Appl Phys Lett. 2010;96:071105
36 Hisakado Y, Kikuchi H, Nagamura T, Kajiyama T. Large electro-optic Kerr effect in
polymer stabilized liquid crystalline blue phases. Adv Mater. 2005;17:96
37 Tian L, Goodby JW, Gšrtz V and Gleeson HF. The magnitude and temperature
dependence of the Kerr constant in liquid crystal blue phases and the dark conglomerate phase. Liquid Crystals. 2013;40(11):1446-1455
38 Gerber PR. Electro-optical effects of a small-pitch blue phase system. Mol Cryst Liq Cryst.
1985;116:197-206
39
Xu D, Yan J, Yuan J, Peng F, Chen Y and Wu S-T. Electro-optic response of
polymer-stabilized blue phase liquid crystals. Appl. Phys. Letts. 2014;105:011119
40Yoshida H, Yabu S, Tone H, Kikuchi H, Ozaki M. Electro-Optics of Cubic and Tetragonal
Blue Phase Liquid Crystals Investigated by Two-Beam Interference Microscopy. Applied
Physics Express, 2013;6:062603 41
There are some beautiful examples of blue phase textures on the International Liquid Crystal web site including June 2014, June August and October 2010 and January 2009. The site can be found at http://www.lcinet.kent.edu/ILCS/main/page137/page137.html
42
Nayek P, Jeong H, Park HR, Kang S-W, Lee SH and Park HS, Tailoring Monodomain in
Blue Phase Liquid Crystal by Surface Pinning Effect. Applied Physics Express.
2012;5:051701
43
Liu HY, Wang CT, Hsu CY, Lin TH. Pinning effect on the photonic bandgaps of blue phase liquid crystal. Applied Optics. 2011;50:1606-1609
44
Yang DK and Crooker PP. Chiral-racemic phase diagrams of blue phase liquid crystals.
Physical Review A. 1987;35, 4419-4423
45 Yoon H-G, Roberts NW and Gleeson HF. An experimental investigation of the discrete
changes in pitch in a thin planar cholesteric device. Liquid Crystals. 2006;33:503
46 Demikhov E and Stegemeyer H. Observation of a new metastable liquid crystalline phase
in supercooled blue phase systems. Liquid Crystals. 1991;10:869-873
47 Demikhov E, Stegemeyer H and Tsukruk V. Pretransitional phenomena and pinning in
liquid crystalline blue phases. Physical Review A, 1992;46:4879-4887
48 Keyes PH, Nicastro AJ and McKinnon EM. Microscopic observations of the cholesteric
49 Belyakov VA, Dmitrenko VE, and Osadchii SM. Optics of the blue phase of cholesteric
liquid crystals. Zh. Eksp.Teor. Fiz. 1982;83:585-600 50
Bohley C, Polarization Optics of Periodic Media: PhD Thesis, University of Neuchatel. 2004.
51 Belyakov VA, Demikhov EI, Dmitrienko VE, and Dolganov VK. Optical activity,
transmission spectra and the structure of liquid-crystal blue phases. Zh. Eksp.Teor. Fiz. 1985;89:2035-2051
52 Miller RJ, Gleeson HF and Lydon JE. Many Wave Light Scattering Features in Blue Phase
![Figure 3. Photomicrograph showing BPI and the fog phase in the mixture M93R. between the reflection wavelengths (are the [2 0 0] and [1 1 0] surfaces of BPI respectively, judged by the relationship Spectroscopy measurements reveal that the blue (465nm) and](https://thumb-us.123doks.com/thumbv2/123dok_us/7882826.184464/10.595.135.459.134.379/photomicrograph-reflection-wavelengths-surfaces-respectively-relationship-spectroscopy-measurements.webp)