obstructions to daylighting
.
White Rose Research Online URL for this paper:
http://eprints.whiterose.ac.uk/90328/
Version: Accepted Version
Article:
Lu, Y., Wolf, T. and Kang, J. (2015) Optimization of facade design based on the impact of
interior obstructions to daylighting. Building Simulation. ISSN 1996-8744
https://doi.org/10.1007/s12273-015-0253-4
Reuse
Unless indicated otherwise, fulltext items are protected by copyright with all rights reserved. The copyright exception in section 29 of the Copyright, Designs and Patents Act 1988 allows the making of a single copy solely for the purpose of non-commercial research or private study within the limits of fair dealing. The publisher or other rights-holder may allow further reproduction and re-use of this version - refer to the White Rose Research Online record for this item. Where records identify the publisher as the copyright holder, users can verify any specific terms of use on the publisher’s website.
Takedown
If you consider content in White Rose Research Online to be in breach of UK law, please notify us by
Optimization of fa¸
cade design based on the impact of interior
obstructions to daylighting
Yao Lu · Tina Wolf · Jian Kang
Received: 2 May 2015 / Revised: 17 August 2015 / Accepted: 27 August 2015
Abstract Overcrowding in the perimeter zone is an inevitable issue in residential rooms with
limited space. Obstructions, such as furniture and household items, may block the existing win-dows, and therefore affect interior daylight conditions. A fa¸cade design approach is needed that simultaneously takes into account daylighting and the volume of usable space for obstructions in the perimeter zone of such rooms. This study simulates daylight distributions in a typical small residential room with obstructions in front of windows. The simulation consists of two parts. First, the effects on horizontal illuminances caused by different positions and shapes of obstructions are examined under an overcast sky. Second, the maximum usable space volumes for obstructions of 51 optimized fa¸cade configurations are calculated in terms of four window-to-wall ratios (W W Rs).
The results of this study show that optimizing the forms of facade design can increase the usable interior space volume and meet the daylighting requirements of Chinese standards for small resi-dential rooms. Additionally, by using the optimized fa¸cade forms, a fa¸cade with aW W Rvalue of
50% provides the maximum usable space for obstructions. Based on the above results, this paper presents two matrices that can help architects in selecting the appropriate fenestration methods and confirming the size of usable space and allocation for residents.
Keywords Usable space· Perimeter zone·Fa¸cade design· Daylighting performance·Daylight
simulation·Small residential room
F. Author·S. Author
Department of Technology and Design of Building Envelopes, Faculty of Architecture, Technische Universit¨at
M¨unchen, Arcisstr. 21, 80333, Munich, Germany
Tel.: +49 17657863117 E-mail: [email protected]
T. Author
School of Architecture, The University of Sheffield, Western Bank, Sheffield S10 2TN, UK
Glossary
Obstruction Fully used space in perimeter zones that obstructs daylighting
Cube Hexahedron obstruction with an equal length and height of 600mm
Vertical cuboid Rectangular prism obstruction with a height longer than its length
Horizontal cuboid Rectangular prism obstruction with a height shorter than its length
Wide solid wall Opaque portion of the fa¸cade, whose width is longer than its height
Tall solid wall Opaque portion of the fa¸cade, whose width is shorter than its height
w Width of an obstruction (mm)
l Length of an obstruction (mm)
h Height of an obstruction (mm)
lh Distance from the horizontal middle line of the obstruction to the floor (mm)
lv Distance from the vertical middle line of the obstruction to the window edge (mm)
lt Total length of all obstructions in one model (mm)
D Distance from the influenced point of the designated illuminance contours to the
inner window projection line (mm)
D800, D500, D300, D200 Specific D in accordance with the target illuminance contours of 800lux, 500lux,
300luxand 200lux, respectively (mm)
wmax Maximum acceptable width of the obstruction that can ensure the target
illumi-nance level (mm)
Vmax Maximum volume of the obstruction in accordance with the maximum acceptable
width (m3
)
1 Introduction
Personal living space in many metropolises is still restricted. For example, the average “saleable area” in Hong Kong was 15.6m2
in 1999 [Liu et al, 1999], and the average living space in Shanghai was 17.3 m2 in 2012 [SHANGHAI, 2012]. The development of high density residential buildings
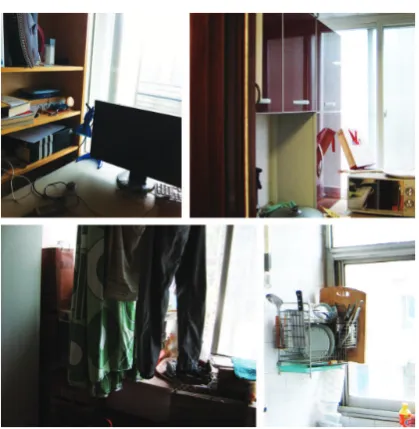
leads to small dwelling units [Chan et al, 2002]. Unlike in large dwellings, residents of small units have to make efficient use of every centimeter of space so that complicated living functions are conducted in one crowded space [Rooney, 2003]. Numerous studies have been conducted on using the space more efficiently in small residential units, in terms of user behaviors, furniture layouts, and spatial configurations [Gifford, 2007; Mahtab-uz Zaman and Lau, 2002; Bordas-Astudillo et al, 2003]. Surveys in occupied rooms reveal that space use patterns are based on daylight distribution. The space in perimeter zones (i.e., window area) is often used for the activities, such as reading and cooking, that require high light levels [Ruck et al, 2000]. The Wong’s study indicates that the use-territory for each user activity can be demarcated by the related furniture layouts and associated space [Wong, 2010]. Compared with the room size, furniture is relatively oversized [Rooney, 2001] in small residential rooms. Thus, the furniture or other household items usually occupy most of the perimeter zone for activities that require high light levels. Moreover, a piece of fully used furniture no longer functions as a single plane, but is a three dimensional solid that obstructs daylight (see Figure 1). In this way, the used space in perimeter zones appears as an opaque obstruction with a reflectance value, which, however, may negatively affect the interior daylighting conditions. Current studies of residential building fa¸cades typically investigate daylighting in empty rooms, which differs substantially from the post-occupancy situation. The inevitable overcrowding in small residential rooms necessitates the investigation of a novel fa¸cade design solution that simultaneously takes into account daylighting and space use in perimeter zones. The challenge lies in optimizing the proportion and distribution of opaque areas of a fa¸cade to assist residents in making full use of the space behind the opaque areas and ensuring that indoor daylight levels meet the requirements of Chinese daylight standards.
[image:3.595.88.508.149.351.2]Fig. 1 Use of space in perimeter zones in a space-limited room
on fa¸cade design involves a wide range of issues, such as aesthetics, user preference, human behavior, lighting, indoor thermal comfort, natural ventilation and energy consumption [Cheung and Chung, 2008; Alkhresheh, 2012; Hochberg et al, 2010; Gagne and Andersen, 2012; Smith and Levermore, 2008; Lavafpour and Sharples, 2014; You et al, 2013]. In the past decade, as natural lighting has been shown to be environmentally benign and psychologically satisfying for living and working [Leslie, 2003; Du and Sharples, 2011], an enormous amount of research has been conducted on how windows influence overall interior daylighting [Bougdah and Sharples, 2009; Lartigue et al, 2013; Baker and Steemers, 2002]. The primary research approaches are based on a numerical analysis of daylight distribution in rooms in different ambient conditions [Ghisi and Tinker, 2005; Husin and Harith, 2012; ¨Unver et al, 2003; Li, 2010; Jin, 2002]. Many noteworthy results have been obtained. For instance, Markus has demonstrated that a long horizontal window can illuminate almost twice as much area in a room as three vertical windows [Markus, 1967]. Mohamed illustrates the contours of daylight penetration with side windows of different widths, which clearly reveals how the width of the window affects the depth and position of the daylight area in an empty room [Mohamed, 2008]. Su and Zhang analyze the lighting energy consumption of different window types with respect to the window-to-wall ratio [Su and Zhang, 2010]. Research methods have developed which range from the traditional on-site measurements or static calculations in real or scaled test rooms [Ruck et al, 2000] to computer-aided dynamic simulations using climate data [Reinhart and Wienold, 2011].
[image:4.595.193.403.132.347.2]knowledge, no quantitative analysis has been conducted on how the occupied space in perimeter zones changes the light distribution in a room, nor how much space can be used without jeopardizing the illumination of the areas farther away from windows.
This work, therefore, proposes a fa¸cade design solution for small residential rooms by investigat-ing the daylight distributions and usable space volumes. To this end, the followinvestigat-ing three research questions will be addressed: 1) How does the used space in front of windows with different geome-tries and positions influence the daylight distribution? 2) What is the maximum volume of the potential usable space in the bright area of rooms with different fa¸cade fenestrations? 3) What is the optimized fa¸cade design that can provide the maximum useful space with respect to day-lighting performance? The above research questions are examined by simulating room models with different forms of used space in front of windows to assess the daylight distributions on working planes. Based on the results, the fa¸cade configurations are then optimized. Through simulating the optimized designs with different window-to-wall ratios (W W Rs), the maximum usable space
volumes are calculated and compared. Finally, the primary findings are presented in two tables to assist those who are seeking window fa¸cade design solutions that deliver reliable performance to occupants.
2 Methods
2.1 Simulation tool and validation
This study uses DIAlux 4.11.0.2 as the simulation tool. DIAlux is a light planning program develope-d by DIAL GmbH that can calculate andevelope-d photo-realistically visualize the develope-daylight performances following the standards (EN12464, ISO 8995). Many academic studies have used DIAlux as an analysis tool [Zhao and Mei, 2013; Ullah and Shin, 2014]. Although DIAL lighting laboratory has evaluated the reliability of the simulation results produced using DIAlux against the internation-al standard CIE 171:2006 [DIALux, 2013], the accuracy of its results in a sminternation-all-scinternation-ale space with particular boundary conditions, as in this study, is still worth confirming. To this end, a validation experiment was conducted.
The experiment test-bed is a south-oriented room in a small apartment. The building is located in Xi’an, China (latitude 34.23◦ N and longitude 108.94◦ E), with no obstruction in front of the
building. The room is 3300 mm×4500 mm×2700 mm. The window in the southern fa¸cade is
2100mm×1500mmand has a single glazing with a pollution factor of 60%. The materials and
the reflectance values of surfaces are shown in Table 1.
Table 1 Room surface materials and parameters
Surfaces Glazing
Walls Floor Ceiling Single glazing 3mm
Material Roughcast plastering white Fine concrete White plaster Transmittance
Reflectance 72% 27% 71% 90%
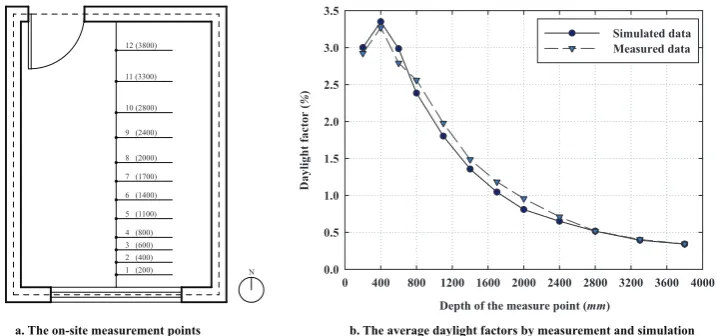
To validate the reliability of the simulation, a comparative analysis was conducted of the hori-zontal daylight factors from measured data and from the DIAlux-simulation. The on-site test took place from January 4 to 6, 2013, from 8:00 to 17:30 under overcast skies. The average horizontal ambient illuminance at 12:00 was 13170 lux. Twelve measurement points on the working plane
were set in the centerline of the room (Figure 2a). The working plane height was 850 mm. The
an overcast sky from the same days in Xi’an. The average horizontal ambient illuminance at 12:00 was 11757lux. Figure 2b presents the comparison between the measured results and the
simula-tion results of the average daylight factors at the 12 measurement points. The relative deviasimula-tion between the two ranges is from 0.035% to 15.505% throughout the test, but the average relative deviation was 5.846%. The result shows that the simulation has achieved an acceptable deviation in comparison to the actual measurements.
1 (200) 2 (400) 3 (600) 4 (800) 5 (1100) 6 (1400) 7 (1700) 8 (2000) 9 (2400) 10 (2800) 11 (3300) 12 (3800)
N
a. The on-site measurement points b. The average daylight factors by measurement and simulation
Fig. 2 The on-site measurement points and the average daylight factors by measurement and simulation
2.2 Simulation models
Based on the Chinese design codes, the daylighting of a southern oriented residential room must meet the recommended illuminance levels for different activities at midday of the winter solstice under an overcast sky. [GB50180, 2002; GB50352, 2005; GB50034, 2013], thus the weather data in this study is taken from 22 December at 12:00 in Xi’an, China. In the following studies, the sky model is an overcast sky, and the horizontal ambient illuminance is 11500 lux. The results under
this condition should ensure that there is at least one hour of daylight on the day of the winter solstice, which should meet the light requirement of the inhabitants.
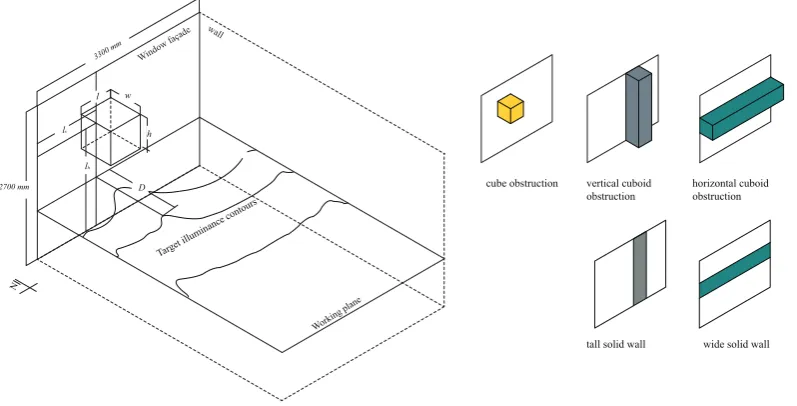
The room model is designed in accordance with the validated room (Figure 3a). The surface and glazing materials are set at the values in Table 1. Two differences must be noted: first, the glass is assumed to be clean, so the pollution factor is 80%; second, to analyze different possibilities, the window is assumed to cover the entire southern fa¸cade. Four daily working planes are selected. Their heights are 0mm, 400mm, 850mmand 1100mm.
[image:6.595.114.473.224.392.2]vertical cuboid and horizontal cuboid (Figure 3b). The cube is a hexahedron obstruction with a length and height of 600mm. This type of obstruction represents household items with a box form.
The vertical cuboid is a rectangular prism obstruction with a height longer than its length, while the horizontal cuboid is a rectangular prism obstruction with a height shorter than its length. The two latter types represent the basic forms of furniture. In fa¸cade design, the potentially opaque part of the fa¸cade that corresponds to the investigation results of a vertical cuboid is described as a tall solid wall, whose width is shorter than its height. The potentially opaque part of the fa¸cade corresponding to the investigation results of a horizontal cuboid is referred to as a wide solid wall, whose width is longer than its height(Figure 3b).
Worki ng pl ane N l w h lh D lv 2700 mm 3300 m m wall Wind ow fa
çade
Targe t illum
inance conto
urs
a. The parameters, variables and indicators in the simulation model b. The types of obstructions and solid walls cube obstruction vertical cuboid
obstruction
tall solid wall wide solid wall horizontal cuboid obstruction
Fig. 3 The model and obstruction types in the simulation
2.3 Simulation variables
Five variables are defined with regard to the dimensions and positions of the obstructions (Fig-ure 3a), namely width (w) (unit mm), length (l) (unit mm), height (h) (unit mm),lh(unit mm)
andlv (unit mm). The distance from the horizontal middle line of the obstruction to the floor is lh, while the distance from the vertical middle line of the obstruction to the window edge islv. For
a model with more than one vertical obstruction, the total length of all obstructions in one model is defined aslt.
During the investigation of daylighting, the target illuminance levels are varied depending on the task and the detail level required by the inhabitants. Table 2 shows the recommended illuminance in residential buildings in China [GB50034, 2013]. Based on the table, for a single obstruction effect analysis, the evaluation illuminance levels are 300 lux, 500 lux and 800lux. For combined
[image:7.595.90.489.270.473.2]Table 2 Recommended illuminance for different types of work for residential buildings
Typical Locations Activities Recommended illuminance (lux)
Ideal Average Minimum
Living room, Bedroom Movement of people 50 30 20
Writing, reading 300 200 150
Work requiring perception of detail 500 300 200
Kitchen, dining room Cooking 50 30 20
2.4 Evaluation indicators
Because of the obstructions, the illuminance contours in front of the obstructions change dramati-cally and sometimes a valley point appears. As a result of this research, the fa¸cade design should ensure that the illuminance in the area in front of a used space meets the recommended illuminance level on the day of the winter solstice for at least one hour at midday, according to the Chinese daylight design codes for residential buildings [GB50180, 2002; GB50352, 2005; GB50034, 2013]. Therefore, in this study, evaluation indicatorDis introduced to evaluate whether the daylighting
meets the Chinese standards if the space in front of the opaque part of the fa¸cade is occupied and to what extent the space can be used. D is defined as the distance from the influenced point of
the designated illuminance contours to the inner window projection line, unit m(see Figure 3a).
If the designated illuminance contour does not exist in the area in front of the obstruction, theD
value is 0, meaning that the used space has an enormous effect on the recommended illuminance level and the corresponding fa¸cade fenestration fails to reach the daylighting level. If the same illuminance contour appears several times, theD is assigned the farthest distance. The specificD
is defined asD800,D500,D300 and D200, in accordance with the target illuminance contours. The
maximum acceptable width of the obstruction that can meet the target illuminance level is named
wmax (unit mm). By multiplying thewmaxvalue with the height and length of the obstruction,
the corresponding maximum volume of the obstruction is achieved and calledVmax(unit m3).
2.5 Simulation process
The simulation process consists of three steps:
– Step 1: Investigate the effect of obstruction position. The obstructions are moved along a vertical or horizontal track in front of the window (Figure 4a). The distance between each position point is 300 mm. The vertical track is along the vertical middle line of the window. The horizontal
track is a horizontal line at a height of 1800mm, but only from one window edge to the middle
of the window; thus, the lv values are from 300mmto 1650 mm. The w value for the cube is
600mm. Thew,hand lvalues for the horizontal cuboid are 600mm, 600mmand 3300mm,
respectively. Thew,handl values for the vertical cuboid are 600mm, 2700mmand 600mm,
respectively.
– Step 2: Investigate the effect of obstruction width. Each of the obstructions is placed at the middle of the window (lv = 1650 mm), and the w varies from 0 mm to 1000 mm with an
interval of 100mm. The differences in the simulation for each obstruction type are as follows:
1. Cube: Thelh value for the cube is 1800mm(Figure 4b).
2. Horizontal cuboid: Thehandlvalues are 600mmand 3300mm, respectively. Thelhvalues
range from 600mmto 2100mmwith an interval of 300mm(Figure 4b).
3. Vertical cuboid: The study for the vertical cuboid is divided into two parts: (1) The effect of widths are analyzed by changing thewvalues. Thehandlvalues are 2700mmand 600mm,
a. The movement tracks of differnet obstruction types in the first step
b. The variations of the widths of differnet obstruction types in the second step
Vertical movement of the cube
Horizontal movement of the cube
Movement of the vertical cuboid
Movement of the horizontal cuboid
c. Varieties of the models with only vertical cuboid obstructions in the second step
d. Varieties of the model with both vertical and horizontal obstructions in the third step
[image:9.595.178.429.137.634.2]of the obstructions are reported with regard to different total lengths and arrangements. Twenty-eight varieties of simulation models are proposed (Figure 4c). These varieties are different in two respects. The first respect is the total length or lt. The chosen lt values
range from 600mmto 2400mmwith an interval of 300mm. The second is the obstruction
distribution method. Four methods are used to arrange the obstructions. They are described as follows: one single obstruction placed next to the left edge of the window; one single obstruction placed at the middle of the window; two obstructions placed next to the two edges of the window; two obstructions placed with equal distances between the two window edges and each other. Theh values for the vertical cuboid obstructions in all the varieties
are 2700mm.
– Step 3: Calculate the maximum usable space. Twenty-three varieties of optimized models with vertical and horizontal cuboid obstructions are designed based on the results of the previous two steps (Figure 4d). For each model, theVmaxvalues of vertical and horizontal cuboid obstructions
are calculated for both 200luxand 300luxilluminance contours on the 850mmhigh working
plane. The dimensions and distribution methods of the obstructions are as follows:
1. Horizontal cuboid obstructions: Three types of horizontal cuboids are selected for different varieties. Two types consist of only one horizontal cuboid with anhvalue of 850 mmand
1150mm. The third type consists of two horizontal cuboid obstructions: one located on the
floor with anh value of 850mmand one under the roof with an hvalue of 300 mm. The hvalue of the horizontal cuboid used in the last variety is 1080mmbecause of theW W R
limitation.Thel values for the horizontal cuboid obstructions in all the varieties are 3300 mm.
2. Vertical cuboid obstructions: The distribution method of two obstructions placed with equal distances between the two window edges and each other is used in all but three model varieties. In two of these exceptional varieties, a single vertical cuboid is used, because when
ltis less than 250mm, using one vertical cuboid is more practical than two in a real project.
Thelt values of the vertical cuboid are different with regard to four W W Rvalues, which
range from 30% to 60%.
3 The effect of the single obstruction position
In this section, a single cube or cuboid obstruction is moved along the vertical and horizontal tracks in front of the window. TheDvalues are calculated for 300lux, 500luxand 800 luxilluminance
contours on four working plane heights, which are 0mm, 400mm, 850mmand 1100mm.
3.1 Cube position
The variations inD values at eight position heights are displayed in Figure 5. For 800lux
illumi-nance contours, theD800values decline sharply when the obstruction is located above yet close to
the working plane, in particular, when the difference between thelh value and the working plane
height ranges from 50mmto 600mm. For the 500luxilluminance contours, the worstD500values
on all working planes appear in lh at 1500 mm, while theD300 values decrease marginally with
the increase oflh. The average difference with the highest D300value is 247mm.
Based on the results above, whenlh reaches 1800mm, the obstruction effects all three
illumi-nance contours, but none of the D values is equal to 0. Therefore, 1800mmis selected as the lh
value in the investigation of the effect of horizontal positioning so that all changes can be observed. Figure 6 shows the results. The best-performingD800andD500are achieved when thelv values are
greater than 1200mm, while thelv values for the best-performingD300can be as low as 900mm.
a. 800 lux
b. 500 lux
c. 300 lux
[image:11.595.194.396.132.619.2]a. 800 lux
b. 500 lux
c. 300 lux
[image:12.595.195.399.133.625.2]values, and the average differences between the lowest and the highest D values range from 226 mmto 316mm.
Based on these two groups of experiments, the impact of the vertical position change of a small obstruction for lower illuminance contours is found to be minimal. For medium light requirements, placing an obstruction at a height of 1500 mm should be avoided. The suggested placement of
the obstruction is at least 600mm higher than the working plane for higher light requirements.
In particular, for the working planes with heights of 0mm, 400mm, 850mmand 1100mm, the
suggested placement heights of the obstruction are 600mm, 1000mm, 1450mmand 1700 mm,
respectively. The change in horizontal position of a small-sized obstruction has an imperceptible effect on daylighting.
3.2 Vertical cuboid position
Due to the larger volume of the vertical cuboid in comparison with the cube, this paper only presents theD300values on all working planes. See Figure 7 for the results. As is evident, curves of D300on a lower working plane increase slightly with an increase inlv. For 0mm, 400mmand 850 mmhigh working planes, the average differences between the lowest and highestD300 values are
107mm, 88mmand 156mm, respectively. Note that, for the 1100mmhigh working plane, the D300 values are 0 when thelv values are equal to or smaller than 600mm, thus a vertical cuboid
should be placed at least 900mmaway from the window edge under this condition.
Fig. 7 Dof the vertical cuboid at different horizontal positions for the 300luxilluminance contour
3.3 Horizontal cuboid position
Figure 8a presents the D800 values of the horizontal cuboid at different position heights on all
working planes. The lowestD800 values for all working planes appear when the difference between
thelhand the working plane height ranges from 50 to 600mm. Figure 8b shows that the lowestD500
value on 0 and 400mmhigh working planes appears whenlh is 900mm, while the lowest values
on 850mmand 1100mmhigh working planes are reached when the values oflhrange from 1200 mmto 1500mm. Compared withD800, the worstD500values appear in a much narrowerlhrange,
[image:13.595.182.411.398.566.2]a. 800 lux
b. 500 lux
c. 300 lux
[image:14.595.195.400.127.623.2]rapidly sink to the lowest point on all working planes, whenlh reaches 1500mm. In the highest
position, theD values are close to the largestD values; however, the average difference between
theD300 at the highest position and the greatestD300value is 755 mm, which is considerable.
Overall, the impact of the horizontal position change is less significant than the impact of the vertical position change. Based on these results, the suggested positioning of a single tall solid wall is at least 900mmaway from the fa¸cade edge, if the required working plane is higher or equal to
1100mm. With regard to a wide solid wall, its placement at the height of 1500mmhas the most
adverse effect for a lower illuminance requirement. For higher illuminance requirements, the adverse effect heights vary depending on the working plane height. In general, the suggested placement of a wide solid wall is at least 600mmhigher than the working plane. In particular, for the working
planes with heights of 0mm, 400mm, 850mmand 1100mm, the suggested placement heights of
the wide solid wall are 600mm, 1000mm, 1450mmand 1700mm, respectively.
4 The effect of obstruction width
In this section,Dvalues of the three obstruction types with different widths are calculated. Based
on these results, this paper presents the maximum widths of all obstruction types and the maximum volumes of combined vertical cuboid obstructions with regard to differentW W Rvalues.
4.1 Cube width
The D values on all working planes are shown in Figure 9. For the 1100mmworking plane, the
curves ofD800 and D500 values appear to have relatively significant declines with the increase of w. The differences between the minimum and maximumDvalues on the same working plane range
from 0mmto 711mm. However, for other working planes the differences are smaller: The smallest
value is 3mm, while the greatest value is 369mm, and the average differences range from 110mm
to 225mm. Therefore, the width has a larger effect on daylighting on the 1100mmhigh working
plane than on other working planes when the obstruction height is 1800mm. If 500mmis set as
the acceptable difference level for the 1100mmhigh working plane, the suggestedwmaxvalues are
500mmfor the 800luxilluminance contour, 400mmfor the 500luxilluminance contour, and 800 mmfor the 300 lux illuminance contour; for other working planes, the width of the obstruction
can reach 1000mm.
4.2 Vertical cuboid width
Figure 10a shows that theD800 values decline sharply to 0 in a very narrowwrange of 100 to 300 mmon all the working planes. For the 500 luxilluminance contour, Figure 10b shows that, on all
working planes, theD500value remains the same or decreases slightly before a certainwvalue and
then theD500value declines sharply to the 0 point. As shown in Figure 10c, when the illuminance
contour is as low as 300 lux, there is no 0 point for D300 on 0 mm and 400 mm high working
planes. However, the same trend also appears for theD300 values on a higher working plane. As
is evident from Figure 10d, the differences between all the D300 values and the minimum D300
value range from 0mmto 533mmbefore the abrupt declines, which means that the daylighting is
scarcely influenced by the width before this point. This phenomenon reveals that thew that leads
a. 800 lux
b. 500 lux
c. 300 lux
[image:16.595.195.399.135.617.2]a. 800 lux b. 500 lux
c. 300 lux d. The differences between all the D
[image:17.595.97.503.130.437.2]300 and the minimum D300
Fig. 10 Dvalues of the vertical cuboid with different widths for different illuminance contours and the differences
between all theD300values and the minimumD300
4.3 Maximum volume of the vertical cuboid
In line with the result in Section 4.2, twenty-eight simulation models are presented in Figure 4c. The simulations are conducted to identify thewmaxof different vertical cuboid obstructions.
The wmax values of each variety for the 300 lux illuminance contour on the 850 mm high
working plane are presented in Figure 11a. The maximum volumesVmax of the obstructions are
calculated, as shown in Figure 11b, in which W W Ris used in the x-axis. Figure 11a shows that
when theltremains the same, thewmaxcurves of the models with two obstructions are above the
curves of the models with one obstruction. For the models with a single obstruction, those with an obstruction at the middle of the window always achieve greater wmax values compared with
the ones with an obstruction at the window edge. This result is consistent with the result for the maximum volume in Figure 11b. For the models with two separate obstructions, the obstructions located next to window edges perform better than the other distribution methods when the lt
values are smaller than 1500 mm, whereas with the increase of lt, their performances tend to
become similar. Note that, in Figure 11a, the greatestwmax for all curves appears whenltis 600 mm, while in Figure 11b, the peak value ofVmax appears whenW W Ris 72.72%, whereltis 900 mm. Therefore,Vmaxis indicative of a more accurate value in usable space calculations. However,
in practice, a W W Rvalue greater than 60% is not recommended due to the energy performance
of a fa¸cade [GB50034, 2013]; thus the calculation ofVmaxfor combined constructions is necessary.
a. The wmax of each variety b. The Vmax of each variety
[image:18.595.89.494.124.291.2]3
Fig. 11 Thewmax,Vmaxof each simulation variety for the 300lux illuminance contour on the 850mmhigh
working plane
4.4 Horizontal cuboid width
The ideal locations for the horizontal cuboid are the area under the working plane and the area immediately under the ceiling. For other positions, six groups of models are simulated with different
lh values, ranging from 600 mmto 2100 mm. Figures 12a, b and c show the D300 values in three
representative positions (1500 mm, 1800 mm and 2100 mm), which are higher than all working
planes. In contrast to the curve trends in Section 4.2, only the curves of the obstructions in lower positions have abrupt declines, while at higher positions the curves gradually decrease with the rise ofw. The gradual decline also appears for the Dvalues on a higher working plane in low position
heights. Therefore, accurate wmax values are difficult to determine in this situation. Figure 12d
shows only thew values of the points at which the worstD300values begin to appear. The results
above indicate that the horizontal cuboid in the place wherelh ranges from 1200mmto 1800mm
provides limited usable space and has serious implications for daylighting performance.
5 The maximum volume of combined obstructions
Taking into account all factors, the simulations in this section offer examples of how to select better-performing fa¸cade configurations to provide more usable space in perimeter zones without jeopardizing daylighting. Twenty-three varieties of simulation models were designed (Figure 4d), and for each model theVmaxvalues of vertical and horizontal cuboids were calculated for both 200 luxand 300luxilluminance contours on the 850mmhigh working plane. The results are presented
in Tables 3 and 4.
The results show that when theW W Rvalues are equal, the model that has one vertical cuboid
with an h value of 850 mm and two horizontal cuboid obstructions placed next to the window
edges provides a larger usable space volume than the other models with different combinations. For both 200 lux and 300 lux illuminance contours, the greatest Vmax value appears when the W W R is 50%, which is neither the lowest nor the highestW W R value. The second best Vmax
value for the 200 lux illuminance contour appears when the W W R is 40%, while for the 300 lux illuminance contour, the best value still appears when W W R is 50%, but with a different
obstruction positioning (two vertical cuboid obstructions placed with equal distances between the window edges and each other). For the 300luxilluminance contour, when theW W Ris 30%, the
a. 1500 mm position height b. 1800 mm position height
c. 2100 mm position height d. The w
[image:19.595.95.493.127.430.2]maxof the horizontal cuboid
Fig. 12 D values of the horizontal cuboid with different widths at different position heights for the 300lux
illuminance contour and thewmaxof the horizontal cuboid for the 300luxilluminance contour on the 850mm
high working plane
Table 3 Vmaxof the models with combined obstructions for the 300luxilluminance contour (m3)
1 2 3 4 5 6
V-cuboid1
H-cuboid V-cuboid H-cuboid V-cuboid H-cuboid V-cuboid H-cuboid V-cuboid H-cuboid V-cuboid H-cuboid
A 30% 0.549 a2
0.480 a 0.195 a 0.391 a 0.244 3.112 0.195 1.746
B 40% 0.762 a 0.635 a 0.729 a 0.713 a 0.744 3.909 0.713 1.898
C 50% 1.271 a 1.122 a 0.746 a 0.574 a 0.495 4.364 0.653 2.315
D 60% 0.903 a 0.858 a 0.797 a 0.858 a 5.560
1
“V-cuboid” means the vertical cuboid, and ”H-cuboid” means the horizontal cuboid.
2
“a” means thewvalue of the obstruction can be as high as the room depth.
the 200lux illuminance this difference is less significant. Except the best and worst performance
[image:19.595.91.537.528.586.2]Table 4 Vmaxof the models with combined obstructions for the 200luxilluminance contour (m3)
1 2 3 4 5 6
V-cuboid1
H-cuboid V-cuboid H-cuboid V-cuboid H-cuboid V-cuboid H-cuboid V-cuboid H-cuboid V-cuboid H-cuboid
A 30% 1.544 a2
0.892 a 0.977 a 0.830 a 0.635 4.326 0.391 3.036
B 40% 1.779 a 1.499 a 1.303 a 1.101 a 1.318 5.199 1.148 2.808
C 50% 2.096 a 1.568 a 1.049 a 0.812 a 0.772 5.806 0.944 3.036
D 60% 1.328 a 1.093 a 1.207 a 1.176 a 7.306
1
“V-cuboid” means the vertical cuboid, and ”H-cuboid” means the horizontal cuboid.
2
“a” means thewvalue of the obstruction can be as high as the room depth.
6 Conclusions
This paper investigates the effects of obstructions in front of a window on daylighting under an overcast sky. Based on the results, the maximum volumes of the usable space for 51 varieties of fa¸cade configurations are presented in two tables. These tables can help architects to determine the usable space volume for a fa¸cade with a similar fenestration geometry. The primary findings of this study can be summarized as follows:
First, the impact of a small-sized obstruction for lower daylight requirements is insignificant. In fa¸cade design, the suggested placement of wide solid walls is at least 600mmhigher than the
required working plane so that the daylight level on the working plane can reach 800 lux, and
500 lux daylight can penetrate 350 mm or more deeper into the room. In addition, placing the
wide solid walls at a height of 1500mm, which has the most adverse effect on a lower illuminance
requirement, should be avoided. The suggested placement of a tall solid wall is at least 900mm
away from the window edge for a higher working plane to make sure the daylight level in front of the wall reaches 300lux.
Second, the results of the maximum usable space volume show that fa¸cades with two separate tall solid walls produce up to 1.43 m3 more usable space than those with a single tall solid wall.
Therefore, an even distribution of several tall solid walls and windows is recommended over a single large piece of tall solid wall and a window. For a fa¸cade with tall solid walls only, the maximum volume of usable space appears when W W R is 72.72%, which does not, however, meet energy
standards; thus, an optimized fa¸cade design that incorporates all aspects of the built environment is essential.
Third, in terms of the optimized design of a fa¸cade with tall solid walls, wide solid walls and a fenestration in the middle, neither the greatestW W Rvalue nor the smallestW W Rvalue leads
to the maximum volume of usable space. The optimalW W Rfound for usable space and daylight
demand is 50%, which provides up to 2.10m3
of usable space volume. If the daylight requirement is lower, theW W Rvalue of 40% provides the second largest maximum volume of usable space so
that windows can be designed with considerable architectural freedom. However, a W W Rvalue
equal to or lower than 30% is not recommended for small residential rooms.
The conclusions of this study are drawn mainly based on evaluating the daylight level in a south oriented room with obstructions against Chinese standards. It would also be important to examine the impacts on the indoor thermal and visual, e.g., overheating and glare, of increasingW W Rfor a
References
Alkhresheh MM (2012) Preference for void-to-solid ratio in residential facades. Journal of Environ-mental Psychology 32(3):234 – 245
Alzoubi H, Al-Rqaibat S, Bataineh RF (2010) Pre-versus post-occupancy evaluation of daylight quality in hospitals. Building and Environment 45(12):2652 – 2665
Baker N, Steemers K (2002) Daylight Design of Buildings: A Handbook for Architects and Engi-neers. United Kingdom, london: Earthscan
Bordas-Astudillo F, Moch A, Hermand D (2003) The predictors of the feeling of crowding and crampedness in large residential buildings. People, places, and sustainability pp 220–228 Bougdah H, Sharples S (2009) Environment, technology and sustainability. Taylor & Francis Chan EH, Tang Bs, Wong WS (2002) Density control and the quality of living space: a case study
of private housing development in hong kong. Habitat International 26(2):159–175
Cheung H, Chung T (2008) A study on subjective preference to daylit residential indoor environ-ment using conjoint analysis. Building and Environenviron-ment 43(12):2101 – 2111
DIALux (2013) 4.11. 0.2, computer program. DIAL GmbH, L¨udenscheid,Germany
Du J, Sharples S (2011) The variation of daylight levels across atrium walls: Reflectance distribution and well geometry effects under overcast sky conditions. Solar Energy 85(9):2085–2100
Gagne J, Andersen M (2012) A generative facade design method based on daylighting performance goals. Journal of Building Performance Simulation 5(3):141–154
GB50034 (2013) The People’s Republic of China National Standard GB 50033 — 2013 Standard for lighting design of buildings. Beijing, China: China Standard Press
GB50180 (2002) The People’s Republic of China National Standard GB50180 — 93 Code for Urban residential district planning and design. Beijing, China: China Standard Press
GB50352 (2005) The People’s Republic of China National Standard GB50352 — 2005 Code for design of civil buildings. Beijing, China: China Standard Press
Ghisi E, Tinker JA (2005) An ideal window area concept for energy efficient integration of daylight and artificial light in buildings. Building and Environment 40(1):51 – 61
Gifford R (2007) The consequences of living in high-rise buildings. Architectural science review 50(1):2–17
Hausladen G, de Saldanha M, Liedl P, Peat RD (2008) ClimateSkin: building-skin concepts that can do more with less energy. Germany: Birkh¨auser
Hochberg A, Hafke JH, Raab J (2010) Open/close: Windows, Doors, Gates, Loggias, Filters. Ger-many: Birkh¨auser Verlag AG
Husin SNFS, Harith ZYH (2012) The performance of daylight through various type of fenestration in residential building. Procedia - Social and Behavioral Sciences 36(0):196 – 203
Jin H (2002) The traditional chinese housing in severe cold region. New Ideas of the New Century 2:78–83
Kim G, Kim JT (2010) Healthy — daylighting design for the living environment in apartments in korea. Building and Environment 45(2):287 – 294
Lartigue B, Lasternas B, Loftness V (2013) Multi-objective optimization of building envelope for energy consumption and daylight. Indoor and Built Environment p 1420326X13480224
Lavafpour Y, Sharples S (2014) Impact of the envelope geometry on cooling demand in very airtight uk dwellings under current and future weather projections. Energy Procedia 62:421–430 Leslie R (2003) Capturing the daylight dividend in buildings: why and how? Building and
Envi-ronment 38(2):381 – 385
Li DH (2010) A review of daylight illuminance determinations and energy implications. Applied Energy 87(7):2109 – 2118
Liu E, Wu J, Lee Sl (1999) Housing standards of private dwellings. Research and Library Service Division, Legislative Council Secretariat
Mohamed B (2008) Daylighting, architecture and health. United Kingdom: Architectural Press Parpairi K, Baker N, Steemers K, Compagnon R (2002) The luminance differences index: a new
indicator of user preferences in daylit spaces. Lighting Research and Technology 34(1):53–66 Reinhart CF, Wienold J (2011) The daylighting dashboard — a simulation-based design analysis
for daylit spaces. Building and Environment 46(2):386 – 396
Rooney N (2001) Making house into home: Interior design in hong kong public. Consuming Hong Kong 1:47
Rooney N (2003) At home with density, vol 1. Hong Kong University Press
Ruck N, Aschehoug O, Aydinli S, Christoffersen J, Edmonds I, Jakobiak R, Kischkoweit-Lopin M, Klinger M, Lee E, Courret G, et al (2000) Daylight in buildings-a source book on daylighting systems and components. Tech. rep., Lawrence Berkeley National Laboratory, Berkeley (USA) SHANGHAI (2012) The annual statistical bulletin of economy and social development in Shanghai,
Available from: http://www.stats-sh.gov.cn/sjfb/201302/253153.html
Smith C, Levermore G (2008) Designing urban spaces and buildings to improve sustainability and quality of life in a warmer world. Energy policy 36(12):4558–4562
Su X, Zhang X (2010) Environmental performance optimization of window - wall ratio for different window type in hot summer and cold winter zone in china based on life cycle assessment. Energy and Buildings 42(2):198 – 202
Ullah I, Shin S (2014) Highly concentrated optical fiber-based daylighting systems for multi-floor office buildings. Energy and Buildings 72:246–261
¨
Unver R, ¨Ozt¨urk L, S¸¨ukran Adıg¨uzel, C¸ elik O (2003) Effect of the fa¸cade alternatives on the daylight illuminance in offices. Energy and Buildings 35(8):737 – 746
Wong JF (2010) Factors affecting open building implementation in high density mass housing design in hong kong. Habitat International 34(2):174–182
You W, Qin M, Ding W (2013) Improving building facade design using integrated simulation of daylighting, thermal performance and natural ventilation. Building Simulation 6(3):269–282 Mahtab-uz Zaman Q, Lau SS (2002) Difficulties in achieving open building in the mass housing in
hong kong and implication of user participation. Architectural Science Review 45(3):175–181 Zhao Y, Mei H (2013) Dynamic simulation and analysis of daylighting factors for gymnasiums in