
Oscillations of aqueous PEDOT:PSS fluid droplets and the properties
of complex fluids in drop-on-demand inkjet printing
Stephen D. Hoath
a,⇑, Wen-Kai Hsiao
a,1, Graham D. Martin
a, Sungjune Jung
b, Simon A. Butler
c,
Neil F. Morrison
d, Oliver G. Harlen
d, Lisong S. Yang
e, Colin D. Bain
e, Ian M. Hutchings
aa
University of Cambridge, Department of Engineering, Cambridge CB3 0FS, UK
bPohang University of Science and Technology, Department of Creative IT Engineering, South Korea c
University of Cambridge, Department of Chemical Engineering and Biotechnology, Cambridge CB2 3RA, UK d
University of Leeds, School of Mathematics, Leeds LS2 9JT, UK e
University of Durham, Department of Chemistry, Durham DH1 3LE, UK
a r t i c l e
i n f o
Article history:
Received 12 February 2014
Received in revised form 15 May 2015 Accepted 16 May 2015
Available online 23 May 2015
Keywords:
Inkjet printing PEDOT:PSS Shear thinning fluids Drop oscillations Dynamic surface tension Shear thinning recovery time
a b s t r a c t
Shear-thinning aqueous poly(3,4-ethylenedioxythiophene): poly(styrene sulphonate) (PEDOT:PSS) fluids were studied under the conditions of drop-on-demand inkjet printing. Ligament retraction caused oscil-lation of the resulting drops, from which values of surface tension and viscosity were derived. Effective viscosities of <4 mPa s at drop oscillation frequencies of 13–33 kHz were consistent with conventional high-frequency rheometry, with only a small possible contribution from viscoelasticity with a relaxation time of about 6ls. Strong evidence was found that the viscosity, reduced by shear-thinning in the print-head nozzle, recovered as the drop formed. The low viscosity values measured for the drops in flight were associated with the strong oscillation induced by ligament retraction, while for a weakly perturbed drop the viscosity remained high. Surface tension values in the presence of surfactant were significantly higher than the equilibrium values, and consistent with the surface age of the drops.
Ó2015 The Authors. Published by Elsevier B.V. This is an open access article under the CC BY license (http:// creativecommons.org/licenses/by/4.0/).
1. Introduction
Inkjet printing commonly involves the use of fluids with com-plex rheology[1], primarily to achieve the required properties on the substrate but also to achieve reliable jet and drop formation. Aqueous PEDOT:PSS (poly(3,4-ethylenedioxythiophene): poly(-styrene sulphonate)) is an example of such a fluid, commonly printed to form transparent conductors [2,3]. It has been shown to behave particularly well in drop-on-demand (DoD) inkjet print-ing[4]in comparison with Newtonian fluids exposed to the same conditions. [5] Typical shear rates are >105s1 within the small nozzles (with diameter ca. 40
l
m) employed in DoD printing, for jet velocities of the order of 5 m s1, well beyond the range of mea-surement of conventional rheometers. Once outside the nozzle, conditions within the fluid jet involve much lower shear rates, with
two major exceptions. The first occurs locally at points where the jet necks down as it pinches off. The second occurs if the drop oscil-lates in shape. Data from the work of Brenn and Teichtmeister[6]
can be used to estimate that very high shear rates (>105s1) will occur within oscillating drops with sizes typical of DoD printing (i.e. with diameters of the order of 50
l
m).High frequency rheological measurements show aqueous PEDOT:PSS to be highly shear-thinning. It also has a marked ten-dency to form fewer satellite drops (by break-up of the jet behind the main drop) in DoD printing than Newtonian fluids under the same printing conditions[4]. Reduction or elimination of satellite drop production is of key importance in inkjet printing for func-tional applications.
Although the recovery time for many shear-thinning fluids can be >1 s, recent studies[7]have suggested that the delays observed in ligament break-up for aqueous PEDOT:PSS solutions are consis-tent with much shorter times (100
l
s) for the recovery of high viscosity once the jet is outside the nozzle, following the high shear-rate conditions (and resulting low viscosity) within the noz-zle. However, interpretation of the data is possibly complicated by the presence of viscoelasticity, and also by the uncertain influence of the surfactant added to PEDOT:PSS formulations for practicalhttp://dx.doi.org/10.1016/j.jnnfm.2015.05.006
0377-0257/Ó2015 The Authors. Published by Elsevier B.V.
This is an open access article under the CC BY license (http://creativecommons.org/licenses/by/4.0/).
⇑Corresponding author. Tel.: +44 1223 764626; fax: +44 1223 464217.
E-mail address:[email protected](S.D. Hoath).
1
Current address: Research Center Pharmaceutical Engineering (RCPE) GmbH, Graz, Austria.
Contents lists available atScienceDirect
Journal of Non-Newtonian Fluid Mechanics
printing applications. The present work uses measurements of the oscillation of drops generated from a DoD print-head to explore shear thinning and recovery, viscoelasticity and time-dependent surface tension in drops of the appropriate size for inkjet printing. Oscillation of a printed drop in free flight may be initiated by the retraction of an attached ligament or by coalescence with a sec-ond drop either leading or trailing the main drop. Dynamic mea-surements of viscosity and surface tension can be extracted from the decay rates and frequencies of the resulting oscillation. [8– 10]Lamb[11]showed that for Newtonian fluids, where the restor-ing force is due to the surface tension and the damprestor-ing is provided by viscosity, for small amplitudes the fundamental free shape (l= 2) mode of oscillation will dominate. A non-Newtonian fluid will respond like a Newtonian fluid with a viscosity appropriate to the drop oscillation frequency. This dynamic viscosity determi-nes the decay rate of the oscillations. The surface tension may be altered by the diffusion of surfactants to the newly created fluid surface; the oscillating drop provides information relevant to the surface age of a printed drop in flight, which will typically be smal-ler by a factor of 102-103than the >0.01 s timescale over which dynamic surface tension is conventionally measured[4,10].
Drop oscillation will also be affected by viscoelastic behaviour in the fluid[12]and it is possible that this might be more impor-tant than shear-thinning in its effect on the production of satellite drops[4], although simulations of DoD jetting behaviour using the Carreau model for shear-thinning[13]have suggested that satellite suppression is possible without invoking viscoelastic behaviour. The use of a Giesekus model[14,15]might allow the incorporation of elasticity, but under DoD printing conditions it predicts only moderate (<2-fold) shear-thinning, far less than that observed in aqueous PEDOT:PSS. The theory for viscoelastic drop oscillations by Khismatullin and Nadim[12] has been recently extended by Brenn and Teichtmeister[6]. These papers show a small influence of elasticity on the oscillation frequency of viscoelastic drops and indicate how measurements of rheological behaviour and oscilla-tion decay rate might be used to estimate upper limits for a vis-coelastic relaxation time.
2. Models for drop oscillation
Rayleigh[16]investigated the free axisymmetric oscillation of an inviscid drop in the small amplitude, linear regime. He described the distortion of the spherical drop by an infinite series of orthogonal surface spherical harmonics, i.e. natural oscillation modes. The axisymmetric form is:
rðh;tÞ ¼r0 1þ X1
l¼2
alðtÞPlðcoshÞ
" #
ð1Þ
wherePl(cosh) are the Legendre polynomials,r0is the unperturbed radius of the drop,alis the amplitude of thelth mode of oscillation (with fundamental model= 2), andhis the polar angle of the spher-ical coordinate system with its origin at the centre of the drop. The angular frequencyXlof thelth oscillation mode is given by
X
l¼ffiffiffiffiffiffiffiffiffiffiffiffiffiffiffiffiffiffiffiffiffiffiffiffiffiffiffiffiffiffiffiffiffi
r
lðl1Þðlþ2Þq
r3 0 s; ð2Þ
where
r
andq
are the surface tension and density of the fluid, respectively.For viscous liquids and an oscillation amplitude that is small compared tor0, Lamb[11]obtained an irrotational approximation. If the oscillation amplitude decays exponentially asAlexp(t/
s
l), then the decay times
l and the angular frequency of oscillationXl⁄are given by
s
l¼q
r2 0g
ðl1Þð2lþ1Þ ð3Þand
X
l ¼X
lffiffiffiffiffiffiffiffiffiffiffiffiffiffiffiffiffiffiffiffiffiffiffiffiffiffi
1 ð
X
ls
lÞ2q
ð4Þ
where
g
is the viscosity of the fluid. Prosperetti [17]and Becker et al.[18]pointed out that for Ohnesorge numberOh=g
/(qr
r0)1/2 < 0.1 and small oscillations of fundamental model= 2 with ampli-tude not exceeding 0.1r0, Eqs.(3) and (4)will apply. Even for initial amplitudes as large as 0.2r0, the change in fundamental frequencyX2(i.e.Xlwherel= 2) is 2.5%.[18]Smith[19]has shown that the time-dependent variations in the decay factor of the fundamental mode for oscillation amplitudes as large as 0.3r0can be approxi-mated by an additional component that is quadratic in this ampli-tude and less than 25% below the linear result, even at this limit.
Computer simulations for generalised Newtonian fluids suggest that the shear rate within a jetted ligament falls rapidly after it leaves the nozzle, with the major contributions to high shear-rate arising from the velocity variation in the outer surface of the ligament. The outermost regions of drops are significant for vorticity in shape oscillations.[17]
Eq.(4)implies that the shape will not oscillate but the deforma-tion will decay aperiodically ifXl< 1/
s
l; for example, for drops of 50l
m diameter with the density of water and a surface tension of 32 mN/m, the viscosity must be less than 16 mPa s for oscillation to occur.Linear viscoelastic behaviour in a polymer solution can be mod-elled by a (viscous) dashpot in series with a parallel combination of a linear (elastic) spring and another (viscous) dashpot, yielding
[12]the Jeffreys constitutive equation relating the deviatoric stress
s
and rate of strainc
_:s
þk1@
s
@t¼2
g
c
_þk2 @c
_ @t
ð5Þ
k1 andk2 represent the relaxation and retardation times respec-tively, where 06k26k1. Ifk1=k2the response is Newtonian while k2= 0 corresponds to the Maxwell model of a simple series combi-nation of a dashpot and spring. The ratio of solvent and solution vis-cosities isk2/k1. Relaxation and retardation Deborah numbersDe1 and De2 are defined by De1=k1 X2 and De2=k2 X2. The ratio between the viscosities for the solvent and the solution isDe2/De1. Khismatullin and Nadim [12]consider asymptotic limits that are useful here. In the limit of low Deborah number, the drop oscillation frequency isX2*given by Eq.(4). Aqueous PEDOT:PSS fluid droplets with a high shear rate viscosity of 3 mPa s have a sufficiently high Reynolds number (Re= 26) that drop oscillation theory pertinent to low viscosity conditions should apply. For aqueous 1.1 wt% PEDOT:PSS fluid drops with a viscosity of 75 mPa s (which should prevent oscillation) Re would be reduced to order unity. Calculations were made using the full theory[12]rather than with
De2= 0 asymptotic limits to explore both periodic damped oscilla-tions and aperiodic (over-damped) condioscilla-tions. The results are dis-cussed more fully below, but it is useful to explore the asymptotic solutions here.
At high fluid viscosities where the system is over-damped, the distortion decays exponentially with both a slow rate arising from surface tension, and a fast decay rate driven by the viscosity only
[12]. The slow exponential decay rated1is given by
d1¼
lðlþ2Þð2lþ1Þ
r
2ð2l2þ4lþ3Þ
g
R¼ 20 19r
The fast decay rated2is given by:
d2¼
2ðl1Þð2l2þ4lþ3Þ
g
ð2lþ1Þð1þElÞq
R2 ffi6:90
g
q
R2 for thel¼2 mode:ð7Þ
The mode-dependent term [12] El= 4l(l1)(l+ 2)/[(2l+ 1)(2l+ 3) (2l+ 5)] is always small (61/2). For the fluid properties and drop sizes considered in this work, 1/d130
l
s and 1/d21l
s, so that the slow decay process dominates for all practical purposes. Measurement of aperiodic shape decay (for a drop of known size) can therefore provide a measurement of the ratior
/g
.In the low viscosity limit, for oscillating drops, the viscoelastic correction to Eq.(3)involves replacing viscosity
g
byg
0(X2), the real part of the complex viscosity at frequency X2, where
g
0=g
(1 +De1De2)/(1 +De12), since the decay rate is determined by the component of the stress in phase with the velocity, according to Khismatullin and Nadim[12]. To leading order the frequency of drop oscillationXis given by:X
2¼X
22þ5g
00=ðq
R2Þ ð8Þ
where
g
00=g
(De1De2)/(1 +De12) is the out-of-phase component of the complex viscosity and represents the additional ‘‘spring-stiffness’’ that is provided by the elastic stress component acting in synchronism with the surface tension. For smallDe2/De1, the maximum oscillation frequency for viscoelastic drops corre-sponds toDe11 in the asymptotic limit. For such rapidly recover-ing weakly viscoelastic fluid drops, the predicted asymptotic effects on frequency are small. ForDe2=De1, the solvent and the solution have the same viscosity and are dynamically equivalent, and so there is no effect of elasticity on the oscillation frequency or decay.
3. Experimental methods and materials
3.1. Drop formation and imaging
A single-nozzle piezoelectric print-head with diamond-like car-bon coating and a 40
l
m diameter nozzle (MJ-ABP, MicroFab Technologies Inc., TX, USA) was used to generate oscillating fluid drops 30 to 60l
m in diameter. A high-speed video camera (Shimadzu HPV-1) recorded enlarged images of the drops via a10 Mitutoyo objective lens (NA = 0.28) and Navitar12 tele-scopic system. The camera recorded a maximum of 102 frames at an exposure time of 0.5l
s at rates of either 5105 or 106frames per second (fps), with the image sensor internally cooled to 10°C, at various exposure and low gain settings. The imaging delay time was adjusted until drop oscillation sequences could be properly captured. Image files were analysed with IrfanView, Visual Basic and MatLab software. The image magnifica-tion was calibrated by imaging long wires of 104l
m diameter and the uncertainty in drop diameter resulting from pixelation and edge detection was ±1l
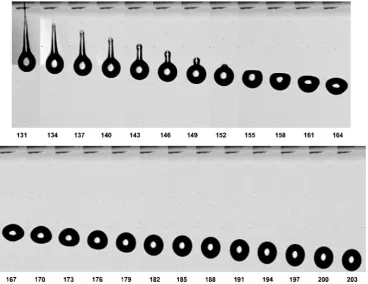
m.Fig. 1shows the typical evolution of jetted material. The first frame shows a drop with a substantial tapering ligament extending from the nozzle just visible at the top of the image. As time pro-gresses the ligament retracts into the drop, which is markedly dis-torted and then oscillates towards its final, near-spherical shape as it travels downwards. Images which were measured to generate the data reported below were captured at later times when the deformation was more symmetrical and was dominated by the fundamentall= 2 mode.
3.2. Fluids
[image:3.595.108.477.448.732.2]Aqueous solutions of PEDOT:PSS, as listed inTable 1, were pre-pared by diluting a commercial solution (Heraeus Clevios PH 1000,
Fig. 1.Images taken from a sequence captured at 106
1.1 wt% solids in water, 1:2.5 PEDOT:PSS by weight, gel particle size d50= 25 nm) with deionised water. One set contained 1.1 wt% and 0.8 wt% solids, with and without the addition of two low molecular weight (<1 kDa) surfactants: 0.23 wt% Dynol 607 and 0.27 wt% Zonyl FSO-100. These formulations were chosen as representative of those used for printed electronics. Other fluids used to further explore the effects of surfactants contained 0.8 wt% PEDOT:PSS with either 0.06 wt% Dynol 607 surfactant or 30 wt% isopropanol (IPA). Dynol 607 has a maximum solubility in water of 0.032 wt% and the excess surfactant additive will there-fore tend to stabilise the PEDOT:PSS particles[8].
Equilibrium surface tension was measured at 21°C with a SITA pro linet-15 bubble tensiometer. Rheological measurements were performed with an ARES rheometer at shear rates up to 15 s1
[image:4.595.43.564.97.191.2]and with a piezo axial vibrator[21](PAV) at frequencies up to 6 kHz.
Table 1shows the measured values of viscosity (the real compo-nent
g
0of complex viscosity) at 1 s1and 4000 s1and of surface tension for the solutions with and without the surfactant mixture. For the most concentrated (1.1 wt%) solution, viscosity fell from >60 mPa s at low shear rate to about 4 mPa s at the highest shear rates. The PEDOT:PSS fluids also exhibited elasticity that steadily reduced with increasing frequency [4]. All the aqueous PEDOT:PSS solutions shear-thinned significantly, but the presence of surfactants did not affect the trends in the rheological behaviour, particularly at the higher frequencies (10–4000 s1).Fig. 2shows the viscous component
g
0defined byG00/(2p
f) for1.1 wt% PEDOT:PSS with and without a total of 0.5 wt% surfactant, measured at frequencies from 0.4 to 4000 s1by ARES (open sym-bols) and PAV (solid symsym-bols). The ARES values were higher than the PAV data due to solvent evaporation, and have been nor-malised to the PAV values at the overlapping frequency range of about 10 s1.
The surfactant additives increased the viscosity for all the PEDOT:PSS suspensions especially at lower frequencies (<10 s1),
with significant non-linear dependence on the concentration of PEDOT:PSS. At the highest frequency (4 kHz), the viscosities of the 1.1 wt% PEDOT:PSS solutions with and without surfactant approached similar values, to within 30%. Even at a frequency of 1 s1the values of
g
0 with and without the surfactant additiveslay within a factor of two, and therefore the effect of adding 0.5 wt% D + Z surfactants on viscosity appears small. The elastic com-ponent
g
00 of complex viscosity was always smaller thang
0at allfrequencies. The frequency variations of viscosity were fitted with Carreau and power law models for later comparison with the vis-cosity values deduced from the oscillating drops.
3.3. Image analysis and data extraction
For the oscillation of drops generated in drop-on-demand print-ing the effect of gravity is negligible, all the oscillation modes are exponentially damped, and damping is so much faster for the higher modes that the behaviour at longer times is dominated by thel= 2 mode. For these slowly moving drops, aerodynamic effects on the drop shape are expected to be small. Therefore if the fluid density is known, the surface tension and viscosity can be extracted by fitting the observed behaviour to that predicted for thel= 2 mode. Surfactant diffusion rates, drop size, ligament col-lapse into the drop and surface age may all influence the effective value of dynamic surface tension for complex fluids containing surfactants.
We measured up-down (along the jet axis, in our experiments, vertical) and left–right (i.e. horizontal) dimensions of the drop images: i.e. the polar and equatorial diameters. For small ampli-tudes such measurements are sensitive only to the even order modes of oscillation, but odd orders of drop shape may also appear initially when there is a large axial impulse such as that caused by the ligament impact shown inFig. 1.
For thel= 2 mode, Eq.(1)reduces to:
rðh;tÞ ¼r0 1þ
1
2a2ðtÞð3 cos
2h1Þ
: ð9Þ
The polar diameter of the drop L= 2r0[1 +a2(t)] and equatorial diameterW=r0[2a2(t)]. The amplitudea2(t) of the fundamental l= 2 mode is calculated fromr0a2(t) = (LW)/3.
The measured time-dependent oscillation amplitude is fitted to the functional form
a2ðtÞ ¼Aexp
t
s
cos 2
p
t T
þaoffset ð10Þ
whereAis the oscillation amplitude at timet= 0 relative to a time offset t0,
s
is the decay time andTis the oscillation period from whichX= 2p
/T. As the initial data may be distorted by the effects of the impinging ligament, these points were excluded from the fit. The maximum instantaneous amplitude at the start of the fitted period was usually less than 3l
m (i.e. <20% of the drop radius).Table 1
Physical properties for pure water (top line) and various concentrations of PEDOT:PSS in water with and without the addition of Dynol 607 (D) and Zonyl FSO-100 (Z) surfactants or isopropanol (IPA). Concentrations are given in wt%. Densities are taken from standard data tables.[20]Entries marked–are estimated values.
PEDOT:PSS (wt%) Surfactant g0(mPa s) at 1 s1 g0(mPa s) at 4000 s1 r
(mN/m) q(kg/m3
)
0 None 1.0 1.0 72.8 1000
1.1 None 63 6.3 70 ± 3 1000
0.8 None 26 4.1 70 ± 3 1000
1.1 0.23% D + 0.27% Z 156 8.2 21 ± 2 1000
0.8 0.23% D + 0.27% Z 41 4.2 21 ± 2 1000
0.8 0.06% D 25 4– 30±1 1000
0.8 30% IPA 25 4– 30±1 780
1.1 0.33% D 68 9– 30– 1000
[image:4.595.50.288.578.713.2]1.1 0.66% D 68 9– 30– 1000
Fig. 2.The viscous componentg0 of complex viscosityg⁄
for aqueous 1.1 wt% PEDOT:PSS with and without 0.23 wt% Dynol 607 and 0.27 wt% Zonyl FSO-100 surfactants, measured by ARES (open symbols) and PAV (solid symbols), normalised to coincide at the overlap frequency of 10 s1
Finite values of the asymmetryaoffsetcan be interpreted as an indi-cator of large amplitude changes.
The fluid viscosity is calculated from Eq.(3)and the effective surface tension from Eqs.(2) and (4). The drop dimensions were determined from the images to an accuracy of 1
l
m, or about 2% of the diameter. The dominant errors in the data extracted from the images were in the vertical and horizontal dimensions of the drops, rather than in the times, as indicated by the error bars in the resulting graphs. The uncertainties in the derived values of sur-face tension and viscosity were estimated for representative drops by analysing sets of data with the extreme values represented by the measurement errors. This suggested confidence limits for sur-face tension and viscosity of ±10% and ±20% respectively.4. Results
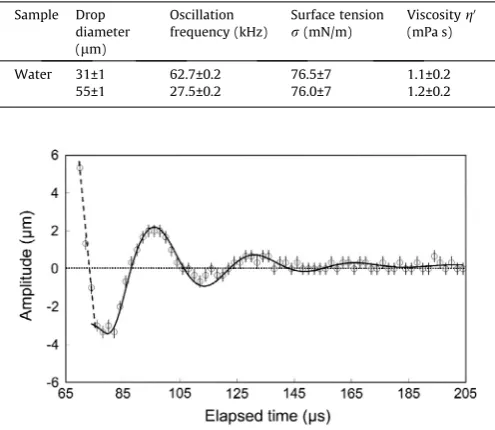
A test of the capability of the experimental method is provided by the use of pure (deionized) water. Fig. 3 shows the data recorded for a 31
l
m diameter drop ejected from the print-head, plotted in terms of the amplitude (L-W)/3, together with the beha-viour predicted by Eqs.(9) and (10)based on a least-squares fit to the data. The curve has an initial amplituder0a2of 1.5l
m (i.e. 10% of the drop radius) and a frequency of 63 kHz, and takes account of only thel= 2 mode; it includes a small zero offset (<0.1l
m). The liquid properties derived from this curve fit werer
= 76 ± 5 mN/m andg
= 1.1 ± 0.2 mPa s, which are to be compared with the standard values for water at 20°C of 72.8 mN/m and 1.0 mPa s.[20]At early times the amplitude variation was greater than the limit of validity of the linear model (approximately ±10%) and also included significant contributions from modes higher thanl= 2: no attempt was therefore made to fit these earlier shapes (as shown for example inFig. 1). Table 2shows the values of viscosity and surface tension obtained for pure water from two different drop sizes, giving different frequencies of oscillation. As expected for a Newtonian liquid, the viscosity showed no significant variation with frequency, and essentially the same value of surface tension was derived for both drop sizes.
Fig. 4shows the amplitude variation for a 44
l
m diameter drop of 1.1 wt% PEDOT:PSS solution, generated from images captured at 5105fps. The initial rapid change of shape (broken line) occurs during the collapse of the ligament into the main drop, and is fol-lowed by decaying oscillation about a spherical drop shape at 29 kHz. The solid line represents the predicted behaviour for a drop with surface tension of 44 ± 4 mN/m and a viscosityg
0 of3.5 ± 0.7 mPa s.
[image:5.595.303.551.103.318.2]Fig. 5shows data for a larger, 58
l
m diameter drop of the same fluid oscillating at the lower frequency of 23 kHz. The effective sur-face tensionr
was 60 ± 6 mN/m with a viscosity of 10±2 mPa s.Table 3summarises the results obtained for the 1.1 wt% aque-ous PEDOT:PSS solutions with and without surfactants, while
Table 4gives results for 0.8 wt% aqueous PEDOT:PSS either with 30 wt% IPA or 0.06 wt% Dynol 607 surfactant. Values of surface ten-sion and viscosity from conventional methods are listed for com-parison. The results clearly show that at the high frequencies involved in drop oscillation, aqueous PEDOT:PSS exhibited quite different properties from those measured by more conventional methods at low frequencies and long timescales. The effective vis-cosity was much lower than the low shear rate values and the effective surface tension was significantly above the equilibrium (long timescale) value. However, the addition of Dynol 607 to excess (above its solubility limit) effectively lowered the surface tension to the equilibrium value.
Fig. 3.Shape oscillations of a 31 ± 1lm (40 pixel) diameter drop of pure water in terms of the amplituder0a2(t) = (LW)/3. The uncertainty in amplitude due to measurement errors was estimated at ±0.26lm. The solid line represents the behaviour predicted for a liquid with the density of water, viscosity of 1.1 mPa s and surface tension of 76.5 mN/m for the fundamental (l= 2) mode. The data points at early times which lie above and below the fitted curve correspond to higher-order, rapidly decaying modes.
Table 2
Properties of pure water derived by the oscillating drop method. Standard values for the surface tension and viscosity at 20°C are 72.8 mN/m and 1.00 mPa s respectively
[20].
Sample Drop diameter (lm)
Oscillation frequency (kHz)
Surface tension
r(mN/m)
Viscosityg0
(mPa s)
[image:5.595.44.273.568.688.2]Water 31±1 62.7±0.2 76.5±7 1.1±0.2 55±1 27.5±0.2 76.0±7 1.2±0.2
Fig. 4.Shape oscillation of a 1.1 wt% PEDOT:PSS droplet, with a diameter of 44 ± 1lm. The initial rapid change (broken line) is not included in the curve fit which corresponds to a surface tension of 44 ± 4 mN/m and a viscosity of 3.5 ± 0.7 mPa s.
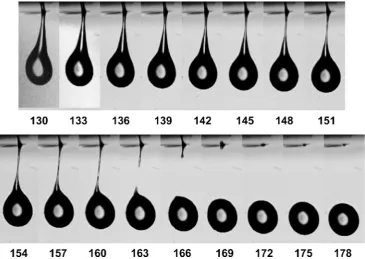
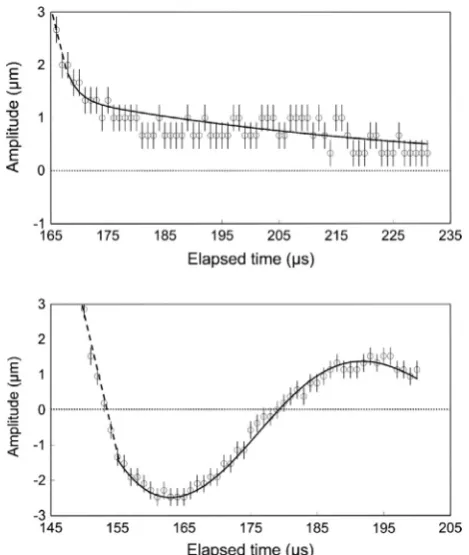
[image:5.595.312.540.583.722.2]While periodic damped oscillation of the drop shape was observed in nearly all experiments with PEDOT:PSS, in one case the drop failed to oscillate but instead exhibited a slow aperiodic decay towards its final spherical shape. A sequence of images is shown in Fig. 6and the data extracted from this experiment is shown inFig. 7(a), where it is compared with the more usual beha-viour of an oscillating drop inFig. 7(b). Both sets of data relate to
[image:6.595.43.562.96.208.2]the same liquid (containing 1.1 wt% PEDOT:PSS and 0.33 wt% Dynol 607); the data plotted in Fig. 7(b) relates to the images shown inFig. 1. The two drops were of similar diameter (48
l
m for the drop shown inFig. 6and 52l
m for that inFig. 1), but while the derived values of surface tension in the two cases were also similar, those for viscosity were significantly different: 75 mPa s for the overdamped drop, and 3 mPa s for the oscillating drop.Table 3
Properties derived from the oscillating drop (OD) method for 1.1 wt% PEDOT:PSS with Dynol 607 (D) and Zonyl FSO-100 (Z) surfactants, and for comparison, the values of surface tension and viscosity measured by conventional methods (CM) or by estimation (–).
D & Z (wt%) Drop diameter (lm)
Oscillation frequency (kHz) (all ± 1 kHz)
Surface tension (OD) (mN/m)
Surface tension (CM) (mN/m)
Viscosity (OD) (mPa s)
Viscosity (CM) (mPa s)
None 53 ± 1 30 80 ± 8 70 ± 3 3.2 ± 0.6 63
0.23 D & 0.27 Z
44 ± 1 29 44 ± 4 21 ± 1 3.5 ± 0.7 68
ditto 46 ± 1 28 48 ± 5 21 ± 1 3.0 ± 0.6 68
ditto 44 ± 1 33 55 ± 6 21 ± 1 3.0 ± 0.6 68
ditto 57 ± 1 18 40 ± 4 21 ± 1 5 ± 1 68
ditto 58 ± 1 23 60 ± 6 21 ± 1 10 ± 2 68
0.33 D 52 ± 1 18 29 ± 3 30– 3.0 ± 0.6 68
0.66 D 44 ± 1 24 33 ± 3 30– 3.0 ± 0.6 68
[image:6.595.39.564.249.352.2]ditto 55 ± 1 13 18 ± 2 30– 2.2 ± 0.4 68
Table 4
Properties derived from OD and CM methods for 0.8 wt% PEDOT:PSS with 0.06 wt% Dynol 607 or 30 wt% isopropyl alcohol (IPA) additives. Additive
(wt%)
Drop diameter (lm)
Oscillation frequency (kHz)
Surface tension (OD) (mN/ m)
Surface tension (CM) (mN/ m)
Viscosity (OD) (mPa s)
Viscosity (CM) (mPa s) 30, IPA 53 ± 1 23 47 ± 5 30 ± 1 7.8 ± 1.5 25
58 ± 1 20 45 ± 5 30 ± 1 3.6 ± 0.7 25
0.06, Dynol 607
52 ± 1 28 68 ± 7 30 ± 1 3.6 ± 0.7 25
ditto 49 ± 1 29 64 ± 6 30 ± 1 3.9 ± 0.8 25
ditto 50 ± 1 28 62 ± 6 30 ± 1 3.7 ± 0.8 25
ditto 50 ± 1 29 65 ± 6 30 ± 1 3.3 ± 0.7 25
ditto 53 ± 1 27 67 ± 7 30 ± 1 3.7 ± 0.8 25
ditto 51 ± 1 29 72 ± 7 30 ± 1 3.6 ± 0.7 25
[image:6.595.119.485.473.732.2]5. Discussion
The oscillating drop method has been widely used in previous work to estimate both surface tension and viscosity for Newtonian liquids, but in most cases with larger drops than those studied here which are representative of drop-on-demand inkjet printing. Yang et al.[8]showed the method to be reliable for drops of water and aqueous hydroxymethylcellulose solution ca. 60
l
m in diameter, and the present results for pure water confirm that finding. Morita et al.[10]have applied it successfully to drops as small as 18l
m diameter, generated from a drop-on-demand print-head. However, for measuring fluid properties over a wide range of timescales the method does have some limitations. As is evident from Eq.(2)and the results inTable 2, for any given fluid (with par-ticular values of surface tension and density) the frequency of drop oscillation is controlled by the drop size, and thus it is not possible to explore a wide range of frequencies by this method without using drops with a correspondingly wide range of sizes. Drop-on-demand inkjet printing involves drops from about 15 to 50l
m in diameter, and the range of oscillation frequencies which can be explored with drops generated by that method (but, also, which is relevant to DoD printing) is therefore small.A further limitation is imposed by the requirement that the drop shape does change in a periodic manner, rather than exhibit-ing an aperiodic decay. This limits the viscosity of the liquid to which the method can be applied. For example, as discussed in Section 2, for a 50
l
m diameter drop with the density of water and a surface tension of 32 mN/m the maximum viscosity at which the drop can be made to oscillate is 16 mPa s.As shown inFig. 2and also demonstrated in earlier work[4], aqueous PEDOT:PSS exhibits marked shear-thinning behaviour in shear rheometry. The viscous and elastic components both fall
with increasing frequency. Viscoelastic drop oscillation theory
[6,12] can be used to estimate the time- and volume-averaged shear rates to be of the order of 2.5103s1
for the 50
l
m diam-eter drops generated here by drop-on-demand jetting. The high-shear rate limit to the fluid viscosity should therefore be approached and maintained within an oscillating drop, at least until the shear-rate falls so that the fluid can recover its viscosity. For almost all the drops of aqueous PEDOT:PSS investigated in the present work, the viscosity values deduced from the decay of the shape oscillation and listed inTables 3 and 4were much smal-ler than the values measured by conventional methods at low shear rates: typically by a factor of up to 20. These values derived from the oscillating drop method (3–4 mPa s in most cases) can be compared with the values deduced from the work of Hoath et al.[4] They showed that the jet speeds attained by 1.1 wt% PEDOT:PSS solution in drop-on-demand inkjet printing were very similar to those achieved, under identical driving conditions, by a Newtonian water–glycerol mixture with a viscosity of 10 mPa s, suggesting that the viscosity of the PEDOT:PSS solution in the printhead nozzle must have been of a similar value, and thus much lower than the low-shear rate viscosity. However, although shear-thinning evidently occurs under the high shear-rate condi-tions to which the fluid is exposed in the printhead nozzle, two pieces of evidence suggest that the viscosity of the fluid then recovers rapidly. One is the observation reported by Hoath et al.
[4]that the speed of radial thinning of the ligament behind the main drop, after it has left the nozzle, is consistent with a much higher value of viscosity.
The second is the observation, as illustrated byFigs. 6and7(a), that in certain circumstances the drop can exhibit the slow aperi-odic shape decay characteristic of high viscosity rather than the periodic oscillation associated with a low viscosity (as shown in
Fig. 7(b). The difference between these two types of behaviour is very marked, and the corresponding values of viscosity differ by a factor of about 20. The ages of the drops were similar (about 150–200
l
s), but the magnitudes of the impulse delivered to these two drops by the collapse of the residual ligament were quite dif-ferent, as shown by the sets of images inFigs. 1 and 6. This analysis suggests that collapse of a large ligament (as shown in Fig. 1) causes a large enough deformation of the drop that the associated deformation rate is sufficient to induce shear-thinning. The shear-thinned droplet then oscillates (for 50–100l
s) and the asso-ciated shear rate maintains the low viscosity states for as long as the drop continues to oscillate. An oscillation amplitude of 5% (i.e. 10% peak to peak) at 25 kHz would generate a shear rate of about 5000 s1, whereas 1% amplitude would correspond to shear rate of about 1000 s1, so the suggestion is not unreasonable. The less massive ligament ofFig. 6, in contrast, provides insufficiently high shear-rate conditions to cause significant shear-thinning in the drop surface, and subsequent shape changes in this more vis-cous drop remain over-damped.These observations suggest that recovery of the viscosity to its low-shear value after ejection of the fluid from the nozzle, for these fluids, must be occurring on a timescale significantly shorter than 100
l
s. Quantitative estimates of the effect of ligament retraction can be made from measurements of the images inFigs. 1 and 6. The retracting ligament shown inFig. 1has an initial volume about 17% of the final spherical drop volume, and its end moves at an ini-tial speed relative to the main drop of 4.6 m/s. The ligament inFig. 6, in contrast, represents only 1.8% of the total drop volume, and its initial tail speed was 5.1 m/s. The kinetic energy and momentum delivered to the two drops by ligament retraction thus differed by a factor of about 8.
[image:7.595.41.276.65.343.2]Extrapolation of the measured viscosity values for 1.1 wt% PEDOT:PSS with surfactant shown in Fig. 2 suggests that at 30 kHz the viscosity should be 4.2 ± 0.1 mPa s, irrespective of
whether a power-law or Carreau model is used. The values derived from the oscillating drop experiments at similar frequencies (shown inTable 3) are somewhat lower at about 3.2 ± 0.6 mPa s. It is useful to examine whether this discrepancy might be accounted for by elastic properties of the fluid which are ignored in the simple analysis, by using the model of Khismatullin and Nadim[12]. Fig. 8shows the non-dimensionalised decay factor and the non-dimensionalised frequency derived from both the asymptotic and full theories for a 53
l
m diameter drop, assumed to have the density of water and a surface tension of 29 mN/m. The decay factor and frequency have been non-dimensionalised by division by the fundamental mode frequencyX2. If the differ-ence between the oscillating drop measurements and the viscosity deduced from conventional rheometry, by a factor of 3.2/4.2 = 0.70, is indeed due to elasticity, then the equivalent non-dimensionalised decay factor, assuming the computed rate atDe1= 0 inFig. 8, is 0.700.095 = 0.067.Fig. 8then implies the corresponding value ofDe1is 1.2 ± 0.6. This would correspond to a relaxation timek1of 6 ± 3l
s, which is somewhat shorter than the timescales involved in the development and deformation of the oscillating drops (e.g. about 75l
s and 33l
s for the drop inFig. 4), although viscoelastic timescales are comparable to X21, the inverse of the Lamb frequency. However, it is also possible that the difference in the viscosity values might be accounted for purely by experimental measurement errors, which can be estimated at ±20%.
The values of surface tension derived from the oscillating drop method for pure water (shown in Table 2) and for the 1.1% PEDOT:PSS solution without surfactant were, within experimental error, the same as those measured by the conventional method of bubble tensiometry. It should be noted that the accuracy of the derived value of surface tension is very sensitive to any error in the measurement of drop diameter, with a 3% error in the latter corresponding to almost 10% error in surface tension. However, very significant differences between the values of surface tension measured in the two different ways were found for the PEDOT:PSS solutions with added surfactant.
For both concentrations of PEDOT:PSS, addition of the anionic organic surfactant Dynol 607 at all the concentrations investigated led to a marked reduction in the conventionally-measured surface tension, from ca. 80 mN/m without the surfactant to ca. 30 mN/m with. Further addition of Zonyl FSO-100, a non-ionic fluorosurfac-tant, led to a further reduction to ca. 21 mN/m. However, the val-ues of surface tension derived from the oscillating drop
measurements were much higher, with mean values ranging from 66 mN for 0.06 wt% Dynol to 27 mN for 0.66 wt% Dynol, and 46 mN/m for the solutions containing 0.23 wt% Dynol and 0.27 wt% Zonyl. These values are consistent with the time-dependence of surface tension expected under the conditions of the oscillating drop experiment, in which the typical surface age of the drop was 100–300
l
s, much smaller than the diffusion time for the surfactant which can be estimated [8]to be about 4 ms. Dynamic surface tension effects are also clear in the water–iso-propanol mixture, which exhibited a surface tension of 30 mN/m in bubble tensiometry but a higher value of 46 mN/m in the oscil-lating drop experiments. The osciloscil-lating drop thus provides a sen-sitive method to probe surface tension at a timescale which is relevant to jet and drop formation in inkjet printing, which is inac-cessible to more conventional methods of measurement.6. Conclusions
The oscillating drop method provides a sensitive and accurate method for determining surface tension and viscosity of complex fluids under the conditions relevant to drop-on-demand inkjet printing. Surface tension at the surface age of the drop in flight can be derived from measurement of the drop oscillation fre-quency. For the surfactant-containing aqueous solutions investi-gated here, and also for a water–isopropanol mixture, the surface tensions were significantly higher than those measured by more conventional methods, because the surface ages of the drops were less than the surfactant migration times.
The viscosity of the fluid can be derived from measurement of the decay of the drop oscillation, and for the aqueous PEDOT:PSS investigated here marked shear-thinning was detected from the oscillating drop measurements. Shear-thinning was also observed in conventional rheometry, although the values of viscosity derived from the oscillating drop experiments were slightly lower than those deduced from high shear-rate rheometry. Viscoelastic effects are small (and quite possibly negligible) but may contribute to this difference: a relaxation time of <10
l
s was deduced, some-what shorter than the other timescales involved in (inkjet) drop production or oscillation.In drop-on-demand inkjet printing the fluid is subjected to a very high shear rate (typically 105s1) within the nozzle, which in a susceptible fluid causes shear-thinning during jetting. However, the oscillating drop is observed after drop ejection (typ-ically 300
l
s later) and this work provides strong evidence that within that timescale, for aqueous PEDOT:PSS, the viscosity recov-ers to its low-shear value. If the drop is then subjected to only slight perturbation, for example through the retraction of a very slender ligament, the viscosity remains high. In most cases, how-ever, the retraction of the ligament provides a larger stimulus which causes sufficient deformation to provide effective shear-thinning in the oscillating drop. It is evident that in mod-elling jet and drop formation for non-Newtonian fluids, an accurate constitutive equation is needed which takes account of history as well as current deformation rate.Acknowledgements
[image:8.595.47.289.546.705.2]This work was supported by EPSRC and a consortium of trial partners (EPSRC Grant no. EP/H018913/1: Innovation in indus-trial inkjet technology). The high-speed camera and high power flash lamp were provided by the EPSRC Engineering Instrument Pool and we thank Adrian Walker for his help. Additional data related to this publication is available at the Cambridge University data repository http://www.repository.cam.ac.uk/ handle/1810/248096.
Fig. 8.Values of decay factor and oscillation frequency computed from the asymptotic (dashed lines) and full (solid lines) viscoelastic theory[12]for an aqueous 1.1 wt% PEDOT:PSS drop withRe= 45 andDe2/De1= 0.36. These values have been non-dimensionalised by dividing by the fundamental mode frequency
References
[1]O.A. Basaran, H.J. Gao, P.P. Bhat, Non-standard inkjets, Ann. Rev. Fluid Mech. 45 (2013) 85–113.
[2]H. Sirringhaus, T. Kawase, R.H. Friend, T. Shimoda, M. Inbasekaran, W. Wu, E.P. Woo, High-resolution inkjet printing of all-polymer transistor circuits, Science 290 (2000) 2123–2126.
[3]S.J. Jung, A. Sou, E. Gili, H. Sirringhaus, Inkjet-printed resistors with a wide resistance range for printed read-only memory applications, Org. Electron. 14 (2013) 699–702.
[4]S.D. Hoath, S. Jung, W.K. Hsiao, I.M. Hutchings, How PEDOT:PSS solutions produce satellite-free inkjets, Org. Electron. 13 (2012) 3259–3262.
[5]S.D. Hoath, W.K. Hsiao, S. Jung, G.D. Martin, I.M. Hutchings, N.F. Morrison, O.G. Harlen, Drop speeds from drop-on-demand inkjet print-heads, J. Imag. Sci. Technol. 57 (2013) 010503.
[6]G. Brenn, S. Teichtmeister, Linear shape oscillations and polymeric timescales of viscoelastic drops, J. Fluid Mech. 733 (2013) 504–527.
[7]S.D. Hoath, S. Jung, I.M. Hutchings, Simple criterion for jet break up in drop-on-demand inkjet printing, Phys. Fluids 25 (2013) 021701.
[8]L.S. Yang, B.K. Kazmierski, S.D. Hoath, S. Jung, W.-K. Hsiao, Yiwei Wang, A. Berson, O.G. Harlen, N. Kapur, C.D. Bain, Determination of dynamic surface tension and viscosity of non-Newtonian fluids from drop oscillations, Phys. Fluids 26 (2014) 113103.
[9] T. Ishiwata, K. Sakai, Dynamic surface tension measurement with temporal resolution on microsecond scale, Appl. Phys. Exp. 7 (2014) 077301,http:// dx.doi.org/10.7567/APEX.7.077301.
[10] N. Morita, S. Hirakata, T. Hamazaki, Study on vibration behavior of jetted ink droplets and nozzle clogging, J. Imag. Soc. Jpn. 49 (2010) 14–19.http://dx.doi. org/10.11370/isj.49.14.
[11]H. Lamb, Hydrodynamics, sixth ed., Cambridge University Press, 1932. pp. 473–475.
[12]D.B. Khismatullin, A. Nadim, Shape oscillations of a viscoelastic drop, Phys. Rev. E 63 (2001) 061508.
[13]P.J. Carreau, D. Dekee, M. Daroux, An analysis of the viscous behavior of polymeric solutions, Can. J. Chem. Eng. 57 (1979) 135–140.
[14]H. Giesekus, A unified approach to a variety of constitutive models for polymer fluids based on the concept of configuration-dependent molecular mobility, Rheol. Acta 21 (1982) 366–375.
[15]H. Giesekus, Constitutive-equations for polymer fluids based on the concept of configuration-dependent molecular mobility – a generalized mean-configuration model, J. Non-Newt. Fluid Mech. 17 (1985) 349–372. [16]J.W.S. Rayleigh, Proc. Roy. Soc. 29 (1879) 71–97 (Appendix II therein). [17]A. Prosperetti, Free oscillations of drops and bubbles – the initial-value
problem, J. Fluid Mech. 100 (1980) 333–347.
[18]E. Becker, W.J. Hiller, T.A. Kowalewski, Experimental and theoretical investigation of large-amplitude oscillations of liquid droplets, J. Fluid Mech. 231 (1991) 189–210.
[19] W.R. Smith, Modulation equations for strongly nonlinear oscillations of an incompressible viscous drop, J. Fluid Mech. 654 (2010) 141–159.http://dx.doi. org/10.1017/S0022112010000480.
[20] Kaye and Laby.www.kayelaby.npl.co.uk.

![Fig. 8. Values of decay factor and oscillation frequency computed from theasymptotic (dashed lines) and full (solid lines) viscoelastic theory [12] for anaqueous 1.1 wt% PEDOT:PSS drop with Re = 45 and De2/De1 = 0.36](https://thumb-us.123doks.com/thumbv2/123dok_us/7886575.185226/8.595.47.289.546.705/values-oscillation-frequency-computed-theasymptotic-viscoelastic-anaqueous-pedot.webp)
