Original Article
The discriminatory value of cardiorespiratory interactions in
distinguishing awake from anaesthetised states: a randomised
observational study
D. A. Kenwright,
1A. Bernjak,
1T. Draegni,
2S. Dzeroski,
3M. Entwistle,
4M. Horvat,
5P. Kvandal,
6S. A. Landsverk,
6P. V. E. McClintock,
7B. Musizza,
8J. Petrov
ci
c,
9J. Raeder,
10L. W. Sheppard,
1A. F. Smith,
4T. Stankovski
1and A. Stefanovska
111 Postdoctoral Researcher, 7 Professor of Physics, 11 Professor of Biomedical Physics, Lancaster University, Lancaster, UK 2 Research Nurse, 6 Consultant Anaesthetist, 10 Professor of Anaesthesia, Oslo University Hospital, Ullevaal, Norway 3 Professor of Computer and Information Science, 8 Postdoctoral Associate, 9 Researcher, Jozef Stefan Institute, Ljubljana, Slovenia
4 Consultant Anaesthetist, Royal Lancaster Infirmary, Lancaster, UK
5 Researcher, Faculty of Mathematics and Physics, University of Ljubljana, Ljubljana, Slovenia
Summary
Depth of anaesthesia monitors usually analyse cerebral function with or without other physiological signals; non-invasive monitoring of the measured cardiorespiratory signals alone would offer a simple, practical alternative. We aimed to investigate whether such signals, analysed with novel, non-linear dynamic methods, would distinguish between the awake and anaesthetised states. We recorded ECG, respiration, skin temperature, pulse and skin conduc-tivity before and during general anaesthesia in 27 subjects in good cardiovascular health, randomly allocated to receive propofol or sevoflurane. Mean values, variability and dynamic interactions were determined. Respiratory rate (p= 0.0002), skin conductivity (p = 0.03) and skin temperature (p = 0.00006) changed with sevoflurane, and skin temperature (p = 0.0005) with propofol. Pulse transit time increased by 17% with sevoflurane (p = 0.02) and 11% with propofol (p = 0.007). Sevoflurane reduced the wavelet energy of heart (p= 0.0004) and respiratory (p = 0.02) rate variability at all frequencies, whereas propofol decreased only the heart rate variability below 0.021 Hz (p< 0.05). The phase coherence was reduced by both agents at frequencies below 0.145 Hz (p< 0.05), whereas the cardiorespiratory synchronisation time was increased (p < 0.05). A classification analysis based on an optimal set of discriminatory parameters distinguished with 95% success between the awake and anaesthetised states. We suggest that these results can contribute to the design of new monitors of anaesthetic depth based on cardiovascular signals alone.
... Correspondence to: A. F. Smith
Email: andrew.f.smith@mbht.nhs.uk Accepted: 9 July 2015
Introduction
Because general anaesthesia involves loss of conscious-ness, objective measures of depth of anaesthesia have
been focused mostly on EEG and EEG-derived mea-surements, such as the evoked potentials from sound or noxious stimuli [1–4]. Currently, there is no
tor of brain activity which meets the ideal of 100% sensitivity and specificity for the awake and anaes-thetised states. At least part of that deficiency may arise because ‘anaesthesia vs awake’ may not be a bin-ary set of conditions, and there may be neurophysio-logical states in between that are nonetheless apparently suitable for surgery [5, 6]. However, anaes-thesia is also well known to influence the cardiovascu-lar system. A multi-centre European study recently assessed a combination of EEG parameters with mea-sures of standard clinical cardiovascular parameters (heart rate, blood pressure, change of heart rate and blood pressure), for characterisation of the anaesthetic state [7]. Even with this extensive combination of mea-sures, the prediction probability of 88% for correctly identifying the awake-to-anaesthetised transition still fell far below the 100% ideal.
In standard clinical settings, like the above study, most cardiovascular data are processed on a beat-by-beat basis. But, if measured with a higher sampling frequency (i.e. several samples per beat), the resultant signals can provide more information relating to how the system is changing (its dynamic properties such as contributing oscillations and their coherence). In turn, how these change with anaesthesia can be assessed. There is also the possibility of including additional non-invasive sensors, such as respiratory effort, skin conductivity and skin temperature, all operated at a high sampling frequency. We therefore propose that simultaneous measurements of cardiovascular signals in combination with dynamic analysis could have potential clinical applications by providing the basis for future depth of anaesthesia monitors.
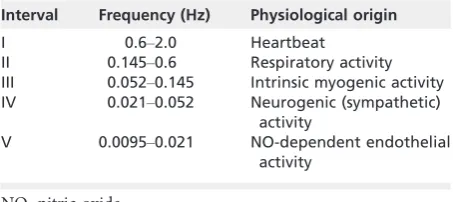
As all cardiovascular variables vary with time, and do so in a non-linear way, analyses that reflect this non-linearity provide closer approximations to reality [8, 9]. Dynamic analysis of blood flow measurements suggests that there are at least five characteristic oscil-latory frequencies in the cardiovascular system, each attributable to a particular physiological process, including cardiac, respiratory, myogenic, sympathetic and endothelial activities (Table 1). Complex oscilla-tions can often be decomposed into their individual oscillatory components using the Fourier transform. Formally, however, this can be done only when the signals are periodic, which implies that, for example,
mean heart rate is constant over time. In reality, this is not the case. Therefore, we need methods that reveal the time-variability of the constituent oscillations. A method known as ‘wavelet analysis’ can decompose oscillatory components locally in time to yield an opti-mal time-frequency resolution [8, 10]. Furthermore, techniques such as ‘wavelet phase coherence’ and ‘ syn-chronisation analysis’ can extract information about the interactions between the underlying oscillatory processes [9, 11].
We expected that anaesthesia would result in mul-tiple changes in cardiovascular regulation that could be revealed by applying novel non-linear dynamics meth-ods to relevant signals. In addition, we proposed that, when a large range of cardiovascular and autonomic parameters are analysed, it would be possible to reli-ably establish whether a patient was awake or anaes-thetised. Thus, we tested two hypotheses: first, that there is a clear difference between the awake and anaesthetised states; and second, that anaesthesia using propofol would be demonstrably different (as assessed by our methods) from anaesthesia using sevoflurane.
The choices of signals to be recorded, and the best ways of creating the parameters for their interaction, were guided by the results of earlier work on cardio-vascular dynamics during anaesthesia in both rats [12, 13] and humans [14]. Core temperature [15] and skin conductance [16] were added to the signals to be recorded because these quantities are known to undergo changes during anaesthesia.
Methods
ineligible if they had consumed caffeine-containing drinks after 20:00 the previous day, or had taken a sleeping pill the night before surgery.
A randomisation envelope was opened by study personnel and the specified anaesthetic drug was pre-pared, checked and labelled. No premedication was given. Standard clinical anaesthetic monitoring was attached (pulse oximetry, 3-lead electrocardiogram and non-invasive arterial blood pressure). The sensors for data recording were then applied as described below. Intravenous access was obtained. After application and calibration of the sensors, a stabilisation period was allowed.
Once subjects confirmed that they were comfort-able, they were asked to relax, lie still, stay awake, and not speak unless necessary for the duration of the recordings. The first set of recordings was then made for approximately 30 minutes before anaesthesia. After this, anaesthesia was induced with the drug dictated by the randomisation procedure. In addition, a commer-cial gas analyser displaying respired gas oxygen, carbon dioxide and volatile anaesthetic agent concentrations was used. For the propofol group, anaesthesia was induced by infusing propofol until a simulated plasma target concentration of 6.0 lg.ml 1 was reached (DiprifusorTM
, target control system (TCI) Astra-Zeneca, London, UK). A laryngeal mask airway was inserted 2 min after the start of the infusion. After insertion, the target concentration was reduced to 3.0lg.ml 1 and the infusion was maintained at this rate throughout the measurement period [17, 18]. For the sevoflurane group, subjects were asked to breathe sevoflurane through a close-fitting facemask until an end-tidal concentration of 5% was reached. A laryngeal mask airway was inserted, and then the sevoflurane turned off until the end-tidal concentration fell to 2%. The sevoflurane was then re-instituted to maintain the end-tidal concentration at 2% throughout the measure-ment period [19]. After a further stabilisation period of 5–10 min, the second set of signal recordings took place. Subjects breathed spontaneously during both sets of recordings.
The signals were recorded using a system (Car-dio&Brain Signals; Jozef Stefan Institute, Ljubljana, Slovenia) specially designed for this study. The signals were fed, via 24-bit A/D conversion at 1200 Hz, into a
purpose-built signal-conditioning unit and then stored on a laptop computer.
The electrical activity of the heart was measured with a 3-lead ECG system. To obtain well-defined ECG R-peaks, used to calculate heartbeat timing, the standard electrodes were attached to the subject’s left shoulder, right shoulder and lowest rib on the left side of the body. The connecting cable was a M1735A 3-lead ECG shielded cable (Philips Medizin Systeme B€oblingen GmbH, Boeblingen, Germany) and adapted to the Cardio&Brain Signals ECG input con-nector.
Respiratory effort was recorded using a belt encir-cling the subject’s chest, fitted with a Biopac TSD201 Respiratory Effort Transducer (Biopac Systems Inc., Goleta, CA, USA).
Skin temperature was measured with two 8.5-mm diameter, high-sensitivity, low heat capacity thermistors taped to the skin: YSI 709B Thermilinearâsensors (YSI Inc., Yellow Springs, OH, USA). The first (T1) was positioned on the inside right ankle, over the medial malleolus; and the second (T2) on the inside of the right wrist, over the radial styloid process. Care was taken to ensure good thermal contact between the sen-sor and the skin.
Skin conductivity was measured using a pair of sil-ver-plated electrodes taped to the ball and between the distal and proximal joints of the right thumb. The electrodes were adapted from the M1931A Reusable EEG Adult Cup Electrode set of the Ag/AgCl electrode system (Philips Medizin Systeme B€oblingen GmbH). Electrical contact was facilitated by use of a standard conductivity gel, e.g. Electro-Gelâ from Electro-Cap International, Inc., Eaton, OH, USA. Conductivity was determined from the DC current when 0.5 V was applied between the electrodes. The maximum current was limited to 125lA.
The pulse generated by changes in arterial blood pressure was measured on the subject’s right index
finger with a piezoelectric pressure transducer, the MLT1010 Pulse Transducer (AD Instruments Pty Ltd, Bella Vista, NSW, Australia). The volume of blood
The R-peaks of the ECG signal, and the maxima of the respiration signal, were used as markers for car-diac and respiratory oscillations, respectively. In this way, the heart rate variability and respiratory fre-quency variability signals were obtained (Appendix S1). The maxima and minima of the integrated pulse signal represent the systolic and diastolic pressures, respectively. We defined the arrival times of the pulse signal to the finger as the minima in the pressure; this is not only the easiest part of the signal to recognise and locate but is also the least distorted part of the propagated wave [20]. The time delay between the arrival time of the pressure pulse wave and its corre-sponding R-peak was defined as the pulse transit time.
To discern the frequency content of the cardiovas-cular oscillations, we performed wavelet analysis on the recorded signals. The Morlet mother wavelet [21] was used to calculate the continuous wavelet trans-form. The spectral range was then divided into thefive physiologically relevant frequency intervals [8, 22] between 0.0095 and 2 Hz shown in Table 1. The energy of each of the signals, including the variability of the heart and respiration rates, was calculated (Appendix S2) within these intervals.
Wavelet phase coherence was used for exploration of the phase relationships at particular frequencies between oscillations from pairs of separate signals [23, 24]. Generally, phase coherence was considered to exist if the phase difference between two oscillations remained constant throughout the whole time of obser-vation; this suggested that the signals are regulated from a common source, or that they are mutually synchro-nised [25] (see Appendix S2 for details of how the synchronisation and wavelet phase coherence were
calculated; the method of surrogates [26] was used to test for significance). Co-ordination between the heart and respiration is known to exist at rest and during anaesthesia [9, 11, 12, 27–31]. Specifically, we studied the phase synchronisation between respiration and heartbeat as analysed by the synchronisation index [8]. The synchronisation time for each subject was defined as the sum of the intervals during which the indices are 95% or above of perfect synchronisation for window lengths of 6T for 1:n synchronisation and 8T for 2:n synchronisation, where T is the average respiratory per-iod. This choice of window length and the use of phase gives the same relative period for all subjects, as opposed to methods which are based on absolute time [30, 31]. We then calculated the change in synchronisation time between the awake state and during anaesthesia.
The analyses were made in MATLAB (Math-Works, Natick, MA, USA) and two types of comparison were carried out. First, using a paired, non-parametric (Wilcoxon signed-rank) test, we inves-tigated the statistical differences between the extracted parameters related to the awake and anaesthetised states. Secondly, we tested statistical differences between the extracted parameters relevant for the anaesthetised state with each of the two agents, using an unpaired Wilcoxon rank sum test. The significance level was set at p= 0.05. Wherever appropriate, the significance of dynamic parameters, like phase coher-ence, was tested against properties extracted from sur-rogate signals which were generated by randomising the correlations between the two signals, thus making them independent and phase incoherent, but preserv-ing the statistical properties of each signal [26].
On the basis of parameters derived from the recorded signals, and by applying automatic classifi ca-tion method, we classified subjects intogroupsorclasses
[image:4.595.59.286.606.707.2]associated with three distinct states: awake, anaes-thetised with sevoflurane, and anaesthetised with propo-fol. The classification is a machine-learning process which is refined until it performs optimally. There are many possible classification schemata and training methods [32–35]. We applied two different approaches. First, we applied a method specially developed for this study. It is a variant of distance-based classification (see below) that arose naturally in the present context. It takes direct account of the physiological nature of the
Table 1 Frequency intervals and their associated
physiological activity.
Interval Frequency (Hz) Physiological origin
I 0.6–2.0 Heartbeat
II 0.145–0.6 Respiratory activity
III 0.052–0.145 Intrinsic myogenic activity
IV 0.021–0.052 Neurogenic (sympathetic)
activity
V 0.0095–0.021 NO-dependent endothelial
activity
extracted parameters and during classification simulta-neously optimises the distance measure. Secondly, to test the strength of our new classification method, we applied standard classification techniques and corre-sponding methodology from the freely available open-source software package WEKA [36].
We used an unpaired test (Kolmogorov–Smirnov [37]) to determine whether there were significant dif-ferences between the classified groups. If the difference for a pair of physiological variables was found to be significant (p < 0.05) these were considered as attri-butes and were included in the discriminatory analysis.
The attributes, summarised in Table 2, were grouped into mean values, wavelet powers and interactions; we then went through a controlled cascade of reductions and mergers of attribute sets to find the most predic-tive attributes (see online Appendix S3 for details on ranking attributes).
We used a distance-based classification technique, called the nearest neighbour classifier [31], where each subject is assigned a vector x based on their measured signals and derived values. The (squared) distance between two subjects x1 and x2 is calculated as
D(x1,x2)2 = (x1 x2)T A (x1 x2), where T indicates
the transpose of the original matrix. The distance mea-sure (i.e. the entries in the positive symmetric matrix A) is determined through a procedure described in online Appendix S3, where further details are given [38].
The results of a classifier are assessed by inspecting the‘confusion matrix’[38] (see Table A2 of the online supplementary information). In brief, the confusion matrix contrasts actual states/classifications (rows) with classifications/states (columns) predicted by the
classi-fier. The diagonal entries correspond to the number (likelihood) of correct classifications and off-diagonal entries to the number (likelihood) of misclassifications: the likelihood entries in one row sum up to 100%. Further details can be found in Appendix S3.
Results
[image:5.595.56.285.144.410.2]We recruited 27 patients from two centres, Oslo (n= 13) and Lancaster (n= 14). Of these, 12 were anaesthetised with propofol and 15 with sevoflurane; six patients received propofol in each of the two cen-tres; eight received sevoflurane in Lancaster and seven in Oslo. The subject characteristics are given in Table 3.
An example of a set of recorded signals is given in Fig. 1. Wefirst calculated their mean values across the whole recording, as shown in Table 4. Each subject
Table 2 The attributes used in the vector-based dis-criminatory analysis for the different subsets of data. Roman numerals indicate frequency intervals (see Table 1). The 12 most relevant attributes, used in the optimised classification calculation, appear shaded.
Mean values subset
Wavelet powers
subset Interactions subset
Heart rate HRV energy II HRV-conductivity II
Respiratory rate HRV energy III HRV-conductivity III
Skin temperature HRV energy IV HRV-conductivity IV
Skin conductivity HRV energy V Conductivity-pulse I
Pulse transit time RFV energy III Conductivity-pulse III
Total HRV energy RFV energy IV Conductivity-pulse IV
Total RFV energy RFV energy V
Conductivity-temperature I Total conductivity
energy
Conductivity energy III
Conductivity-temperature II Total temperature
energy
Conductivity energy IV
Pulse-temperature I
Conductivity energy V
C-R synchronisation time
Conductivity energy VI
1:n synchronisation window length Temperature
energy III
2:n synchronisation window length Temperature
energy IV Temperature
energy V Temperature
energy VI
[image:5.595.59.540.657.710.2]RFV, respiratory frequency variability; HFV, heart rate vari-ability.
Table 3 Characteristics of the two groups. Values are number or mean (SD).
Group
Number of
subjects (M:F) Age; years Height; cm Weight; kg
Body mass index; kg.m 2
Sevoflurane 15 (8:7) 31.9 (9.4) 176.0 (11.5) 77.8 (12.3) 25.7 (5.0)
acted as his/her own control in terms of awake versus anaesthetised. There was no statistically significant dif-ference between the awake measurements of the two study groups, propofol and sevoflurane.
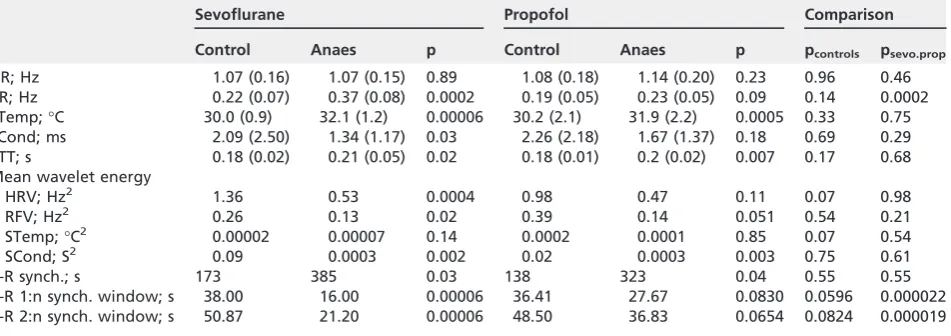
[image:6.595.65.541.119.287.2]Neither anaesthetic agent caused a statistically sig-nificant change in the mean heart rate and there was no significant difference between the anaesthesia groups; p values for all comparisons are shown in Table 4. In contrast, sevoflurane caused a significant increase in respiratory rate compared both with base-line and with propofol.
A significant increase in skin temperature was observed on both sites with both anaesthetic agents. The mean values shown in Table 4 represent the mean
between the two measurement sites, on wrist and ankle. There was no significant difference between the propofol and sevoflurane groups.
There was wide between-subject variation in recorded skin conductivity, amounting to several orders of magnitude. However, for all subjects, skin conductivity was typically highest when the sensor was
first attached, then fell during the period of awake measurement, with rapid increases when the subject was subjected to a stimulus such as noise, end of the measurement, or the onset of the anaesthesia proce-dure. Mean skin conductivity decreased during anaes-thesia with both agents, though this was significant only for sevoflurane. There was no significant
Table 6 Confusion matrix, giving the likelihoods of correct and incorrect classification into two states, for the distance-based classification as in Table 3, using an optimal distance on 12 attributes.
Classified state
Awake Anaesthetised
Actual state
Awake 98% 2%
[image:6.595.312.540.637.708.2]Anaesthetised 8% 92%
Table 4 Heart rate, respiratory rate, skin temperature, skin conductivity, pulse transit time, the mean wavelet energy of the signals, the duration of cardiorespiratory synchronisation and the duration of the windows for 1:n and 2:n cardiorespiratory synchronisation. Values are mean (SD).
Sevoflurane Propofol Comparison
Control Anaes p Control Anaes p pcontrols psevo.prop
HR; Hz 1.07 (0.16) 1.07 (0.15) 0.89 1.08 (0.18) 1.14 (0.20) 0.23 0.96 0.46
RR; Hz 0.22 (0.07) 0.37 (0.08) 0.0002 0.19 (0.05) 0.23 (0.05) 0.09 0.14 0.0002
STemp;°C 30.0 (0.9) 32.1 (1.2) 0.00006 30.2 (2.1) 31.9 (2.2) 0.0005 0.33 0.75
SCond; ms 2.09 (2.50) 1.34 (1.17) 0.03 2.26 (2.18) 1.67 (1.37) 0.18 0.69 0.29
PTT; s 0.18 (0.02) 0.21 (0.05) 0.02 0.18 (0.01) 0.2 (0.02) 0.007 0.17 0.68
Mean wavelet energy
HRV; Hz2 1.36 0.53 0.0004 0.98 0.47 0.11 0.07 0.98
RFV; Hz2 0.26 0.13 0.02 0.39 0.14 0.051 0.54 0.21
STemp;°C2 0.00002 0.00007 0.14 0.0002 0.0001 0.85 0.07 0.54
SCond; S2 0.09 0.0003 0.002 0.02 0.0003 0.003 0.75 0.61
C-R synch.; s 173 385 0.03 138 323 0.04 0.55 0.55
C-R 1:n synch. window; s 38.00 16.00 0.00006 36.41 27.67 0.0830 0.0596 0.000022
C-R 2:n synch. window; s 50.87 21.20 0.00006 48.50 36.83 0.0654 0.0824 0.000019
p values are provided for the comparisons between control and anaesthetised groups with each of the two anaesthetics, and in the
final columns between the awake measurements for the two groups (pcontrols) and for the two anaesthetic agents (psevo.prop).
HR, heart rate; RR, respiratory rate; STemp, skin temperature; SCond, skin conductivity; PTT, pulse transit time; C-R synch, duration of cardiorespiratory synchronisation.
Table 5 Confusion matrix, giving the likelihoods of correct and incorrect classification into three states for distance-based classification using an optimal distance on 12 attributes.
Classified state
Awake
Anaes-Sevoflurane
Anaes-Propofol
Actual state
Awake 98% 0 2%
Anaes-Sevoflurane 8% 84% 8%
difference between the two agents with respect to this decrease.
Anaesthesia caused a significant increase in pulse transit time (Table 4): 17% with sevoflurane and 11% with propofol.
Wavelet analysis of oscillations in measured and derived signals revealed the following results. Both anaesthetic agents were associated with a decrease in heart rate variability (Fig. 2); this was significant across all frequencies for sevoflurane, but only in frequency
interval V (0.0095–0.021 Hz) for propofol. Both agents were associated with a decrease in respiratory fre-quency variability, significantly for sevoflurane and close to significance for propofol. There was no signifi -cant change in temperature variability for either agent. However, median skin conductivity variability decreased considerably for both agents, though this fall was small in comparison with the between-subject variation in mean values at baseline.
Furthermore, we observed that the heartbeat and breathing entered periods of synchronisation, whereby a fixed number of beats occurred for each breathing cycle, as had been demonstrated previously [27–31]. The total synchronisation time was found to increase with both anaesthetics, whereas the 1:n and 2:n syn-chronisation windows decreased significantly only with sevoflurane, thus showing significant difference in the effects of the two anaesthetics. In contrast, the differ-ence in the synchronisation time between the two anaesthetics was not significant (Table 4).
Figure 3 shows the phase coherence between pairs of the cardiovascular and respiratory signals in the awake and anaesthetised states. Frequencies where the change is significant are shaded; for example, section
Table 7 Confusion matrix giving both the numbers
and likelihoods of correct and incorrect classifications into three states, for the distance-based classification as in Table 3, using an optimal distance on 12 attributes. The numbers have been obtained using leave-one-out cross-validation (as opposed to repeated 50% hold-out for Tables 3 and 4).
Classified state
Awake
Anaes-Sevoflurane
Anaes-Propofol
Actual state
Awake 100% 0 0
Anaes-Sevoflurane 7% 93% 0
Anaes-Propofol 0 0 100%
0 1 2
ECG (V)
20 40 60 80
Resp (range %)
0.51 0.52
Cond (mS)
30 35
Temp1+2
(
o C)
1500 1505 1510 1515 1520 1525
–0.10 0.1 0.2
Time (s)
[image:7.595.144.449.76.308.2]Pulse (V)
(d) of Fig. 3 shows the phase coherence between skin conductivity and the pulse pressure signal. Both sevoflurane and propofol caused a significant reduction in phase coherence below 0.145 Hz. In effect, the coherence between these two signals when awake was lost during anaesthesia.
The attributes used in the classification analysis to distinguish the awake from the anaesthetised state appear in Table 2. The controlled cascade of reduc-tions and mergers of attribute sets revealed a very effi -cient set of 12 attributes, which appear shaded in Table 2 (see Appendix S3 online for details on ranking attributes). By using the obtained optimal distance in classification with repeated hold-out validation, we obtained a classification accuracy of A3 = 90% with
the corresponding confusion matrix expressed in per-centages in Table 5. In this table, the sum in a hori-zontal row is 100% and the values on the diagonal present correct classifications. Thus, 98% of awake subjects were classified as awake and 2% as anaesthe-tised with propofol. The classification resulted in recognising 84% of subjects anaesthetised with
sevo-flurane correctly, whereas 8% were wrongly classified as awake and another 8% as anaesthetised with propo-fol. Lastly, of all subjects anaesthetised with propofol, 80% were classified correctly, 9% were classified as awake and 11% as anaesthetised with sevoflurane. Further description of the confusion matrix is given in Appendix S3.
Merging the two anaesthetised states into one state, yielded a classification accuracy of A2 = 95%, as
summarised in the confusion matrix given in Table 6. The classification with the optimal distance and simple leave-one-out cross-validation gives an accuracy A3 = 98%, as summarised in the confusion matrix in
Table 7.
Details of the classification analysis and results are summarised in Appendix 3.
Discussion
The use of cardiovascular and autonomic signs to assess depth of anaesthesia is not new; scores based on such signs have been used in the research context since the 1980s [39–43], and the signs are still in clinical use [15]. In particular, heart rate variability, analysed either via its frequency content [39] or various entropy measures [44], in combination with blood pressure or cardiores-piratory co-ordination [30, 31], have been used to assess the activity of the autonomic nervous system as an indi-cator of the state of anaesthesia. However, our results yield insights into the changes in cardiovascular interac-tions revealed by the application of recently-introduced non-linear dynamic of analytical methods [9]. They were applied, not just to one or two signals, but to sev-eral simultaneously measured signals, and a classifi ca-tion method was used for optimal combinaca-tion of all the inferred parameters. A number of distinct changes between the awake and anaesthetised states, and 0
5
Energy (mHz
2 )
0 5
HRV V IV III II 0
5
0 5 10
Energy (mHz
2 )
0 5 10
RFV V IV III II 0
5
10 Energy (mC
2 )
0 0.5
0 5 10 15
Energy (mS
2 )
0 5 10 15
Conductivity V IV III II I 0
5 10 15 0
0.5
Temperature V IV III II I 0
0.5
Ctrl
Sevo
Prop
Frequency interval
[image:8.595.73.521.74.216.2](a) (b) (c) (d)
between the effects of the two anaesthetics, are thus demonstrated. The study can draw two types of conclusion: (a) on which physiological parameters change significantly during anaesthesia with either propofol or sevoflurane; and (b) on which of the extracted parameters can be used to discriminate the data optimally to classify each of the subject’s measured states.
Respiratory rate, skin temperature and pulse tran-sit time increased during anaesthesia, whereas skin conductivity and the derived quantities of heart rate and respiratory rate variability both decreased. We have shown that anaesthesia is associated with a conse-quent reduction in the phase coherence, whereas car-diorespiratory phase synchronisation increases; the tendency for heart rate and respiratory rate to syn-chronise under anaesthesia is previously unreported for sevoflurane in humans. Furthermore, there was a general reduction in phase coherence between the
various signals under anaesthesia and a clear difference between the effects of the two anaesthetics.
In earlier studies, heart rate variability has mostly been assessed using Fourier-based methods of spectral analysis, which typically deal with high-frequency (approx. 0.02–0.15 Hz) and low-frequency (approx. 0.15–0.4 Hz) bands. While there are a number of theories for the physiological basis of the activities at different frequencies, the move from what might be termed a ‘cardiocentric’ view of the circulation to one which encompasses the role of vascular regulation is well supported by our previous work [8, 22]. Decreases have been reported in these bands [44], which are approximately equivalent to bands III and IV in our study (Table 1).
Other new findings in this study arise from the use of wavelet analysis to further refine the results of a number of physiological responses to anaesthesia. Wavelet analyses enabled us to choose window sizes
Ctrl Sevo
0 0.2 0.4
Wavelet phase coherence
Ctrl Prop
0 0.2 0.4
Sevo Prop
HRV/Cond V IV III II I 0
0.2 0.4 0.6
HRV/Pulse V IV III II I
HRV/Temp V IV III II I
Cond/Pulse V IV III II I
Cond/Temp V IV III II I
Pulse/Temp V IV III II I
Frequency interval
[image:9.595.68.525.76.328.2](a) (b) (c) (d) (e) (f)
according to the time scales of interest and to identify the physiological processes associated with particular frequency bands (see Table 1). We have observed for thefirst time a statistically significant decrease in heart rate variability wavelet energy in the lower frequency band V (0.0095–0.021 Hz) between the awake and anaesthetised states with both anaesthetic agents (Fig. 2a). In microvascular studies, activity in these bands has been shown to be associated with nitric oxide-related endothelial activity [45, 46].
There was a significant increase in the mean respi-ratory rate with sevoflurane. Propofol resulted only in a slight increase in respiratory frequency, which was significantly lower than the average respiratory fre-quency during sevoflurane anaesthesia. Furthermore, the total energy of respiratory frequency variability decreased with anaesthesia, significantly with sevofl u-rane (p= 0.02) and borderline significantly with propofol, (p = 0.051). The wavelet energy of respira-tory frequency variability has not previously been stud-ied during anaesthesia.
In relation to interactions, we observed an increased tendency for the heart and respiration to synchronise during anaesthesia with both sevoflurane and propofol. This was reported in an earlier study of cardiorespiratory interactions using propofol in humans [14], and has been observed in rats [12] anaesthetised with ketamine, but has not previously been reported for sevoflurane in humans. Further, when wavelet phase coherence was used to check for significant phase relationships between the oscillations in the various signals, we observed that this relation-ship changed when a person is anaesthetised. For instance, between the conductivity and pulse signals, there is a reduction in the phase coherence at frequen-cies below 0.145 Hz for both anaesthetic agents. The observed reduction agrees with the general picture that interactions within the cardiovascular system are reduced by anaesthesia because communication through the neuronal network is restricted.
In the discriminatory classification, we studied separately the classifications based on the following parameters obtained from analysis: (a) the mean values and total wavelet energies; (b) the wavelet energy spec-tra for individual frequency bands; and (c) the wavelet phase coherence and synchronisation values. In each
of the three categories, an optimal set was selected and the classification success rate was evaluated. Using the mean data alone, we were able to categorise subjects into three groups (awake, anaesthetised with sevofl u-rane, anaesthetised with propofol) with a 86% success rate, and into two groups (awake or anaesthetised) with a 90% success rate. The changes in the oscilla-tions and their interacoscilla-tions induced by the anaesthetics are evidently not robust enough to provide measures of state by themselves. However, a combination of the mean values, oscillations and interaction data improved the success rate of categorising into three groups (awake, anaesthetised with sevoflurane, anaes-thetised with propofol) to 90%, whereas for classifying into two groups (awake, anaesthetised) the optimisa-tion of classification improved to 95%.
The main aims of the study were to understand the effects of the two anaesthetics and, in particular, to establish which physiological parameters change most significantly on entering anaesthesia. Thus, we hoped to identify which parameters are potentially the most useful in discriminating between the awake and anaes-thetised states. These were found to be: the mean res-piratory rate; the total wavelet energy of the heart rate variability; the total wavelet energy of the respiratory frequency variability signal; the mean temperature; the mean synchronisation time; the window lengths for 1: n and 2:n synchronisation; the phase coherence between pulse and temperature in frequency interval I; the wavelet energy in frequency intervals III and IV of heart rate variability; the wavelet energy in frequency interval V of the respiratory frequency variability; and the wavelet energy of frequency interval VI of the con-ductivity signal. Coherence and synchronisation analy-ses remain candidates for inclusion within a future novel method of anaesthesia monitoring, but do not provide robust enough measures for use by themselves. Our result of 95% prediction of the awake-to-anaesthetised transition compares favourably with the 88% prediction based on a combination of EEG and static physiological variables [7]. Once the number of data sets for classification is larger (several hundreds), one could expect prediction approaching 100%.
practical applicability of the presented results, a study with more realistic conditions need to be performed. This should include: subjects with varying drug concen-trations during anaesthesia, or different combination of anaesthetics; subjects who are receiving neuromuscular blocking drugs in addition to general anaesthetics; and subjects whose lungs are being mechanically ventilated, all preferably with continuous recordings during surgery and emergence from anaesthesia.
In summary, we have presented thorough investiga-tions of the effects of sevoflorane and propofol on car-diovascular regulation. Subtle differences in the effects of these two drugs, which are known to operate via dif-ferent cellular mechanisms, were identified for car-diorespiratory interactions. Furthermore, a number of relevant parameters were extracted and those that con-tributed to higher classification rates, in either two groups (control and anaesthetised) or three groups (control, sevoflurane and propofol) were discussed. Although we did not use measures of depth of anaesthe-sia other than end-tidal sevoflurane and target propofol concentrations, we believe that our study paves the way to a modern depth of anaesthesia monitor utilising simultaneous recordings of cardiovascular signals, with on-line non-linear analysis and classification, able to monitor robustly the state and depth of anaesthesia. Future work could usefully validate the novel algorithm on data from a new, larger group of patients and incor-porate an additional measure of depth of anaesthesia such as the use of the isolated forearm technique. We would also advocate further studies to improve the sen-sitivity and specificity of each of our components for the composite analyses. It has, for instance, been shown that refinement of the raw skin conductivity values into anal-yses of frequency of minor sweat bursts increases the precision of the skin conductivity tool [47].
Acknowledgements
We thank the entire BRACCIA team for excellent col-laboration and in particular to Milan Palus and Martin Vejmelka (Institute of Computer Science, Academy of Sciences of the Czech Republic, Prague, Czech Repub-lic) and Niels Wessel and Maik Riedel (Humboldt-Universit€at zu Berlin, Berlin, Germany) for their con-tributions to the analysis of the data collected within the FP6 project BRACCIA, not presented here. An
example dataset and instructions on how to obtain all datasets used in the study are available at http:// py-biomedical.lancaster.ac.uk/.
Competing interests
This work was supported by the European Union as a NEST (New and Emerging Science and Technology) Project, No. 517133, ‘Brain, Respiratory and Cardiac Causalities in Anaesthesia’ (BRACCIA http://www. physics.lancs.ac.uk/braccia), and in part by the by the Engineering and Physical Sciences Research Council (UK) (Grant No. EP/1009999/1) and by the Slovenian Research Agency (Grant No. P2-0232). LWS was partially supported by NERC grant NE/I011889/1. There are no competing interests to declare.
References
1. Mashour GA. Neurophysiology and intraoperative nociception: new potentials?Anesthesiology2013;118: 239–40.
2. Myles PS, Leslie K, McNeil J, Forbes A, Chan MTV, for the B-Aware Trial Group. Bispectral index monitoring to prevent awareness during anaesthesia: the B-Aware randomised con-trolled trial.Lancet2004;363: 1757–63.
3. Vereecke HE, Vasquez PM, Jensen EW, et al. New composite index based on midlatency auditory evoked potential and electroencephalographic parameters to optimize correlation with propofol effect site concentration: comparison with bis-pectral index and solitary used fast extracting auditory evoked potential index.Anesthesiology2005;103: 500–7.
4. Gruenewald M, Ilies C. Monitoring the nociception-anti-noci-ception balance.Best Practice & Research Clinical Anaesthesi-ology2013;27: 235–47.
5. Pandit JJ. Isolated forearm - or isolated brain? Interpreting responses during anaesthesia - or ‘dysanaesthesia’. Anaesthe-sia2013;68: 995–1000.
6. Pandit JJ. Monitoring (un)consciousness: the implications of a new definition of ‘anaesthesia’.Anaesthesia2014;69: 801–7. 7. Schneider G, Jordan D, Schwarz G, et al. Monitoring depth of anesthesia utilizing a combination of electroencephalographic and standard measures.Anesthesiology2014;120: 819–28. 8. Shiogai Y, Stefanovska A, McClintock PVE. Nonlinear dynamics
of cardiovascular ageing.Physics Reports2010;488: 51–110. 9. Clemson PT, Stefanovska A. Discerning non-autonomous
dynamics.Physics Reports2014;542: 297–368.
10. Bernjak A, Cui J, Iwase S, Mano T, Stefanovska A, Eckberg DL. Human sympathetic outflows to skin and muscle target organs fluctuate concordantly over a wide range of time-vary-ing frequencies.The Journal of Physiology 2012;590: 363–
75.
11. Iatsenko D, Bernjak A, Stankovski T, et al. Evolution of car-diorespiratory interactions with age. Philosophical Transac-tions of the Royal Society A2013;371: 20110622.
13. Musizza B, Stefanovska A, McClintock PVE, et al. Interactions between cardiac, respiratory, and EEG-d oscillations in rats during anæsthesia. The Journal of Physiology 2007; 580: 315–26.
14. Entwistle M, Bandrivskyy A, Musizza B, Stefanovska A, McClin-tock PVE, Smith A. Synchronization and directionality in cardio-respiratory oscillations in anaesthesia: a preliminary observational study in human males.British Journal of Anaes-thesia2004;93: 608–9.
15. Imrie MM, Hall GM. Body temperature and anaesthesia. Bri-tish Journal of Anaesthesia1990;64: 346–54.
16. Storm H, Shafiei M, Myre K, Raeder J. Palmar skin conduc-tance compared to a developed stress score and to noxious and awakening stimuli on patients in anaesthesia. Acta Anaesthesiologica Scandinavica2005;49: 798–803.
17. Hoymork SC, Raeder J, Grimsmo B, Steen PA. Bispectral index, serum drug concentrations and emergence associated with individually adjusted target-controlled infusions of remifen-tanil and propofol for laparoscopic surgery. British Journal of Anaesthesia2003;91: 773–80.
18. Marsh B, White M, Morton N, Kenny GNC. Pharmacokinetic model driven Infusion of propofol in children. British Journal of Anaesthesia1991;67: 41–8.
19. Alpiger S, Helbo-Hansen HS, Vach W, Ording H. Efficacy of the A-line (TM) AEP monitor as a tool for predicting suc-cessful insertion of a laryngeal mask during sevoflurane anesthesia. Acta Anaesthesiologica Scandinavica 2004; 48: 888–93.
20. Nichols WW, O’Rourke M, Vlachopoulos C. McDonald’s Blood Flow in Arteries: Theoretical, Experimental and Clinical Princi-ples, 6th edn. London: Hodder Arnold, 2011.
21. Grossmann A, Morlet J. Decomposition of Hardy functions into square integrable wavelets of constant shape. SIAM Journal on Mathematical Analysis1984;15: 723–36.
22. Lotric MB, Stefanovska A,Stajer D, Urbancic-Rovan V. Spectral components of heart rate variability determined by wavelet analysis.Physiological Measurement2000;21: 441–57. 23. Bandrivskyy A, Bernjak A, McClintock PVE, Stefanovska A.
Wavelet phase coherence analysis:application to skin temper-ature and blood flow. Cardiovascular Engineering 2004; 4: 89–93.
24. Sheppard LW, Stefanovska A, McClintock PVE. Testing for time-localized coherence in bivariate data. Physical Review E.
2012;85: 046205.
25. Pikovsky A, Rosenblum M, Kurths J.Synchronization: A Univer-sal Concept in Nonlinear Sciences. Cambridge: Cambridge University Press, 2001.
26. Schreiber T, Schmitz A. Surrogate time series.Physica D: Non-linear Phenomena2000;142: 346–82.
27. Kenwright DA, Bahraminasab A, Stefanovska A, McClintock PVE. The effect of low-frequency oscillations on cardio-respira-tory synchronization: Observations during rest and exercise.
The European Physical Journal B2008;65: 425–33.
28. Lotric MB, Stefanovska A. Synchronization and modulation in the human cardiorespiratory system. Physica A 2000; 283: 451–61.
29. Sch€afer C, Rosenblum MG, Kurths J, Abel HH. Heartbeat syn-chronized with ventilation.Nature1998;392: 239–40. 30. Larsen PD, Tzeng YC, Galletly DC. Quantal ventilatory
variabil-ity during spontaneous breathing anaesthesia. British Journal of Anaesthesia2003;91: 184–9.
31. Tzeng YC, Larsen PD, Galletly DC. Cardioventilatory coupling in resting human subjects. Experimental Physiology 2003; 88: 775–82.
32. Flach P.Machine Learning: The Art and Science of Algorithms that Make Sense of Data. Cambridge: Cambridge University Press, 2012.
33. Witten IH, Frank E, Hall MA.Data Mining: Practical Machine Learning Tools and Techniques: Practical Machine Learning Tools and Techniques. Burlington: Morgan Kaufmann Publish-ers Inc., 2011.
34. Maimon O, Rokach L.Data Mining and Knowledge Discovery Handbook. New York: Springer Science & Business Media, 2010.
35. Hastie T, Tibshirani R, Friedman J.The Elements of Statistical Learning: Data Mining, Inference, and Prediction, 2nd edn. New York: Springer Science & Business Media, 2009. 36. Hall M, Frank E, Holmes G, Pfahringer B, Reutemann P, Witten
I. The WEKA data mining software: an update.SIGKDD Explo-rations2009;11: 10–18.
37. Massey FJ Jr. The Kolmogorov-Smirnov test for goodness of fit.
Journal of the American Statistical Association1951;46: 68–78. 38. Jain AK, Murty MN, Flynn PJ. Data clustering: a review.ACM
Computing Surveys1999;31: 264–323.
39. Evans JM, Davies WL, Wise CC. Lower oesophageal contracility: a new monitor of anaesthesia.Lancet1984;1(8387): 1151–4. 40. Pomfrett CJD, Barrie JR, Healy TEJ. Respiratory sinus arrythmia:
and index of light anaesthesia.British Journal of Anaesthesia
1993;71: 212–7.
41. Kanaya N, Hirata N, Kurosawa S, Nakayama M, Namiki A. Dif-ferential effects of propofol and sevoflurane on heart rate variability.Anesthesiology2003;98: 4–40.
42. Smajic J, Praso M, Hodzic M, et al. Assessment of depth of anesthesia: PRST score versus bispectral index. Medical Archives2011;65: 216–20.
43. Shalbaf R, Behnam H, Moghadam HJ. Monitoring depth of anesthesia using combination of EEG measure and hemody-namic variables.Cognitive Neurodynamics2015;9: 41–51. 44. Yamakage M, Kamada Y, Toriyabe M, Honma Y, Namiki A.
Changes in respiratory pattern and arterial blood gases during sedation with propofol or midazolam in spinal anesthesia.
Journal of Clinical Anesthesia1999;11: 375–9.
45. Landsverk SA, Kvandal P, Kjelstrup T, et al. Human skin micro-circulation after brachial plexus block evaluated by wavelet transform of the laser Doppler flowmetry signal. Anesthesiol-ogy2006;105: 478–84.
46. Landsverk SA, Kvandal P, Bernjak A, Stefanovska A, Kirkeboen KA. The effects of general anesthesia on human skin microcir-culation evaluated by wavelet transform. Anesthesia and Analgesia2007;105: 1012–9.
47. Storm H, Støen R, Klepstad P, Skorpen F, Qvigstad E, Raeder J. Nociceptive stimuli responses at different levels of general anaesthesia and genetic variability. Acta Anaesthesiologica Scandinavica2013;57: 89–99.
Supporting Information
Additional Supporting Information may be found in the online version of this article:
Appendix S1. Derivation of heart rate variability and respiratory frequency variability.
Appendix S2. Wavelet transform, wavelet phase coherence and synchronisation.
Table S1. The parameters used in the vector-based discriminatory analysis for the different subsets of data.
Table S2. Five confusion matrices, giving the likeli-hoods of correct and incorrect classification for each of the 3 groups of subjects, for five different sets of para-meters.
Figure S1.Illustration of the vector-based discrimina-tory analysis.
Figure S2. J48 decision tree obtained from the com-plete dataset.