Open Access
Debate
Using and interpreting cost-effectiveness acceptability curves: an
example using data from a trial of management strategies for atrial
fibrillation
Elisabeth Fenwick*
1, Deborah A Marshall
2, Adrian R Levy
3and
Graham Nichol
4Address: 1Public Health and Health Policy, University of Glasgow, Glasgow, UK, 2Department of Clinical Epidemiology and Biostatistics,
McMaster University and Centre for Evaluation of Medicines, St. Joseph's Hospital, Hamilton, ON, Canada, 3Department of Health Care and
Epidemiology, University of British Columbia, Vancouver, BC, Canada and 4Harborview Center for Prehospital Emergency Care, University of
Washington, Seattle, USA
Email: Elisabeth Fenwick* - [email protected]; Deborah A Marshall - [email protected]; Adrian R Levy - [email protected]; Graham Nichol - [email protected]
* Corresponding author
Abstract
Background: The cost-effectiveness acceptability curve (CEAC) is a method for summarizing the uncertainty in estimates of cost-effectiveness. The CEAC, derived from the joint distribution of costs and effects, illustrates the (Bayesian) probability that the data are consistent with a true cost-effectiveness ratio falling below a specified ceiling ratio. The objective of the paper is to illustrate how to construct and interpret a CEAC.
Methods: A retrospective cost-effectiveness analysis of the Atrial Fibrillation Follow-up Investigation of Rhythm Management (AFFIRM) randomized controlled trial with 4060 patients followed for 3.5 years. The target population was patients with atrial fibrillation who were 65 years of age or had other risk factors for stroke or death similar to those enrolled in AFFIRM. The intervention involved the management of patients with atrial fibrillation with antiarrhythmic drugs (rhythm-control) compared with drugs that control heart rate (rate-control). Measurements of mean survival, mean costs and incremental cost-effectiveness were made. The uncertainty surrounding the estimates of cost-effectiveness was illustrated through a cost-effectiveness acceptability curve.
Results: The base case point estimate for the difference in effects and costs between rate and rhythm-control is 0.08 years (95% CI: -0.1 years to 0.24 years) and -US$5,077 (95% CI: -$1,100 to -$11,006). The CEAC shows that the decision uncertainty surrounding the adoption of rate-control strategies is less than 1.7% regardless of the maximum acceptable ceiling ratio. Thus, there is very little uncertainty surrounding the decision to adopt rate-control compared to rhythm-control for patients with atrial fibrillation from a resource point of view.
Conclusion: The CEAC is straightforward to calculate, construct and interpret. The CEAC is useful to a decision maker faced with the choice of whether or not to adopt a technology because it provides a measure of the decision uncertainty surrounding the choice.
Published: 19 April 2006
BMC Health Services Research 2006, 6:52 doi:10.1186/1472-6963-6-52
Received: 03 October 2005 Accepted: 19 April 2006
This article is available from: http://www.biomedcentral.com/1472-6963/6/52 © 2006 Fenwick et al; licensee BioMed Central Ltd.
Background
Health care decision-makers need to choose whether or not to reimburse health technologies, and cost-effective-ness is increasingly one of the criteria used to guide that choice. Estimates of cost-effectiveness are inevitably asso-ciated with some degree of uncertainty, generated jointly from the estimate of effectiveness and costs. In addition to the point estimate for cost-effectiveness, a confidence interval around the estimate provides the decision-maker with a measure of the degree of uncertainty. The cost-effectiveness acceptability curve (CEAC) is an intuitive graphical method of summarizing information on uncer-tainty in cost-effectiveness estimates. The CEAC is straight-forward to construct and interpret, which is why it is increasingly becoming a part of economic evaluations for decision makers.
Objective
As the use of CEACs becomes more widespread [1-11] it is important that researchers learn how to construct, apply, and interpret these curves. In this paper, a recently pub-lished cost-effectiveness analysis comparing rhythm-con-trol versus rate-conrhythm-con-trol treatment for atrial fibrillation is used to illustrate the CEAC [12]. After a brief introduction on cost-effectiveness analysis and uncertainty, to frame the issue, this paper describes how to construct a CEAC and how it should be interpreted. This paper concentrates specifically on decisions involving two interventions. For evaluations comparing more than two interventions see Fenwick et al., 2001 [13].
The AFFIRM study
The objective of the Atrial Fibrillation Follow-up Investi-gation of Rhythm Management (AFFIRM) trial was to compare the effectiveness of rhythm-control versus rate-control in patients with atrial fibrillation [14]. After a mean follow-up time of 3.5 years in both arms of the trial, there was a non-significant mean survival gain of 0.08 years (P = 0.10, based on a two-sided test) for subjects ran-domized to the rate-control arm. A trial-based economic evaluation was undertaken to estimate the cost-effective-ness of rhythm-control versus rate-control based on the results from AFFIRM [12]. Rate-control subjects con-sumed fewer resources (hospital days, pacemaker proce-dures, cardioversions, and short stay and emergency room visits) and had a lower per patient cost than rhythm-con-trol subjects (US $5,077 per person). Non-parametric bootstrapping methods were used to estimate the distri-bution of incremental costs and effects associated with rhythm-control compared to rate-control. We found that rate-control was less costly and more effective than rhythm-control in 95% of the replicates under a range of cost assumptions. We concluded that rate-control was a cost-effective approach to the management of atrial fibril-lation when compared to rhythm-control.
The cost-effectiveness analysis of the AFFIRM trial data provides a good illustration of how uncertainty in the esti-mate of cost-effectiveness must consider the distribution of both costs and effects. Based on the effectiveness data alone, one might conclude that either treatment is equally effective, with a small and not statistically significant trend in survival favoring one arm (rate-control). After considering the joint distribution of costs and effects, rate-control is the favored initial approach to treatment because of the lower cost compared to rhythm-control, despite the absence of a statistically significant difference in survival between the two treatments.
Cost-effectiveness analysis
A cost-effectiveness analysis enumerates the additional resources consumed for an improvement in the effects (for example, survival or quality-adjusted life years) asso-ciated with one health intervention compared to another. The result can be summarized as an incremental cost-effectiveness ratio (ICER) – a measure of the additional cost per unit of health gain. The underlying calculation for the ICER comparing rate-control versus rhythm-control treatment in patients with atrial fibrillation was:
where costs were measured in US dollars and effects were measured in life years gained.
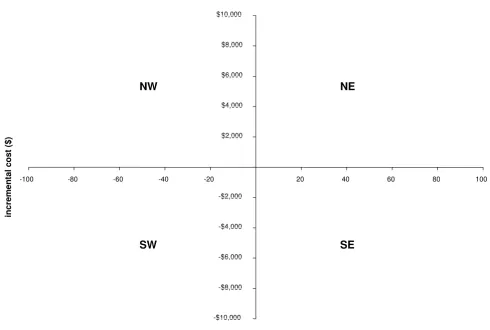
The incremental cost and incremental effect can be repre-sented visually using the incremental cost-effectiveness plane [15]. The horizontal axis divides the plane accord-ing to incremental cost (positive above, negative below) and the vertical axis divides the plane according to incre-mental effect (positive to the right, negative to the left). This divides the incremental cost-effectiveness plane into four quadrants through the origin (Figure 1).
Each quadrant has a different implication for the decision. If the ICER for rate-control compared to rhythm-control fell in the southeast quadrant, with negative costs and positive effects, rate-control would be more effective (bet-ter survival) and less costly than rhythm-control (i.e., rate-control 'dominates' rhythm-rate-control). Interventions fall-ing in this quadrant are always considered cost-effective. If the ICER fell in the northwest quadrant, with positive costs and negative effects, rate-control would be more costly and less effective than rhythm-control (i.e., rate-control is 'dominated' by rhythm-rate-control). Interventions falling in this quadrant are never considered cost-effective. If the ICER fell in the northeast quadrant, with positive costs and positive effects, or the southwest quadrant, with negative costs and negative effects, trade-offs between costs and effects would need to be considered. These two
ICER Average Cost Average Cost
Av
rate-control rhythm-control
= −
quadrants represent the situation where rate-control may be cost-effective compared to rhythm-control, depending upon the value at which the ICER is considered good value for money.
Value for money
In order to decide if an intervention offers "good" value for money, the ICER must be compared to a specified monetary threshold. This threshold represents the maxi-mum amount that the decision-maker is willing to pay for health effects (maximum acceptable ceiling ratio). The intervention is deemed cost-effective if the ICER falls below this threshold and not cost-effective otherwise [16]. For example, if a decision-maker is willing to pay $50,000 for a year of life, the intervention is considered cost-effec-tive if the ICER is below $50,000 per life year gained. In situations where a threshold is not stated explicitly, the act of decision-making implies a value for the threshold.
Is rate-control in the management of patients with atrial fibrillation 'good value for money' compared to rhythm-control? The base case cost-effectiveness analysis of the AFFIRM trial reported that rate-control demonstrated a non-significant mean survival gain compared to rhythm-control (0.08 years, CI -0.1 to 0.24), and that rate-rhythm-control was less costly than rhythmcontrol (US $5,077, CI -$1,100 to -$11,006). In this situation, no ICER would be calculated because the point estimate for the ICER falls in the southeast quadrant of the cost-effectiveness plane where rate-control is more effective and less costly than the control (i.e., rate-control dominates rhythm-control). Rate-control would clearly be considered 'good value for money'. However, this does not take any uncer-tainty in the estimates of costs and effects into considera-tion and decision makers will be interested to ascertain how sure they can be that this is the correct conclusion to make.
[image:3.612.59.549.87.416.2]The incremental cost-effectiveness plane Figure 1
The incremental cost-effectiveness plane. NE = northeast quadrant; NW = northwest quadrant; SE = southeast quadrant; SW = southwest quadrant; QALY = quality adjusted life year
-$10,000 -$8,000 -$6,000 -$4,000 -$2,000 $2,000 $4,000 $6,000 $8,000 $10,000
-100 -80 -60 -40 -20 20 40 60 80 100
incremental effect (QALYs)
in
cremen
ta
l cost
($
)
SE
NE
Uncertainty in costs and effects
Due to imperfect information on the effectiveness of intervention and the resources consumed for treatment, both the costs and effects of health interventions are inev-itably associated with some degree of uncertainty. The presence of this uncertainty means that there is inevitably some possibility that decisions made on the basis of the available (uncertain) information will be incorrect and introduces the possibility of error into decision-making. The use of stochastic (e.g., bootstrapping) and probabilis-tic techniques (e.g., Monte Carlo simulation), for trial analyses and modeling studies respectively, to generate the sampling distribution of the joint mean cost and effi-cacy has enabled quantification of the uncertainty sur-rounding the estimates of costs and effects.
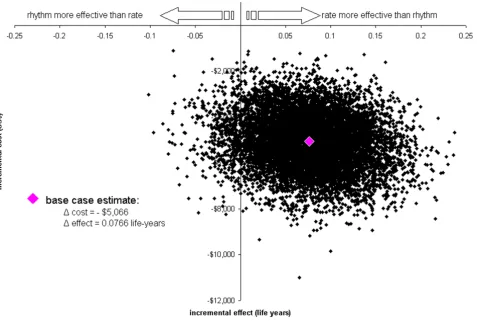
One method that is typically used to represent the uncer-tainty in the costs and effects associated with a technology is a scatter plot of simulated (by bootstrapping or proba-bilistic modeling) incremental cost and effect pairs on the incremental cost-effectiveness plane [17]. Figure 2 illus-trates the incremental cost-effectiveness plane for the cost and effectiveness data bootstrapped from the AFFIRM trial. The base case point estimate for the difference in costs and effects between rate and rhythm-control is marked at 0.08 years and -$5,077. The scatter plot addi-tionally illustrates the uncertainty surrounding the esti-mates of expected incremental cost (in 2002 US dollars) and expected incremental effect (life years gained) associ-ated with rate-control compared to rhythm-control strate-gies for the management of patients with atrial fibrillation enrolled in the trial. The location of the incremental cost-effect pairs indicates that there is little uncertainty regard-ing the existence of cost-savregard-ings with rate-control strate-gies (in comparison with rhythm-control stratestrate-gies) because all points fall below the horizontal axis. However, the spread of the points in the vertical plane indicates that there is some uncertainty regarding the magnitude of the cost-savings (-$1,100 to -$11,006). With regard to effec-tiveness, the location and spread of the points indicate that there is uncertainty regarding the existence and extent of a survival benefit associated with rate-control com-pared to rhythm-control (from -0.1 years to 0.24 years). This is consistent with the finding of a non-significant dif-ference in survival gain between the two treatment groups. This scatter plot provides additional information about the uncertainty surrounding cost and effects for rate-con-trol versus rhythm-conrate-con-trol treatment. However, while these independent incremental cost-effect pairs provide some information about the joint uncertainty in the esti-mate of incremental cost-effectiveness it is not clear how to present a summary measure of this uncertainty.
Uncertainty in cost-effectiveness
There remains considerable debate concerning the presen-tation of joint uncertainty for estimates of cost-effective-ness. This is partly because there are additional statistical complexities associated with calculating confidence inter-vals for ratios such as the ICER. As a result of these chal-lenges, a number of alternative methods for calculating confidence intervals have been proposed. These methods include the use of Fieller's theorem and non-parametric bootstrapping [18,19]. However, these solutions do not resolve the problems associated with a small or non-exist-ent effect difference which would cause the ICER to be undefined and may make the variance intractable [20-22]. Furthermore, the appropriate role of uncertainty in the context of decision-making is unclear [13].
Determining the uncertainty surrounding cost-effective-ness requires the investigation of the joint distribution of costs and effects. For the AFFIRM study (Figure 2) the majority of incremental cost-effect pairs fall in the south-east quadrant of the incremental cost-effectiveness plane, indicating that the rate-control strategy is less costly and more effective than the rhythm-control strategy for the management of patients with atrial fibrillation. However, a proportion (approximately 5%) of the points lie in the southwest quadrant, indicating that the rate-control strat-egy is less costly and also less effective than the rhythm-control strategy. This confirms that there is some uncer-tainty concerning whether and at what value the rate-con-trol strategy is cost-effective.
Cost-effectiveness acceptability curves (CEAC)
Faced with the choice of whether or not to reimburse a new technology, the decision maker will likely be inter-ested in the probability that the new technology is cost-effective compared to the existing alternative. This proba-bility can be identified from the incremental cost-effec-tiveness plane with reference to the decision-maker's defined maximum acceptable ceiling ratio (λ). This prob-ability is simply the proportion of the scatter plot points that fall to the south and east of a ray with slope of λ drawn through the origin (i.e., proportion of incremental cost-effect pairs with a value below λ). Since the maxi-mum acceptable ceiling ratio will generally not be stated explicitly, a sensitivity analysis should be undertaken with the probability determined for a range of λ s. The CEAC provides a plot of these probabilities (y-axis) against λ (x-axis) [23,24].
of probability i.e. the probability that the hypothesis is true ('rate-control strategy is cost-effective') given the data, although the CEAC can be given a Frequentist interpreta-tion [21,22].
Figure 3 shows the CEAC for the probability that a rate-control strategy is cost-effective compared with rhythm-control, for a range of λ s that a decision maker might con-sider as the maximum cost they are willing to pay for a gain in one year of life. Given a specified value of this 'acceptable' cost-effectiveness ratio (i.e., λ on the x-axis), the CEAC shows the probability (read off on the y-axis) that the data are consistent with a true cost-effectiveness ratio falling below that value.
Constructing a CEAC
The CEAC is derived from the joint distribution of incre-mental costs and increincre-mental effects. When analysing a clinical trial, this distribution is most commonly esti-mated using non-parametric bootstrapping however it can be generated from a probabilistic analysis of a deci-sion model which translates the uncertainty in input
[image:5.612.68.545.92.414.2]parameters into uncertainty in costs and effects [23,24,26]. The curve is constructed by plotting the pro-portion of the incremental effect pairs that are cost-effective for a range of λ values. This proportion is identi-fiable from the incremental cost-effectiveness plane as the proportion of incremental cost-effect pairs lying to the south and east of a ray through the origin with a slope equivalent to the x-axis (i.e., λ = 0). This is repeated for larger and larger λ s until infinity is reached (i.e., the slope of the line is equivalent to the y-axis). Incremental cost-effect pairs that fall in the northwest quadrant are never considered cost-effective and therefore are never counted in the numerator of the estimate. Incremental cost-effect pairs that fall in the southeast quadrant are always consid-ered cost-effective and therefore are always counted in the numerator of the estimate. As λ increases from zero to infinity, incremental cost-effect pairs in the northeast and southwest quadrants may or may not be considered cost-effective (and therefore included in the numerator) depending upon the maximum amount the decision maker is willing to pay for an additional year of life (i.e.,
λ). As a result, the CEAC does not represent a cumulative
Scatter plot of estimated joint density of incremental costs and incremental effects of rate-control vs. rhythm-control obtained by bootstrap re-sampling in the AFFIRM trial
Figure 2
distribution function and its shape will depend solely upon the location of the incremental cost-effect pairs within the incremental cost-effectiveness plane (for more details see Fenwick et al, 2004 [26]).
AFFIRM
For the AFFIRM study, all of the 10,000 bootstrap re-sam-ples involved cost-savings (i.e., fell below the x-axis), hence 100% of the incremental cost-effect pairs fell to the south of the line when λ was zero (i.e., fell below the x-axis); as a result the CEAC crosses the y-axis at 1. When λ was $50,000 per life year gained, a proportion of the re-samples falling within the southwest quadrant are no longer considered cost-effective and therefore are no longer included in the numerator. As a result the propor-tion of the re-samples that were cost-effective (i.e., fell to the south and east of a ray of slope equal to $50,000 per life year gained) was found to be 99.94%, and when λ equaled $100,000 per life year gained, the proportion was 99.42% (Figure 3). The proportion of the re-samples fall-ing in the northeast or southeast quadrants (i.e. were cost-effective when λ was infinite) was found to be 98.3%.
Hence as λ tends to infinity the probability that rate-con-trol is cost-effective compared to rhythm conrate-con-trol tends to 0.983 (Figure 3).
Interpreting and using CEACs
As stated above, the CEAC indicates the probability that the intervention is cost-effective compared with the alter-native, given the data, for a range of values of the maxi-mum acceptable ceiling ratio. Thus, the interpretation of the AFFIRM study is that, given a maximum acceptable ceiling ratio of $50,000 per life year gained, the probabil-ity that rate-control is cost-effective compared to rhythm-control is 0.9994. This is equivalent to stating that, given the data, there is a 99.94% chance that the additional cost of rate-control, compared with rhythm-control, is at or below $50,000 per life year gained. Now we have sum-mary measure of joint uncertainty in the estimate of incre-mental cost-effectiveness.
The information provided by the CEAC is useful to a deci-sion maker faced with the choice of whether or not to adopt a technology because it provides a measure of the
Cost-effectiveness acceptability curve showing the probability that rate-control is cost-effective compared to rhythm-control over a range of values for the maximum acceptable ceiling ratio (λ) in the AFFIRM trial
Figure 3
uncertainty surrounding the choice (decision uncertainty) given the decision makers selected value of λ. In the case of the AFFIRM study, there was no statistically significant difference in effectiveness between rate-control and rhythm-control strategies for the management of patients with atrial fibrillation. However, the CEAC shows that the decision uncertainty surrounding the adoption of rate-control strategies is less than 1.67% regardless of the max-imum acceptable ceiling ratio. Thus, there is very little uncertainty that the decision to adopt rate-control com-pared to rhythm-control for patients with atrial fibrilla-tion is correct from a cost-effectiveness point of view. It must be noted that statements concerning CEACs should be restricted to those regarding the uncertainty of the esti-mate of cost-effectiveness. The information from a CEAC
should not, in general, be used to make statements about the implementation of the intervention (for more details see Fenwick et al, 2001 [13]).
Conclusion
In clinical practice, physicians are increasingly being asked to consider the economic consequences of their treatment decisions. Cost-effectiveness acceptability curves are useful for this purpose because they explicitly incorporate the joint uncertainty – in the effectiveness and cost – into the decision. Furthermore, researchers need to present the consequences of clinical interventions in terms of health benefits and costs to facilitate reimburse-ment decisions by policy makers. The graphic representa-tion using CEACs facilitates straightforward interpretarepresenta-tion by persons unfamiliar with economic evaluation.
In this article, we present the CEAC for a trial of rate-con-trol versus rhythm-conrate-con-trol in atrial fibrillation and show how incorporating joint uncertainty affects the interpreta-tion of the results. Specifically, the randomized trial showed no statistical difference in efficacy between rhythm- and rate-control [27], with a trend towards greater benefit in the rate-control arm. The point estimate from a standard cost-effectiveness analysis showed that rate-control was less costly, suggesting that it was the pre-ferred treatment option among patients similar to those enrolled in AFFIRM [12]. The CEAC shown in Figure 3 quantifies the uncertainty in a graphic format. This figure makes it clear that a decision maker can opt for rate-con-trol as the preferred treatment option with a high degree of confidence under a wide range of funding thresholds.
In summary, CEACs are straightforward to calculate, con-struct, and interpret in addition to having methodological advantages. As a result, they are increasingly being reported in economic evaluations of treatments and will receive greater attention by clinicians, decision-makers, and researchers.
Competing interests
The author(s) declare that they have no competing inter-ests.
Authors' contributions
EF – 1) made substantial contributions to conception and design, analysis and interpretation of data; 2) was involved in drafting the manuscript; and 3) has given final approval of the version to be published.
DM – 1) made substantial contributions to conception and design; 2) was involved in revising the manuscript critically for important intellectual content; and 3) has given final approval of the version to be published.
AL – 1) made substantial contributions to conception and design; 2) was involved in revising the manuscript criti-cally for important intellectual content; and 3) has given final approval of the version to be published.
GN – 1) made substantial contributions to conception and design; and 2) has given final approval of the version to be published.
Acknowledgements
The authors would like to thank Nathalie Kulin for assistance with drafting the manuscript.
References
1. Bower P, Byford S, Barber J, Beecham J, Simpson S, Friedli K, Corney R, King M, Harvey I: Meta-analysis of data on costs from trials of counselling in primary care: using individual patient data to overcome sample size limitations in economic analyses. BMJ 2003, 326:1247-1250.
2. Byford S, Knapp M, Greenshields J, Ukoumunne O, Jones V, Thomp-son S, Tyrer P, Schmidt U, DavidThomp-son K, Group P: Cost-effective-ness of brief cognitive behaviour therapy versus treatment as usual in recurrent deliberate self-harm: a decision-making approach. Psychol Med 2003, 33(6):977-986.
3. Chilcott J, McCabe C, Tappenden P, O'Hagan A, Cooper N, Abrams K, Claxton K, Miller D, Group CEoMSTS: Modelling the cost effectiveness of interferon beta and glatiramer acetate in the management of multiple sclerosis. Commentary: evaluating disease modifying treatments in mulitple sclerosis. BMJ 2003,
326:522-524.
4. Delaney B, Wilson S, Roalfe A, Roberts L, Redman V, Wearn A, Briggs A, Hobbs F: Cost effectiveness of initial endoscopy for dypep-sia in patients over age 50 years: a randomised controlled trial in primary care. Lancet 2000, 356:1965-1969.
5. Drummond M, Becker D, Hux M, Chancellor J, Duprat-Lomon I, Kubin R, Sagnier P: An economic evaluation of sequential i.v./ po moxifloxacin therapy compared to i.v./po co-amoxiclav with or without clarithromycin in the treatment of commu-nity-acquired pneumonia. Chest 2003, 124(2):526-535. 6. Gray A, Raikou M, McGuire A, Fenn P, Stevens R, Cull C, Stratton I,
Adler A, Holman R, Turner R: Cost effectiveness of an intensive blood glucose control policy in patients with type 2 diabetes: economic analysis alongside randomised controlled trial (UKPDS 41). BMJ 2000, 320(7246):1373-1378.
7. Manns B, Lee H, Doig C, Johnson D, Donaldson C: An economic evaluation of activated protein C treatment for severe sep-sis. New England Journal of Medicine 2002, 347(13):993-1000. 8. Multicentre Aneurysm Screening Group: Multicentre aneurysm
Publish with BioMed Central and every scientist can read your work free of charge "BioMed Central will be the most significant development for disseminating the results of biomedical researc h in our lifetime."
Sir Paul Nurse, Cancer Research UK
Your research papers will be:
available free of charge to the entire biomedical community
peer reviewed and published immediately upon acceptance
cited in PubMed and archived on PubMed Central
yours — you keep the copyright
Submit your manuscript here:
http://www.biomedcentral.com/info/publishing_adv.asp
BioMedcentral results from a randomised controlled trial. BMJ 2002,
325:1135-1138.
9. Ramsey S, Berry K, Etzioni R, Kaplan R, Sullivan S, Wood D, Group NETTR: Cost effectiveness of lung-volume-reduction surgery for patients with severe emphysema. New England Journal of Medicine 2003, 348(21):2092-2102.
10. Sheldon R, O'Brien B, Blackhouse G, Goeree R, Mitchell B, Klein G, Roberts R, Gent M, Connolly S: Effect of clinical risk stratifica-tion on cost-effectiveness of the implantable cardioverter-defibrillator: the Canadian implantable defibrillator study. Circulation 2001, 104(14):1622-1626.
11. UK Prospective Diabetes Study Group: Cost effectiveness analy-sis of improved blood pressure control in hypertensive patients with type 2 diabetes: UKPDS 40. BMJ 1998,
317:720-726.
12. Marshall D, Levy A, Vidaillet H, Fenwick E, Slee A, Blackhouse G, Greene H, Wyse G, Nichol G, O'Brien B, et al.: Cost-effectiveness of rhythm versus rate control in atrial fibrillation. Annals of Internal Medicine 2004, 141(9):653-661.
13. Fenwick E, Claxton K, Sculpher M: Representing uncertainty: The role of cost-effectiveness acceptability curves. Health Econ 2001, 10:779-787.
14. Wyse G, Waldo A, DiMarco J, Domanski M, Rosenberg Y, Schron E:
A comparison of rate control and rhythm control in patients with atrial fibrillation. New England Journal of Medicine 2002,
347:1825-1833.
15. Black W: The CE plane: A graphic representation of cost-effectiveness. Medical Decision Making 1990, 10:212-214. 16. Stinnett AA, Mullahy J: Net Health Benefits: A new framework
for the analysis of uncertainty in cost-effectiveness analysis. Med Decis Making 1998, 18(2 Suppl):S68-80.
17. Briggs AH, Gray A: Handling uncertainty when performing economic evaluation of healthcare interventions. Health Tech Assess 1999, 3:.
18. Briggs AH, Wonderling DE, Mooney CZ: Pulling cost-effective-ness analysis up by its bootstraps: a non-parametric approach to confidence interval estimation. Health Economics
1997, 6:327-340.
19. Lothgren M, Zethraeus N: Definition, interpretation and calcu-lation of cost-effectiveness acceptability curves. Health Eco-nomics 2000, 9:623-630.
20. Willan A, O'Brien B: Confidence intervals for cost-effectiveness analysis ratios: an application of Fieller's theorem. Health Eco-nomics 1996, 5(4):297-305.
21. Heitjan DF, Moskowitz AJ, Whang W: Problems with interval estimates of the incremental cost-effectiveness ratio. Medical Decision Making 1999, 19(1):9-15.
22. O'Hagan A, Stevens JW, Montmartin J: Inference for the cost-effectiveness acceptability curve and cost-cost-effectiveness ratio. Pharmacoeconomics 2000, 17:339-349.
23. Briggs A, Fenn P: Confidence intervals or surfaces ? Uncer-tainty on the cost-effectiveness plane. Health Economics 1998,
7:723-740.
24. Van Hout B, Al M, Gordon G, Rutten F: Costs, effects and c/e-ratios alongside a clinical trial. Health Economics 1994,
3:309-319.
25. O'Brien B, Briggs A: Analysis of uncertainty in health care cost-effectiveness studies: an introduction to statistical issues and methods. Statistical Methods in Medical Research 2002, 11:455-468. 26. Fenwick E, O'Brien B, Briggs A: Cost-effectiveness acceptability
curves: facts, fallacies and frequently asked questions. Health Economics 2004, 13:405-415.
27. Bahnson TD, Grant AO: To be or not to be in normal sinus rhythm: What do we really know? Annals of Internal Medicine
2004, 141(9):727-729.
Pre-publication history
The pre-publication history for this paper can be accessed here: