R E S E A R C H A R T I C L E
Open Access
Integrative analyses of gene expression and DNA
methylation profiles in breast cancer cell line
models of tamoxifen-resistance indicate a potential
role of cells with stem-like properties
Xue Lin
1,2†, Jian Li
1,2,3,4†, Guangliang Yin
1,3, Qian Zhao
5, Daniel Elias
1,4, Anne E Lykkesfeldt
1,6, Jan Stenvang
1,7,
Nils Brünner
1,7, Jun Wang
1,3, Huanming Yang
1,3,8, Lars Bolund
1,2,3*and Henrik J Ditzel
1,4,9*Abstract
Introduction:Development of resistance to tamoxifen is an important clinical issue in the treatment of breast cancer. Tamoxifen resistance may be the result of acquisition of epigenetic regulation within breast cancer cells, such as DNA methylation, resulting in changed mRNA expression of genes pivotal for estrogen-dependent growth. Alternatively, tamoxifen resistance may be due to selection of pre-existing resistant cells, or a combination of the two mechanisms.
Methods:To evaluate the contribution of these possible tamoxifen resistance mechanisms, we applied modified DNA methylation-specific digital karyotyping (MMSDK) and digital gene expression (DGE) in combination with massive parallel sequencing to analyze a well-established tamoxifen-resistant cell line model (TAMR), consisting of 4 resistant and one parental cell line. Another tamoxifen-resistant cell line model system (LCC1/LCC2) was used to validate the DNA methylation and gene expression results.
Results:Significant differences were observed in global gene expression and DNA methylation profiles between the parental tamoxifen-sensitive cell line and the 4 tamoxifen-resistant TAMRsublines. The 4 TAMRcell lines exhibited higher methylation levels as well as an inverse relationship between gene expression and DNA methylation in the promoter regions. A panel of genes, includingNRIP1,HECA andFIS1,exhibited lower gene expression in resistant vs. parental cells and concurrent increased promoter CGI methylation in resistant vs. parental cell lines. A major part of the methylation, gene expression, and pathway alterations observed in the TAMRmodel were also present in the LCC1/LCC2 cell line model. More importantly, high expression ofSOX2 and alterations of otherSOXandE2Fgene family members, as well as RB-related pocket protein genes in TAMRhighlighted stem cell-associated pathways as being central in the resistant cells and imply that cancer-initiating cells/cancer stem-like cells may be involved in tamoxifen resistance in this model.
Conclusion:Our data highlight the likelihood that resistant cells emerge from cancer-initiating cells/cancer stem-like cells and imply that these cells may gain further advantage in growth via epigenetic mechanisms. Illuminating the expression and DNA methylation features of putative cancer-initiating cells/cancer stem cells may suggest novel strategies to overcome tamoxifen resistance.
* Correspondence:bolundlars@gmail.com;hditzel@health.sdu.dk
†Equal contributors
1Sino-Danish Breast Cancer Research Centre, Copenhagen, Denmark
4Department of Cancer and Inflammation Research, Institute of Molecular
Medicine, University of Southern Denmark, J. B. Winsloews Vej 25.3, DK-5000 Odense, Denmark
Full list of author information is available at the end of the article
Introduction
Around 80% of breast cancer patients present with pri-mary breast tumors that are estrogen receptor (ER) alpha-positive, suggesting that the tumor is dependent on estrogen for growth [1,2]. Accordingly, most of these patients are offered endocrine therapy, which currently consists of the anti-estrogen tamoxifen or aromatase in-hibitors. These drugs can be used successfully both in the adjuvant and advanced disease settings. Tamoxifen belongs to the selective ER modulator class of drugs that act both as antagonists and as agonists in an ER-dependent and tissue-dependent manner [3]. For ex-ample, in breast cancer tissue, tamoxifen acts as a com-petitive estrogen antagonist by competing with estrogen for binding to ER, thereby inhibiting the growth of estrogen-dependent breast cancer cells [4]. However, about one-third of primary ER-positive breast tumors do not benefit from adjuvant tamoxifen treatment, resulting in disease recurrence [5]. In metastatic disease, disease progression eventually occurs in most patients receiving tamoxifen treatment.
Acquired endocrine resistance is suggested to develop as a result of a complex set of molecular changes, including specific gene expression alterations, and/or modifications and loss of ER [6]. These changes have been observed in
in vitromodels of tamoxifen resistance and in ER-positive breast cancer patients with recurrent disease following endocrine treatment [7]. As it is currently not possible to predict sensitivity/resistance to endocrine treatment in ER-positive breast cancer patients, new tests to identify endocrine-resistant ER-positive breast cancer are being developed using different molecular markers [8].
Several distinct molecular mechanisms may lead to tamoxifen resistance, and within individual tumors differ-ent cancer cells may use differdiffer-ent mechanisms, complicat-ing the evaluation of tamoxifen resistance mechanism(s) when examining whole tumor samples. These obstacles have led to studies of isogenic tamoxifen-resistant breast cancer cell line model systems that may have some advan-tages in pinpointing individual resistance mechanisms. The estrogen-responsive and tamoxifen-sensitive human breast cancer cell line MCF-7 [9,10] and its derived tamoxifen-resistant sub-lines MCF-7/TAMR-1, MCF-7/TAMR-4, MCF-7/TAMR-7 and MCF-7/TAMR-8 [11,12] constitute a well-establishedin vitromodel that has been used to iden-tify several proteins potentially involved in signaling path-ways associated with tamoxifen resistance in ER-positive breast cancer cells; for example, phosphorylated Akt, PKCα, PKCδ, EGFR and HER2 [13-15]. A number of these proteins have been positively validated in clinical studies [16-18]. Tamoxifen resistance in the TAMRcell lines was developed by culturing the parental cell line in an initial high dose of tamoxifen (1μM). In contrast, tamoxifen re-sistance in the LCC1/LCC2 cell line model system was
developed by incrementally increased doses of tamoxifen to the parental cell line MCF7/LCC1 (estrogen inde-pendent and tamoxifen sensitive) [19].
Epigenetic alterations, which include modifications of DNA, histones and chromatin, play an important role in transcription regulation. Epigenetic changes are re-versible and can occur quickly during environmental changes [20]. Increasing evidence indicates that these epigenetic alterations, particularly DNA methylation, may be used as future markers for diagnosis, prognosis and pre-diction of response to therapies [21]. A few studies have suggested that epigenetic alterations may also play a role in tamoxifen resistance in breast cancer [22,23]. Recently, cancer stem cells were also reported to be associated with cancer therapy resistance [24]. There are thus three hy-potheses in the development of tamoxifen resistance: first, ER-positive breast cancer cells can acquire tamoxifen re-sistance by epigenetic alternation resulting in changed mRNA expression of genes pivotal for estrogen-dependent growth; second, tamoxifen resistance develops due to se-lection of preexisting cancer initiating cells/cancer stem-like cells; and third, tamoxifen resistance results from a combination of the above hypotheses–that is, by selection of preexisting resistant cells that gain or repress gene ex-pression to acquire further advantage in growth via epigen-etic mechanisms, such as changed DNA methylation.
To test the above hypotheses, we applied modified DNA methylation-specific digital karyotyping (MMSDK) [25] and digital gene expression (DGE) in combination with next-generation parallel sequencing to analyze methylation and gene expression profiles of the parent MCF-7 breast cancer cell line and its tamoxifen-resistant TAMR cell lines (see Additional file 1 for a description and an illustration of the MMSDK methods). The resulting methylation data were compared with the corresponding gene expression profiles. In addition, methylation and gene expression alterations identified in the TAMR cell line model were validated in the LCC1/LCC2 tamoxifen-resistant cell line model.
Methods
TAMRcell line model
MCF-7/TAMR-8 (TAMR-8), were derived from distinct colonies that emerged in cultures of MCF-7/S0.5 cells treated with 1 μM tamoxifen [11,27]. The TAMR cell lines were maintained in Dulbecco’s modified Eagle’s medium/F12 (1:1) supplemented with 1% FCS and 1μM tamoxifen, as detailed by Thrane and colleagues [28]. Tamoxifen had a weak agonistic effect (20 to 80% in-crease after 5 days) on growth of the tamoxifen-resistant cell lines [28]. Withdrawal of tamoxifen for up to 15 weeks did not change the growth characteristics of the TAMR-1 cell line, demonstrating a stable resistant pheno-type [11]. The cells were kept within 10 passages through-out the experiment to reduce possible variability between experimental results.
LCC1/LCC2 cell line model
The estrogen-independent, but tamoxifen-responsive, LCC1 cell line was established from the hormone-dependent parent cell line MCF-7 through prolonged withdrawal from potent estrogenic stimuli both in vivo andin vitro[29]. Thein vivoselected cell line was further passaged in ovariectomized athymic nude mice and re-established in vitro to generate a new cell line, MCF-7/ LCC1, which is also estrogen independent but is similarly tamoxifen responsive as its parent cell line [30]. Further-more, the new cell estrogen-independent, tamoxifen-resistant sub-line LCC2 [19] was developed through growth of LCC1 in incrementally increased dosages of tamoxifen in vitro. LCC1 and LCC2 were cultured in Dulbecco’s modified Eagle’s medium/F12 without phenol red, supplemented with dextran charcoal-stripped 5% FCS and 1% penicillin/streptomycin. The cells were maintained at 37°C in a humidified atmosphere of 95% ambient air and 5% carbon dioxide. Genomic DNA and total RNA were isolated from LCC1 and LCC2.
Modified DNA methylation-specific digital karyotyping
For optimized MMSDK library construction, the BssHII restriction enzyme (New England Biolabs, Hitchin, UK) was selected. This enzyme has 52,167 recognition sites in the human genome, but only unmethylated sites are cleaved. The sites are preferentially located in CpG islands and promoters in the human genome, thus providing higher resolution for mapping DNA methylation in the human genome than previous methods [25].
In silicodigital digestion of the unmethylated human gen-ome withBssHII andNlaIII was performed. The distribu-tion of the lengths of the theoretically generated BssHII/
NlaIII fragments was calculated and the majority of frag-ments were shorter than 1,000 base pairs (bp), with a fre-quency peak at 50 to 150 bp. Within CpG islands (CGIs), 23,818BssHII recognition sites were identified, accounting for 45.7% of allBssHII recognition sites in the human gen-ome. Our approach also allowed determination of the
methylation state of CpGs in repeat sequences. According to RepeatMasker [31], 23.0% of the BssHII sites were located within repeat sequences in the human genome. MMSDK libraries using BssHII/NlaIII were generated from the parental tamoxifen-sensitive cell line MCF-7/ S0.5 and the four TAMR cell lines TAMR-1, TAMR-4, TAMR-7 and TAMR-8. DNA was isolated from the cell lines using a DNeasy® Blood & Tissue Kit (Qiagen, Man-chester, UK) according to the manufacturer’s protocol. Genomic DNA was digested with BssHII followed by ligation to biotinylated adaptors and fragmented byNlaIII (New England BioLabs) cleavage. BecauseBssHII only cuts unmethylated regions, binding of DNA fragments to streptavidin-conjugated magnetic beads allows separation of unmethylated and methylated fragments. Bound DNA was ligated to another adaptor N containing the MmeI restriction enzyme recognition site, and then digested with
MmeI (New England Biolabs), which generates short sequence tags (16 to 17 bp, due to enzyme cut floating).
The resulting tags were ligated with another adaptor P7 and amplified by polymerase chain reaction (PCR) with primers N and P7 for 18 cycles. The five indexed MMSDK libraries were sequenced in one lane, result-ing in 1.38 Gb clean tag data for all five cell lines, with an average sequencing amount of ~270 Mb per library. A description of the MMSDK method is pro-vided in Additional file 1. Prior to normalization, the total number of aligned tags of MMSDK for MCF-7/ 0.5, TAMR-1, TAMR-4, TAMR-7 and TAMR-8 were 1,908,177, 2,574,465, 2,556,778, 2,884,094 and 2,650,408, respectively. On average, 59.5% of the tags with mapping quality ≥20 were mapped back to the simulated BssHII/
NlaIII reference library, which was used for the subse-quent analysis.
Digital gene expression tag sequencing
The PCR products were purified and pooled for direct se-quencing with Hiseq 2000 (Illumina, San Diego, CA, USA) using standard single-end 50-nucleotide sequencing. The sequences of the adaptors and primers are available in Additional file 2. The five indexed DGE libraries were sequenced in one lane, resulting in 1.71 Gb clean tag data for all five TAMR cell lines, with an average sequencing amount of ~340 Mb per library. Similarly, the two indexed DGE libraries for LCC1 and LCC2 were sequenced in another lane. Prior to normalization, the total number of aligned tags of DGE for MCF-7/0.5, TAMR-1, TAMR-4, TAMR-7, TAMR-8, LCC1 and LCC2 were 2,164,460, 2,038,646, 2,047,000, 2,111,546, 1,980,773, 1,583,224 and 3,096,827, respectively. On average, 40.8% of the tags with mapping quality ≥20 were mapped back to the simulated
NlaIII human transcriptome (refMrna reference library), which were used for the subsequent analysis.
Accession numbers
The raw data and metadata of DGE and MMSDK for the MCF-7/S0.5 and four TAMR cell line model were deposited in the NCBI Gene Expression Omnibus data-base [GEO:GSE40665].
Statistical and bioinformatic analysis for MMSDK and DGE
Identifying and trimming reads (tags)
According to the experimental design, tags of 16 to 17 nucleotides were mapped together with the neighboring four nucleotides (the recognition sequence of NlaIII) to
in silicoreferences to reveal the methylation status using MMSDK analysis, and to reveal the mRNA profile using DGE analysis. The command line tool FASTX-Toolkit implemented in Perl was used to trim the adaptor se-quence [32]. The trimmed tags were subjected to quality filtering so that only tags with sequencing quality >30 for >80% of the nucleotides were used for subsequent analysis.
Mapping tags
For tag mapping, we generated a simulated BssHII refer-ence library by in silico enzyme digestion of the human genome regardless of the methylation state. This library was used as a reference for subsequent mapping of the tags in the MMSDK analysis. In the DGE analysis, refMrna (hg19; University of California, Santa Cruz (UCSC), CA, USA) was subjected to in silico digestion withNlaIII andMmeI and the digested mRNAs were used as a reference for mapping cDNA tags. Subsequently, the Burrows-Wheeler Alignment tool (BWA) procedure [33] allowing one mismatch for aligning the MMSDK and DGE tags to the simulated BssHII reference library and the refMrna reference library, respectively, was applied.
For the MMSDK analysis, the genomic locations used to assess methylation levels were annotated based on the
genomic information of the simulated BssHII reference library, and the methylation status of each BssHII site was used to represent the corresponding genomic region in which this BssHII site was located. The count of the tags representing a particularBssHII site is a measure of its degree of nonmethylation in the genome; that is, the smaller the tag count, the higher the level of methylation of the site in question. For the DGE analysis, the count of the tags represents the gene expression level; that is, the higher the tag count, the higher the expression level. After mapping and annotating the tags, the data were normalized by equalizing the total number of tags for all samples in MMSDK and DGE, respectively. The normal-ized data were used for the subsequent analysis.
Visualization of MMSDK and DGE data
Integrative Genomics Viewer was used to visualize the differences between individual tamoxifen-resistant cell lines and the parental tamoxifen-sensitive cell line MCF-7/S0.5 with regard to the MMSDK and DGE data [34]. Normalized MMSDK (total 51,918 genomic loci) and DGE tag (total 19,070 genes) features were used for visualization. The hg19 human genome was used as a reference [35]. We defined gene promoters as the re-gions located in the upstream 2 kb from transcript start-ing sites (TSSs) and the first exon. We adopted the same criteria (GC content >50%, ratio of the observed CpGs to the expected CpGs >0.6, length >200 bp) used by the UCSC Genome Browser for the definition of CGIs.
Principle component analysis and unsupervised cluster analysis
Qlucore Omics Explorer 2.3 software (Qlucore, Sweden, Lund) was used to perform principle component analysis. Normalized MMSDK (total 51,918 genomic loci) and DGE tag (total 19,070 genes) data were used as input data for principle component analyses without filtering. An un-supervised hierarchical clustering analysis was applied to analyze the similarities in MMSDK and DGE profiles across the five TAMR cell model lines using Qlucore Omics Explorer 2.3 software with a data filter requiring that the variance/maximum variance of variables across samples is higher than 0.001. A total of 17,561 genomic loci and 5,220 transcripts passed the filter for unsupervised cluster ana-lyses, respectively. The Pearson correlation algorithm was employed for similarity metric calculation. Average linkage clustering was chosen to organize samples in a tree structure.
Pathway and enrichment analysis
the MCF-7/S0.5 and TAMR cell lines were selected as input data in the first analysis. In the second analysis, only genes exhibiting altered gene expression and inverse altered methylation levels were included. In addition, an enrichment analysis using gene set enrichment analysis [36] to identify over-represented pathways and genes was performed on genes exhibiting >2-fold alterations in expression between MCF-7/S0.5 and TAMRcell lines.
Reduced representation of bisulfite sequencing
Gemomic DNA (5μg) from LCC1 and LCC2 was digested by theMspI restriction enzyme, (500 U/per sample; New England BioLabs) overnight at 37°C, and a Mini Purifica-tion kit (Qiagen) was used to purify the digested products. End repair was performed, adding A and adaptors, where the cytosines in the paired end adaptor sequence were methylated. The ligated product was subjected to size selec-tion in 2% agarose gel (Bio-RAD, Richmond, CA, USA) at 100 V for 2 hours. Agarose gel bands with 150 to 240 bp (according to insert DNA size 40 to 120 bp) and 240 to 340 bp (according to the ligated target DNA size 120 to 220 bp), for example, were excised and two libraries were generated from each sample (one consisting of 40 to 110 bp target sequences and the other of 110 to 220 bp target sequences). DNA from the two excised gel pieces was recovered by Gel Extraction Purification Kit (Qiagen), followed by bisulfite treatment using a EZ DNA Methylation-Gold kit (Zymo Research, Freiburg, Germany). The resulting converted DNA was amplified by PCR and, following purification, the reduced representation of bisul-fite sequencing (RRBS) libraries were generated by perform-ing paired-end 50-nucleotide sequencperform-ing with Hiseq 2000 (Illumina, San Diego, CA, USA). The adaptor sequences were filtered out from the subsequent analysis and the resulting reads were aligned using Bismark software [37]. Only uniquely mapped reads with restriction enzyme cut-ting sites at the 5′end were used for subsequent methyla-tion analyses. The sequencing depth and percentage of methylated cytosines/total investigated cytosines for each C location were calculated. The genomic annotation information was based on the hg19 human genome [35]. Gene promoters and CGI were defined using the same criteria as for the MMSDK analysis. According to the genomic annotation and coordinates, DNA methylation information between the TAMRcell line model (MMSDK data) and the LCC1/LCC2 cell line model (RRBS data) were compared.
Quantitative reverse transcriptase-PCR validation of gene expression
Quantitative reverse transcriptase-PCR was performed using the 2–ΔΔCt method [38]. Briefly, total RNA was extracted and subjected to DNase I (RNase-free) digestion (Life Biotechnologies, Paisley, UK) to exclude contamination
from genomic DNA. Subsequently, 1μg purified total RNA was reverse-transcribed in a final volume of 20μl containing 10 μl 2× reverse transcriptase buffer (dNTPs and MgCl2),
1 μl random hexamers (300 ng/μl) and 2 μl M-MuLV RNase H + reverse transcriptase (DyNAmo Capillary SYBR Green two-step quantitative reverse transcriptase-PCR kit; Finnzymes, Thermo Fisher Scientific, Slangerup , Denmark). cDNA synthesis was conducted by incubation at 25°C for 10 minutes (primer extension), 37°C for 30 minutes, 85°C for 5 minutes (reaction termination) and 4°C hold (sample cooling). Either β2-microglobulin or pumilio homolog 1
(PUM1) was used as the internal control for normalization of the data [38]. The SOX2 PCR primer sequence was obtained from Li and colleagues [39], while primers for PRKCA and PUM1 were purchased from Qiagen. The primer design for β2-microglobulin was performed using
Primer3 [40]. Both pairs of primer sequences were blasted against UCSC Genes in UCSC Genome Bioinformatics using the In-silico PCR tool to confirm the expected unique ampli-fication of SOX2 and β2-microglobulin genes, respectively.
The PCR primer sequences are available in Additional file 2. The quantitative PCR reaction was composed of 2× mas-ter mix, forward and reverse PCR primer and 0.5μl 10-fold diluted cDNA. The analysis was performed in triplicate using the LightCycler 480 system (Roche, Mannheim, Germany). A melting curve analysis was performed after PCR to confirm a single peak (unique amplification) for the PCR products, which were then run on a 2% electrophoresis agarose gel to further confirm the presence of a single band of the expected size. Accurate quantification was confirmed by generation of calibration curves by serial dilutions (native, 10-fold, 100-fold and 1,000-fold dilution) of one TAMR sam-ple and MCF-7/S0.5, which showed the same amplification efficiency of SOX2 and β2-microglobulin, respectively. The
threshold cycle (Ct) number at which the fluorescent signal is associated with an exponential increase of PCR products (by default) was used to calculate the normalized target. For each sample,Δ values were determined by subtracting the average of triplicate Ct values of the target gene (SOX2) from that of the reference gene (β2-microglobulin or
PUM1). The relative gene expression level of SOX2 and
PRKCA in each TAMR sample was normalized relative to the parental MCF-7/S0.5 cell line. The relative expression levels of the genes were determined by subtracting the aver-age of triplicate Ct values of the target genes (SOX2 and
PRKCA) from that of the reference genes (β2-microglobulin
orPUM1, respectively). Finally, the relative expression level (fold-change) of each TAMR sample compared with their parental cell line (MCF-7/S0.5) was determined using 2–ΔΔCt, in which:
ΔΔCt¼ Ctgene−Ctreference geneTAMR
Results
Visualization and integrative analysis
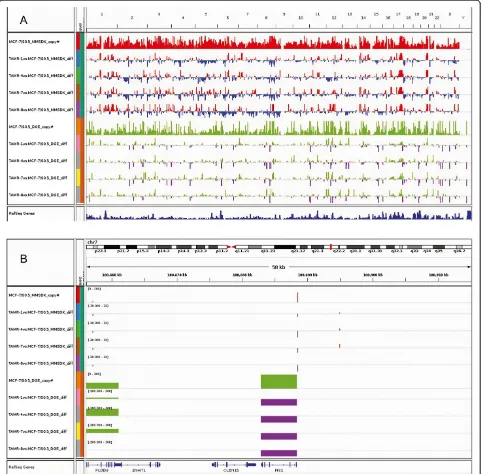
The MMSDK and DGE profiles of the parental cell line MCF-7/S0.5 and the four TAMR cell lines were initially compared and visualized by Integrative Genomics Viewer (Figure 1A), allowing a global view in a whole human gen-ome scale of the DNA methylation (MMSDK) and gene expression (DGE) values in MCF-7/S0.5 as well as alter-ations between cell lines. For example, detailed informa-tion on the differences in MMSDK and DGE in the region centered with FIS1gene on chromosome 7 is shown in Figure 1B.
Principal component analysis and unsupervised cluster analysis
Principle component analysis of the MMSDK data, which depicts all variables without any a priori classifi-cation and data filtering in the three-dimensional space, showed that MCF-7/S0.5 separated from the four TAMR cell lines, indicating overall differences in global DNA methylation profiles between parental and resistant cell lines (Figure 2A). The four TAMRcell lines also separated from each other, but to a lesser extent than from the parental cell line. Similarly, principle component ana-lysis of the DGE data demonstrated a clear separation of MCF-7/S0.5 from the four TAMR cell lines (Figure 2B). In unsupervised cluster analysis, MCF-7/S0.5 also sepa-rated from the four TAMR cell lines for both MMSDK (Figure 2C) and DGE (Figure 2D).
Overview of DNA methylation alterations between parental and tamoxifen-resistant sub-lines
DNA methylation analysis revealed that the four TAMR cell lines exhibited globally higher DNA methylation levels than MCF-7/S0.5. The distribution of the genomic loci in different genomic components (counting the number of tags from given components) is shown in Figure 3 and Additional file 3. The annotation of the genomic components is from UCSC. Notably, across all genomic components as well as in the global view, the four TAMRcell lines showed higher DNA methylation levels compared with their parental tamoxifen-sensitive cell line.
Genes exhibiting altered expression between parental and tamoxifen-resistant sub-lines in the TAMRcell line model
Initially, we investigated the expression levels of ESR1,
ESR2, PGR, IGF1R, PTEN, ERBB2 (HER2), PRKCAand
NOTCH3, which were previously implicated in tamoxi-fen resistance. There was no significant difference in the expression ofESR1, but slightly increased expression of
ESR2(2.3-fold) was observed. ERRB2 (3.8-fold),PRKCA (2.6-fold) andNOTCH3(6.9-fold) also exhibited increased expression in TAMR versus MCF-7/S0.5 cell lines, while
expression of PGR (−32.1-fold), IGF1R (−3.7-fold) and
PTEN(−10.2-fold) was decreased. Generally, these results using DGE tag sequencing were consistent with those of previous studies [11,41,42]. The slight difference in the ex-pression levels of ESR1 and ESR2 in the current study compared with previous studies could be due to differences in methodologies. Further investigation of key cell cycle genes such asMYCand CCND1 (cyclin D1) showed that
these genes remained highly expressed in all resistant sub-lines, but there was no significant difference (MYC 1.0-fold) and only slightly lower levels (CCND1 –1.8-fold change) in TAMRversus MCF-7/S0.5 cell lines.
Next, we investigated the expressed genes that exhib-ited >2-fold altered expression common for all TAMR cell lines versus MCF-7/S0.5 and identified 3,063 genes, of which 1,561 were expressed at higher levels (Additional file 4) and 1,502 at lower levels (Additional file 5) in TAMRcell lines versus MCF-7/S0.5.
Interestingly, several of the altered genes related to pluripotency and differentiation, including SOX2, which exhibited higher expression levels (74.8-fold) in TAMR cell lines versus MCF-7/S0.5 (Figure 4). The wholeSOX gene family was further studied and showed decreased ex-pression of SOX3 (−17.3-fold), SOX4 (−51.6-fold), SOX9 (−12.8-fold) and SOX13 (−54.3-fold) in TAMR cell lines versus MCF-7/S0.5 (Figure 4), while the remaining SOX genes were not expressed or exhibited very low expression in both TAMRcell lines and MCF-7/S0.5 (data not shown). We also observed alterations of the expression ofE2Fgene family, with decreased expression ofE2F1(−57.6-fold) and
E2F3 (−44.9-fold) and elevated expression of E2F2 (7.3-fold) in TAMRcell lines versus MCF-7/S0.5, while expres-sion of E2F4 was not significantly altered (1.6-fold). The expression levels of E2F1,E2F2 and E2F3 were consider-ably lower than E2F4in all cell lines. Since E2Finteracts with RB-related pocket proteins (p130 and p105), we also investigated the expression of these two pocket protein genes. RBL2 (p130) exhibited higher expression than
NFKB1(p105) in all cell lines. Further,RBL2andFOXA1 also showed higher expression (2.4-fold and 2.9-fold, re-spectively), while NFKB1 showed decreased expression (−3.2-fold) in TAMRcell lines versus MCF-7/S0.5. Taken together, altered expression of pluripotency and differenti-ation genes, including increased expression of SOX2, decreased expression of otherSOXgene families, and alter-ations of the expression ofE2Fgenes and pocket protein genes, may suggest a role for cancer-initiating cells/cancer stem-like cells in tamoxifen resistance.
Relationship between DNA methylation and gene expression in parental and tamoxifen-resistant sub-lines in the TAMRcell line model
groups based on gene expression levels: low (0 to 1 tag); intermediate (2 to 50 tags); and high (>50 tags). Accord-ingly, DNA methylation loci were also classified into four groups according to methylation levels: very high (0 to 1 tag); high (2 to 10 tags); intermediate (11 to 70 tags); and low (>71 tags).
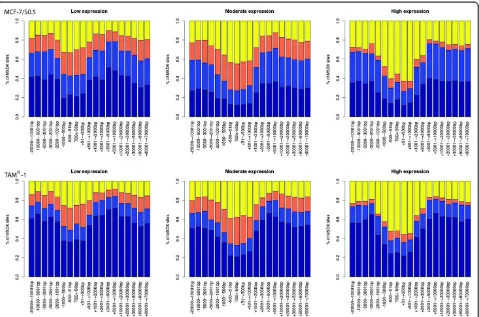
[image:7.595.58.541.90.564.2]Since the impact of DNA methylation on gene expression is known to depend on the genomic location relative to the TSS, plots were generated showing the global positional relationship between DNA methylation and gene expres-sion at different expresexpres-sion levels (Figure 5 and Additional file 6). The plots demonstrate a relationship between DNA
Figure 1Global landscape of the differences in modified DNA methylation-specific digital karyotyping and digital gene expression profiles for the parental MCF-7/S0.5 and the four TAMRcell lines as visualized by Integrative Genomics Viewer.Thexaxis shows the locations in the whole
human genome(A)and the region ofFIS1on chromosome 7(B). The height of the bars in modified DNA methylation-specific digital karyotyping
(MMSDK) for MCF-7/S0.5 (red) shows the extent of the number of tags representing the frequency of nonmethylated CpG islands at the particular locus.
The MMSDK data for the four TAMRcell lines is expressed as the difference in expression between a given TAMRand the parental cell line (red/blue).
The height of the bars in digital gene expression (DGE) for MCF-7/S0.5 (green) is proportional to the gene expression level. The DGE data for the four TAMR
methylation and distance to TSS locations, with the lowest DNA methylation level being at the TSS region across all gene expression levels. Comparing DNA methylation levels between the groups showed an inverse relationship be-tween gene expression and DNA methylation levels; that is, higher methylation levels were associated with lower gene expression levels. Second, we investigated in detail the rela-tionship between DNA methylation and gene expression in
individual genes of interest. Figure 4 shows plots of mRNA expression, DNA methylation and genomic location for genes of interest, including theSOXgene family (Figure 4).
[image:8.595.55.540.86.576.2]A panel of 44 genes were found to exhibit higher pro-moter CGI DNA methylation (twofold change) in TAMR cell lines versus MCF-7/S0.5 cells, with concurrent lower gene expression (twofold change) in TAMRcell lines versus MCF-7/S0.5. Among these genes,NRIP1, HECAand FIS1
Figure 2Principle component analysis and unsupervised cluster analysis for DNA methylation and gene expression data in TAMRand MCF-7/S0.5 cell lines.Principle component analysis results for modified DNA methylation-specific digital karyotyping (MMSDK)(A)and digital
gene expression (DGE)(B)data show that the TAMRcell lines grouped separately from the parental MCF-7/S0.5 cell line. The unsupervised cluster
were of particular interest since they have previously been reported to be associated with breast cancer pathogenesis. Another set of 18 genes exhibited lower promoter CGI DNA methylation (twofold change) in TAMR cell lines versus MCF-7/S0.5 cells, with concurrent higher gene expression (twofold change) in TAMR cell lines versus MCF-7/S0.5. The DNA methylation state of promoters with and without CGIs for the genes that exhibited altered expression in TAMRcell lines versus MCF7/S0.5 is listed in Additional files 7 and 8.
Pathway analysis
To further elucidate the pathways affected in connection with tamoxifen resistance in breast cancer, we performed pathway analysis of genes exhibiting altered methylation of promoter sites in TAMRversus MCF-7/S0.5 cells and con-current inverse alteration of gene expression levels using the Ingenuity Pathway Analysis software (Ingenuity Systems, Redwood City, CA, USA). Among the genes with significant DNA methylation loci, we observed significant enrichment of genes associated with cell cycle, cellular growth and
proliferation, including FOS, LMNA, RUNX1, SLC9A3R1,
SNTB2, STAT5B, SUZ12, UGCG, VEGFA, AK4, NCOA6,
NCOR2,SOX4,EPB41L1,EHD1andSNTB2. This suggests an important role in tamoxifen resistance of epigenetic alter-ation of genes involved in growth and proliferalter-ation of cancer cells. Similarly, analysis of differentially expressed genes identified by mRNA sequencing showed significant enrich-ment of genes associated with cell cycle, cellular assembly and organization, DNA replication, cell survival and death as well as cell proliferation. These genes included BACE1,
CADM1, CCNA2, CDC42SE1, CDKN2C, CDKN3, CDT1,
CENPE,CKS2,COL7A1, CTGF, DAAM1, ERBB2, ERRFI1,
GLO1, LAMP2, MKI67,MLXIP, MYBL1, MYBL2,MYO10,
NEK2, OSMR, POLE2, PRC1, RAB31, RAD51AP1, RALB,
RHOD,SOLH,SOX4,TGFB1,THBS1,WNT5BandZWINT. The canonical pathways with significant gene enrichment included the RAR activation and the DNA damage response pathways. In addition, pathways such as Notch, Wnt/
[image:9.595.57.541.91.389.2]β-catenin and transforming growth factor beta signaling, which are known for extensive cross-talk and are implicated in stemness, were shown to be associated with genes that
Figure 3Distribution of DNA methylation levels of different genomic components in MCF-7/S0.5 versus TAMRcell lines.MCF-7/S0.5
shows low DNA methylation levels compared with TAMRcell lines in both the global profile and the different genomic components (CpG island
(CGI), CGI shore, gene, promoter and exon). Thexaxis shows the color-coded methylation states of CpGs for the MCF-7/S0.5, TAMR-1, TAMR-4,
TAMR-7 and TAMR-8 cell lines. The mean methylation state of CpGs is categorized into very high (grey, 0 to 1 tag), high (blue, 2 to 10 tags), intermediate
(orange, 11 to 100 tags), and low (yellow >100 tags). Theyaxis shows the proportion of CpGs covered by methylation scores at low, intermediate, or
showed differential expression patterns between TAMRand MCF-7/S0.5 cells. Finally, gene set enrichment analysis of our expression data demonstrated enrichment of the pluripo-tency and differentiation processes, as well as the E2F family (Additional file 9). E2F1, E2F2, F2F3, RBL2 (p130) and
NFKB1 (p105) were enriched in the gene sets of KEGG_ PANCREATIC CANCER and KEGG_CELL_CYCLE using the gene set enrichment analysis database. SOX3 and SOX4 were enriched in the gene set MASSARWEH_TAMOXIFEN_ RESISTANCE_DN.
Validation of methylation, gene expression and pathway alterations in the LCC1/LCC2 cell line model
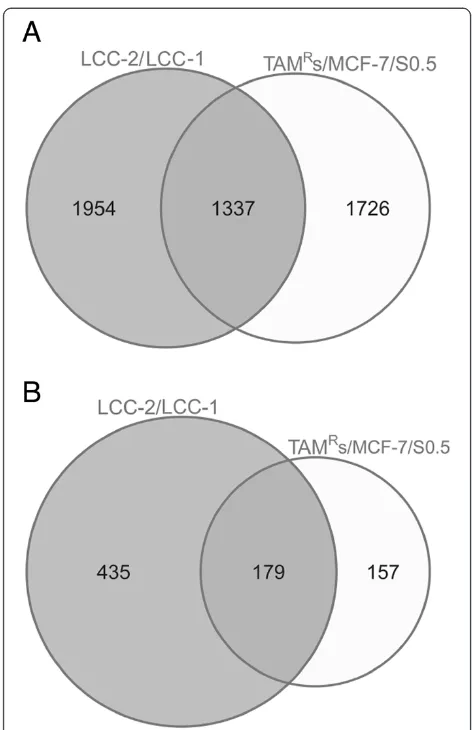
To ensure that the alterations observed in TAMRcell lines versus MCF-7/S0.5 cells were not unique to this specific cell line model, we examined whether the methylation, gene expression and pathway alterations associated with TAMR could be observed in another tamoxifen-resistant cell line model, LCC1/LCC2. DNA methylation analysis of LCC1 and LCC2 was performed by RRBS, and the results were
compared with the DNA methylation profile of TAMR ac-cording to genomic coordinates. The two cell line models, in general, exhibited global inherited DNA methylation profiles, reflecting their biological origins. In addition, the two cell line models shared several DNA methylation alter-ations. Further, many genes that exhibited altered gene ex-pression in the TAMRcell line model inversely correlated with DNA methylation and were also identified in the LCC1/LCC2 cell line model (Figure 6 and Additional files 10 and 11). Some important genes, such asPGR,CCND1,
MYC,PTEN,SOX4,SOX13andTGFβ1, and pathways such as transforming growth factor beta signaling that are impli-cated in tamoxifen resistance in the TAMRcell line model were also identified in the LCC1/LCC2 cell line model.
Validation of SOX2 and PRKCA gene expression
The higher gene expression levels ofSOX2andPRKCAin TAMRcell lines versus MCF-7/S0.5 obtained by sequencing were further evaluated by quantitative reverse transcriptase-PCR and confirmed that the relative expression of
SOX2 0 20 40 60 80 100 120 140 DGE cop y n umber MCF−7/S0.5 TAM R−1 TAM R−4 TAM R−7 TAM R−8 −10000 0
10000 20000 30000 0
5 10 15 20
Distance to TSS
MMSDK cop y n umber SOX2 SOX3 0 20 40 60 80 DGE cop y n umber MCF−7/S0.5 TAM R−1 TAM R−4 TAM R−7 TAM
R−8 0
20000 40000 60000 0 100 200 300 400 500
Distance to TSS
MMSDK cop y n umber SOX3 SOX4 0 50 100 150 200 DGE cop y n umber MCF−7/S0.5 TAM R−1 TAM R−4 TAM R−7 TAM R−8
−6000 −4000 −2000
0 2000 0 100 200 300 400 500
Distance to TSS
MMSDK cop y n umber SOX4 SOX9 0 20 40 60 80 100 DGE cop y n umber MCF−7/S0.5 TAM R−1 TAM R−4 TAM R−7 TAM R−8
−10000 −8000 −6000 −4000 −2000
0 2000 0 50 100 150 200 250 300
Distance to TSS
MMSDK cop y n umber SOX9 SOX13 0 10 20 30 40 50 60 DGE cop y n umber MCF−7/S0.5 TAM R−1 TAM R−4 TAM R−7 TAM R−8
−20000 −15000 −10000 −5000
0 0 20 40 60 80
Distance to TSS
MMSDK cop y n umber SOX13 RBL2 0 50 100 150 200 250 300 DGE cop y n umber MCF−7/S0.5 TAM R−1 TAM R−4 TAM R−7 TAM R−8
−12000 −10000 −8000 −6000 −4000 −2000
0
0 50 100 150
Distance to TSS
MMSDK cop y n umber RBL2 E2F1 0 5 10 15 20 25 30 DGE cop y n umber MCF−7/S0.5 TAM R−1 TAM R−4 TAM R−7 TAM R−8 −10000 −5000 0
5000 10000 15000 20000 0
200 400 600 800
Distance to TSS
MMSDK cop y n u mber E2F1 E2F2 0 10 20 30 40 DGE cop y n umber MCF−7/S0.5 TAM R−1 TAM R−4 TAM R−7 TAM R−8 0
5000 10000 15000 20000 25000 0
50 100 150
Distance to TSS
MMSDK cop y n u mber E2F2 E2F3 0 50 100 150 200 DGE cop y n umber MCF−7/S0.5 TAM R−1 TAM R−4 TAM R−7 TAM R−8 −1000 0
1000 2000 3000 0
50 100 150
Distance to TSS
MMSDK cop y n u mber E2F3 NFKB1 0 20 40 60 80 100 DGE cop y n umber MCF−7/S0.5 TAM R−1 TAM R−4 TAM R−7 TAM
R−8 0
10000 20000 30000 40000 50000 0 10 20 30 40 50 60 70
Distance to TSS
[image:10.595.57.541.90.433.2]MMSDK cop y n u mber NFKB1 Sample MCF−7/S0.5 TAMR−1 TAMR−4 TAMR−7 TAMR−8
bothSOX2andPRKCAin all four TAMRcell lines was sig-nificantly higher than in MCF-7/S0.5 (Figure 7). The expression level ofSOX2was particularly high in TAMR-8.
Discussion
Tamoxifen has a great impact on clinical management of breast cancer; however, about one-third of early-stage breast cancer patients eventually experience disease recur-rence and subsequent mortality [7]. Resistance to tamoxifen is thus a major clinical issue and considerable efforts have been made to elucidate the mechanisms leading to this re-sistance, including decrease or loss of ERαexpression that could result from mutations of the ESR1 gene, and/or hypermethylation of the ESR1 gene promoter, altered expression of ERβprotein, endocrine adaptation, pharma-cologic tolerance (for example, increased metabolism of tamoxifen to agonistic metabolites), altered patterns of co-regulator (co-activator and co-repressor) expression, cross-talk between ERαand growth factor signaling pathway, or influence of the phosphoinositide 3-kinase cell survival pathway and interaction between ER protein with the
stress-activated protein kinase/c-junNH2 terminal kinase pathway [6,7].
[image:11.595.60.539.88.405.2]Several distinct mechanisms may lead to tamoxifen resist-ance, and within individual tumors different cancer cells may use different mechanisms, complicating evaluation of tamoxifen resistance mechanisms in whole tumor samples. To simplify the matter, we used a cell line model wherein ER-positive MCF-7/S0.5 cells were exposed to high-dose tamoxifen resulting in tamoxifen-resistant TAMRcell lines. Our TAMR cell lines seem to mimic the clinical situation wherein tumors are exposed to high doses of tamoxifen that eradicate the majority of cells, but a few cells may sur-vival and lead to relapse and therapy failure. In addition, an independent tamoxifen-resistant cell line model (LCC1/ LCC2), which mimics another clinical situation wherein tumors are exposed initially to insufficient dosages of tam-oxifen, was used to verify the finding in the TAMRcell line model. Our next-generation sequencing of mRNA from both cell line models revealed that many genes associated with cancer stem cells exhibit altered expression in resistant versus parental cell lines. Increasing evidence supports the hypothesis that these resistant cells arise from putative
Figure 5Relationship between DNA methylation and gene expression in MCF-7/S0.5 and TAMR1.An inverse relationship between DNA
methylation and gene expression levels is noted. The expressed genes are grouped according to expression levels: low (left), moderate (middle)
and high (right). Dark blue, light blue, orange and yellow present extreme-high, high, medium and low DNA methylation levels. Thexaxis shows
cancer-initiating cells or cancer stem-like cells. For ex-ample, tamoxifen treatment in combination with targeted cancer stem cell inhibition achieves a better outcome than tamoxifen treatment alone, indicating that surviving cancer stem-like cells may remain viable after initial endocrine therapy [24].In situobservations have identified candidate cells with stem cell-like features of various phenotypes in breast cancer samples [24], and it has been suggested that such cells may be responsible for therapeutic failures [43-45].
In our study, we found high expression ofSOX2 in the TAMRcell lines.SOX2is a transcription factor essential for maintaining self-renewal of undifferentiated normal embry-onic stem cells, and also plays an important role in cancer
development and recurrence [46]. In addition, SOX2 is one of the four factors that, by induction, can induce pluri-potent stem cells from mouse embryonic or adult fibroblasts [47]. In fact, the expression of theSOX2gene in itself could be responsible for stem cell properties [46].
SOX2has been shown to be expressed in early-stage breast tumors, while expression of other normal stem cell markers, such as OCT4 or NANOG, was not observed. Furthermore, the expression of SOX2, but not OCT4 or
NANOG, induced mammosphere formation in cultures, underscoring the possibility that increased expression of
SOX2 is sufficient to induce cancer stem cell properties [46]. Interestingly, a recent study showed that TAMRcells exhibited increased mammosphere-forming capability com-pared with MCF-7/S0.5 cells (8% vs. 3%) [48]. Additionally, the promoting role of SOX2 in cell proliferation mediated throughCCND1(cyclin D1) has been demonstrated by
gain-of-function and loss-gain-of-function experiments using MCF-7 cells [48]. The positive correlation of the co-expression of
SOX2 and CCND1 with tumorigenesis has also been demonstrated in clinical breast cancer samples [49].
In contrast toSOX2, several other members of theSOX family (SOX3,SOX4,SOX9andSOX13) showed decreased expression in the resistant versus parental cell lines. These SOX gene family members play important roles in differentiation and tissue maturation [50], and have also been implicated in regulating β-catenin activity [51-54]. Since the majority ofSOXgenes negatively regulate Wnt/
β-catenin signaling, their expression (in contrast toSOX2 [55]) could suppress the activity of cyclin D1. Decreased
expression of these genes could thus attenuate their suppressing effect on proliferation. Taken together, SOX2 and the otherSOXfamily members activate the expression ofMYCandCCND1, perhaps bypassing the blocked ER-mediated mitogenesis by which cancer cell proliferation can be maintained.
We also identified alterations in the expression of the
E2Fgene family, which strengthens the association of stem-ness features with the development of tamoxifen resistance. The E2F gene family of transcription factors provides important downstream effector functions in a pathway that controls the expression of genes involved in cell cycle pro-gression, G1/S transition and DNA replication [56]. Becker
and colleagues demonstrated that human stem cells differ from somatic cells in the expression of members of theE2F family and RB-related pocket proteins [57]. They reported that human stem cells and teratocarcinoma cells show a se-lective reduction in the expression ofE2F1,E2F2,E2F3and p105 (encoded by NFKB1) and enhanced expression of
[image:12.595.55.291.86.451.2]E2F4,E2F5,E2F6and p130 (encoded byRBL2) compared with human normal somatic IMR90 cells [57]. In our study, decreased expression ofE2F1 E2F3andNFKB1(p105) and increased expression ofRBL2 (p130) was observed in the tamoxifen-resistant versus parental cell lines. Moreover,
Figure 6Overlap between methylation and gene expression alterations in the TAMRand LCC cell line models. (A)Venn diagram showing the overlapping number of genes that exhibited altered
expression (twofold change) in both the TAMRversus MCF-7/S0.5 and
the LCC2 versus LCC1 cell line models.(B)Venn diagram showing the
overlapping number of genes that exhibit altered promoter CpG island (CGI) DNA methylation (twofold change) and concurrent
inversely altered gene expression (twofold change) in both the TAMR
RBL2(p130) showed higher expression levels thanNFKB1 (p105), and E2F4 showed higher expression levels than
E2F1,E2F2andE2F3in all five cell lines. This observation further supports the role of cancer-initiating cells/cancer stem-like cells in the development of resistance to tamoxi-fen treatment.
NOTCH3, which has been shown to play a role in main-tenance of stemness in breast cancer cells, was also more highly expressed in the tamoxifen-resistant versus parental cell lines. NOTCH3 has been shown to be upregulated when normal breast tissue is grown as mammospheres [58], and downregulation of NOTCH3 by short hairpin RNA interference in MCF-7 cells reduced the capacity of
first-generation mammospheres to produce a second gen-eration [59].NOTCH3 was also found to be upregulated in CD44+ populations of normal cells and breast cancer cells [60].
[image:13.595.64.538.88.531.2]In addition to gene expression alterations, we also deter-mined DNA methylation levels in the resistant and parental cell lines using MMSDK. In a global view, our data show that high DNA methylation in the neighborhood of tran-scription start sites correlated with lower gene expression. A large panel of genes was found to exhibit higher promoter CGI DNA methylation in the resistant versus parental cells and concurrent lower gene expression in the resistant versus parental cells. Among these genes,NRIP1,
Figure 7Relative expression ofSOX2andPRKCAin the MCF-7/S0.5 and TAMRcell lines.Comparison of the relative expression ofSOX2and
HECA and FIS1 were of particular interest because they have previously been reported to be associated with breast cancer pathogenesis [61-63], and further studies of these genes will be pursued. Our results differ somewhat from those of an earlier study that examined the gene expression and methylation status of a single tamoxifen cell line [22]. For example, Fan and colleagues found that their tamoxifen-resistant cell line was associated predominantly with global promoter hypomethylation relative to the parental line [22], while, in contrast, we observed global hypermethylation of all four tamoxifen-resistant versus parental cell lines. However, one should note that the tamoxifen-resistant cell line generated by Fan and col-leagues [22] was derived from a different strategy than our four tamoxifen-resistant cell lines, and the technology used to analyze gene and methylation levels also differed (array vs. sequencing).
DGE, as used in our study to investigate gene expression, is a common method that exhibits high fidelity. DGE captures the sequence from the 3′ end of transcripts, thereby avoiding involvement of complex statistical model to address isoform splicing events for estimating gene expression. MMSDK, as we used to examine the DNA methylation profiles, is also a reliable method as shown in an earlier study where the results identified by MMSDK could be validated by quantitative PCR-based and bisulfite clone sequencing [25]. In addition, to avoid putative
influence of PCR amplification bias, PCR amplification was limited to a maximum of 18 cycles.
[image:14.595.55.540.429.663.2]In our study, not all genes exhibiting altered gene expres-sion also exhibited corresponding promoter methylation changes, perhaps due to the resolution of the MMSDK method that did not identify all methylation alterations. For some individual genes, the MMSDK sampling locations (BssHII recognition sites) are still limited. ManySOXfamily genes and E2F family genes have no BssHII site in their promoter and enhancer regions, limiting our analysis of methylation alterations in these genes. In addition, for many genes more than one methylation site was examined, some of which exhibited altered expression while others did not. It is not currently known which of the sites are of functional importance. Finally, some genes of interest in our study, such asSOX2, did not show any impact of DNA methylation on gene expression (according toBssHII recog-nition sites on its promoter region), which does not exclude the possibility of the impact of DNA methylation status of othercis-regulatory element(s) on the expression ofSOX2. Further studies are needed to confirm this hypothesis. Notably, FOXA1, a pioneer factor in development and differentiation [64,65], has been suggested to interact with hormonal receptors (ER and androgen receptor) and play a role in breast cancer and prostate cancer, and even in tamoxifen resistance [66-69]. Our results suggest an associ-ation between reprogramming transcription, epigenetic
Figure 8A possible mechanism implicated in tamoxifen resistance in the TAMRcell line model.While tamoxifen competitively binds with
estrogen receptor (ER) and prevents binding between estradiol and ER, thereby blocking estrogen mitogenetic activity,CCND1(cyclin D1) expression
remains high due to direct activation mediated bySOX2and/or by the Wnt/β-catenin pathway through attenuation of the suppression effect of other
SOXgene family members on this pathway. Transforming growth factor beta (TGFβ) and Notch pathways are also implicated in activation ofCCND1
(cyclin D1). Cyclin D1interacts with pocket proteins (Rb, P105 and P130) and abrogates their suppressive effect onE2F. Finally, activated E2F accomplishes
plasticity and tamoxifen resistance. The precise mechanism and profound role of this gene require further investigation.
Conclusion
High expression ofSOX2and suppression of otherSOX gene family members in combination with usage of the
E2F gene family, RB-related pocket protein genes and highlighted stem-like cell-associated pathways implies that cancer-initiating cells/stem-like cells may be crucial for development of resistance to tamoxifen (Figure 8). Large differences in global gene expression and DNA methylation profiles between the parental MCF-7 tamoxifen-sensitive human breast cancer cell line and its high-dosage tamoxifen-selected resistant subpopula-tions were observed. In general, DNA methylation in promoter regions is shown to be associated with repres-sion of gene expresrepres-sion, which also holds true for some genes previously associated with breast cancer develop-ment. Thus, although tumor-initiating cells/stem-like cells may be of primary importance, these cells might acquire survival advantage in gene expression via epigenetic mechanisms. However, it is difficult to prove this hypothesis because even the stemness-associated genes can be regulated by epigenetic changes and the present techniques do not allow the DNA methylation status of tamoxifen-selected resistant cells at the single cell level to determined (each sub-line TAMRwas devel-oped from such single surviving cells). In this study, biological replicates were not sequenced. Although the results of DNA methylation and gene expression from the four individual tamoxifen-resistant TAMRcell lines were highly consistent, further analysis using ap-proaches with higher coverage, such as RRBS and RNA Seq, may confirm our findings.
Our results underscore the likelihood of stem cell-like re-sistant cells in tamoxifen resistance. The present study shows some evidence of stemness and cell plasticity in tamoxifen-resistant cells and poses a new hypothesis link-ing cell fate plasticity, epigenetic programmlink-ing, and pos-sible induced pluripotency processes with tamoxifen resistance. To prove our hypothesis and deepen under-standing of the mechanism of drug resistance more infor-mation from genomic, epigenomic and transcriptomic analyses will be required, as well as deciphering cross-talk between these mechanisms in cancer cells.
Additional files
Additional file 1:Presents a description and illustration of the MMSDK method.
Additional file 2:Lists the sequence of adaptors and primers used in this study.
Additional file 3:Is a figure showing the distribution of DNA methylation levels of various genomic components in MCF-7/S0.5
versus TAMR cell lines.MCF-7/S0.5 shows low DNA methylation levels compared with TAMR cell lines in the different genomic components (intron, LTR (long terminal repeat), SINE (short interspersed elements),
LINE (long interspersed elements), LINE1, LINE2, and satellite). Thexaxis shows
the color-coded methylation states of CpGs for the MCF-7/S0.5, TAMR-1, TAMR-4, TAMR-7 and TAMR-8 cell lines. The mean methylation state of CpGs is categorized into very high (gray, 0 to 1 tag), high (blue, 2 to 10 tags),
intermediate (orange, 11 to 100 tags), and low (yellow >100 tags).yaxis shows
the proportion of CpGs covered by methylation scores at low, intermediate, or high levels. Coordinates for genomic features were taken from the UCSC genome database and LINEs are defined by RepeatMasker.
Additional file 4:Is a table listing the genes exhibiting higher expression (>2-fold) in TAMRcell lines versus MCF-7/S0.5.To avoid
the influence of large variance in low-expressed genes, expression levels <10 tags have been binned to 10 tags.
Additional file 5:Is a table listing the genes exhibiting lower expression (≤2-fold change) in TAMRcell lines versus MCF-7/S0.5.
To avoid the influence of large variance in low-expressed genes, expression levels <10 tags have been binned to 10 tags.
Additional file 6:Is a figure showing the relationship between DNA methylation and gene expression in TAMR-4, TAMR-7 and TAMR-8.
An inverse relationship between DNA methylation and gene expression levels is noted. The expressed genes are grouped according to expression levels: low (left), moderate (middle) and high (right). Dark blue, light blue, orange and yellow represent extreme-high, high,
medium and low DNA methylation levels, respectively. Thexaxis shows
the genomic location relative to the TSS. Theyaxis shows the percentage
of methylation for a given genomic location.
Additional file 7:Is a table listing the genes exhibiting lower expression (≤2-fold change) and concurrent higher DNA methylation (≤2-fold change in MMSDK data) in the promoter CGI region in TAMR cell lines versus MCF-7/S0.5.
Additional file 8:Is a table listing the genes exhibiting higher expression (>2-fold change) and concurrent lower DNA methylation (>2-fold change in MMSDK data) in the promoter CGI region in TAMRcell lines versus MCF-7/S0.5.
Additional file 9:Is a table listing the gene set enrichment analysis identifying over-represented pathways.
Additional file 10:Is a table listing the genes exhibiting altered expression (upregulated or down regulated, absolute value >2-fold change) in both the TAMRversus MCF-7/S0.5 and the LCC2 versus LCC1 cell line models.
Additional file 11:Is a table listing the genes exhibiting altered expression (upregulated and down regulated, absolute value >2-fold change) and concurrent inversely altered DNA methylation in the promoter region in both the TAMRversus MCF-7/S0.5 and the LCC2 versus LCC1 cell line models.
Abbreviations
bp:Base pair; CGI: CpG island; Ct: Threshold cycle; DGE: Digital gene expression;
ER: Estrogen receptor; FCS: Fetal calf serum; MMSDK: Modified DNA methylation-specific digital karyotyping; PCR: Polymerase chain reaction; RRBS: Reduced
representation of bisulfite sequencing; TAMR: Tamoxifen-resistant cell line model;
TSS: Transcript starting site; UCSC: University of California, Santa Cruz.
Competing interests
The authors declare that they have no competing interests.
Authors’contributions
XL and JL were involved in the planning and design of the study, performed the experimental work, sequencing data analysis and statistical analysis, and drafted the manuscript. GY and QZ assisted in the MMSDK analysis and contributed to the manuscript. DE was involved in DNA and RNA isolation, quantitative PCR analysis
and critically revised the manuscript. AEL provided the tamoxifen-resistant TAMRcell
manuscript. LB and HJD were involved in the planning and design of the study, supervised the study and contributed to the writing and revision of the manuscript. All authors approved the manuscript for publication and have agreed to be accountable for all aspects of the work.
Acknowledgements
This study was supported by the Sino-Danish Breast Cancer Research Centre, financed by the Danish National Research Foundation (Grundforskningsfonden) and the National Natural Science Foundation of China (30890032, 31161130357). Further support was obtained from the Chinese 863 Program (2012AA02A201, 2012AA02A502), the Guangdong Innovative Research Team Program (2009010016), the Danish Cancer Society, the Danish Research Council, the Danish Center for Translational Breast Cancer Research and A Race Against Breast Cancer. The authors thank MK Occhipinti-Bender for editorial assistance.
Author details
1
Sino-Danish Breast Cancer Research Centre, Copenhagen, Denmark.
2Department of Biomedicine, University of Aarhus, Bartholins Allé 6, DK-8000
Aarhus, Denmark.3BGI-Shenzhen, Beishan Industrial Zone, Yantian District, Shenzhen 518083, China.4Department of Cancer and Inflammation Research,
Institute of Molecular Medicine, University of Southern Denmark, J. B. Winsloews Vej 25.3, DK-5000 Odense, Denmark.5School of Life Science and
Technology, Tongji University, 1239 Siping Road, Shanghai 200092, China.
6Danish Cancer Society Research Center, Strandboulevarden 49, DK-2100
Copenhagen, Denmark.7Department of Veterinary Disease Biology, Faculty of Health and Medical Sciences, University of Copenhagen,
Strandboulevarden 49, DK-2100 Copenhagen, Denmark.8James D. Watson Institute of Genome Sciences, Hangzhou, China.9Department of Oncology,
Odense University Hospital, Søndre Boulevard 29, DK-5000 Odense, Denmark.
Received: 13 May 2013 Accepted: 2 December 2013 Published: 19 December 2013
References
1. Clark GM, Osborne CK, McGuire WL:Correlations between estrogen
receptor, progesterone receptor, and patient characteristics in human breast cancer.J Clin Oncol1984,2:1102–1109.
2. Talman ML, Rasmussen BB, Andersen J, Christensen IJ:Estrogen receptor
analyses in the Danish Breast Cancer Cooperative Group. History,
methods, prognosis and clinical implications.Acta Oncol2008,
47:789–794.
3. Jordan VC, O’Malley BW:Selective estrogen-receptor modulators
and antihormonal resistance in breast cancer.J Clin Oncol2007,
25:5815–5824.
4. Clarke R, Liu MC, Bouker KB, Gu Z, Lee RY, Zhu Y, Skaar TC, Gomez B,
O’Brien K, Wang Y, Hilakivi-Clarke LA:Antiestrogen resistance in breast
cancer and the role of estrogen receptor signaling.Oncogene2003,
22:7316–7339.
5. Early Breast Cancer Trialists’Collaborative Group, Davies C, Godwin J, Gray R,
Clarke M, Cutter D, Darby S, McGale P, Pan HC, Taylor C, Wang YC, Dowsett M,
Ingle J, Peto R:Relevance of breast cancer hormone receptors and other
factors to the efficacy of adjuvant tamoxifen: patient-level meta-analysis of randomised trials.Lancet2011,378:771–784.
6. Musgrove EA, Sutherland RL:Biological determinants of endocrine
resistance in breast cancer.Nat Rev Cancer2009,9:631–643.
7. Ring A, Dowsett M:Mechanisms of tamoxifen resistance.Endocr Relat
Cancer2004,11:643–658.
8. Osborne CK, Schiff R:Mechanisms of endocrine resistance in breast
cancer.Annu Rev Med2011,62:233–247.
9. Soule HD, Vazguez J, Long A, Albert S, Brennan M:A human cell line from
a pleural effusion derived from a breast carcinoma.J Natl Cancer Inst
1973,51:1409–1416.
10. Lippman M, Bolan G, Huff K:The effects of estrogens and antiestrogens
on hormone-responsive human breast cancer in long-term tissue culture.
Cancer Res1976,36:4595–4601.
11. Lykkesfeldt AE, Madsen MW, Briand P:Altered expression of estrogen-regulated
genes in a tamoxifen-resistant and ICI 164,384 and ICI 182,780
sensitive human breast cancer cell line, MCF-7/TAMR-1.Cancer Res
1994,54:1587–1595.
12. Madsen MW, Reiter BE, Larsen SS, Briand P, Lykkesfeldt AE:Estrogen receptor
messenger RNA splice variants are not involved in antiestrogen resistance in sublines of MCF-7 human breast cancer cells.Cancer Res1997,57:585–589.
13. Frogne T, Jepsen JS, Larsen SS, Fog CK, Brockdorff BL, Lykkesfeldt AE:
Antiestrogen-resistant human breast cancer cells require activated protein kinase B/Akt for growth.Endocr Relat Cancer2005,12:599–614.
14. Nabha SM, Glaros S, Hong M, Lykkesfeldt AE, Schiff R, Osborne K, Reddy KB:
Upregulation of PKC-delta contributes to antiestrogen resistance in mammary tumor cells.Oncogene2005,24:3166–3176.
15. Pancholi S, Lykkesfeldt AE, Hilmi C, Banerjee S, Leary A, Drury S, Johnston S,
Dowsett M, Martin LA:ERBB2 influences the subcellular localization
of the estrogen receptor in tamoxifen-resistant MCF-7 cells leading
to the activation of AKT and RPS6KA2.Endocr Relat Cancer2008,
15:985–1002.
16. Perez-Tenorio G, Stal O, Southeast Sweden Breast Cancer G:Activation of
AKT/PKB in breast cancer predicts a worse outcome among endocrine treated patients.Br J Cancer2002,86:540–545.
17. Rasmussen BB, Regan MM, Lykkesfeldt AE, Dell’Orto P, Del Curto B,
Henriksen KL, Mastropasqua MG, Price KN, Mery E, Lacroix-Triki M, Braye S, Altermatt HJ, Gelber RD, Castiglione-Gertsch M, Goldhirsch A,
Gusterson BA, Thürlimann B, Coates AS, Viale G, BIG 1–98 Collaborative
and International Breast Cancer Study Groups:Adjuvant letrozole versus
tamoxifen according to centrally-assessed ERBB2 status for postmenopausal women with endocrine-responsive early breast cancer: supplementary results from the BIG 1–98 randomised trial.Lancet Oncol2008, 9:23–28.
18. Frogne T, Laenkholm AV, Lyng MB, Henriksen KL, Lykkesfeldt AE:Determination
of HER2 phosphorylation at tyrosine 1221/1222 improves prediction of poor survival for breast cancer patients with hormone receptor-positive tumors.
Breast Cancer Res2009,11:R11.
19. Brunner N, Frandsen TL, Holst-Hansen C, Bei M, Thompson EW, Wakeling AE,
Lippman ME, Clarke R:MCF7/LCC2: a 4-hydroxytamoxifen resistant human
breast cancer variant that retains sensitivity to the steroidal antiestrogen ICI 182,780.Cancer Res1993,53:3229–3232.
20. Bernstein BE, Meissner A, Lander ES:The mammalian epigenome.Cell2007,
128:669–681.
21. Heyn H, Esteller M:DNA methylation profiling in the clinic: applications
and challenges.Nat Rev Genet2012,13:679–692.
22. Fan M, Yan PS, Hartman-Frey C, Chen L, Paik H, Oyer SL, Salisbury JD, Cheng AS,
Li L, Abbosh PH, Huang TH, Nephew KP:Diverse gene expression and DNA
methylation profiles correlate with differential adaptation of breast cancer cells to the antiestrogens tamoxifen and fulvestrant.Cancer Res2006, 66:11954–11966.
23. van Agthoven T, van Agthoven TL, Dekker A, Foekens JA, Dorssers LC:
Induction of estrogen independence of ZR-75-1 human breast cancer cells by epigenetic alterations.Mol Endocrinol1994,8:1474–1483.
24. Dean M, Fojo T, Bates S:Tumour stem cells and drug resistance.Nat Rev
Cancer2005,5:275–284.
25. Li J, Gao F, Li N, Li S, Yin G, Tian G, Jia S, Wang K, Zhang X, Yang H, Nielsen AL,
Bolund L:An improved method for genome wide DNA methylation profiling
correlated to transcription and genomic instability in two breast cancer cell lines.BMC Genomics2009,10:223.
26. Briand P, Lykkesfeldt AE:Long-term cultivation of a human breast cancer
cell line, MCF-7, in a chemically defined medium. Effect of estradiol.
Anticancer Res1986,6:85–90.
27. Lykkesfeldt AE, Briand P:Indirect mechanism of oestradiol stimulation of cell
proliferation of human breast cancer cell lines.Br J Cancer1986,53:29–35.
28. Thrane S, Lykkesfeldt AE, Larsen MS, Sorensen BS, Yde CW:Estrogen
receptorαis the major driving factor for growth in tamoxifen-resistant breast cancer and supported by HER/ERK signaling.Breast Cancer Res Treat2013,139:71–80.
29. Clarke R, Brunner N, Katzenellenbogen BS, Thompson EW, Norman MJ, Koppi C,
Paik S, Lippman ME, Dickson RB:Progression of human breast cancer cells
from hormone-dependent to hormone-independent growth both in vitro and in vivo.Proc Natl Acad Sci U S A1989,86:3649–3653.
30. Brunner N, Boulay V, Fojo A, Freter CE, Lippman ME, Clarke R:Acquisition of
hormone-independent growth in MCF-7 cells is accompanied by increased expression of estrogen-regulated genes but without detectable DNA amplifications.Cancer Res1993,53:283–290.
31. Tempel S:Using and understanding RepeatMasker.Methods Mol Biol2012,