RESEARCH ARTICLE
Differential expression of genes related
to gain and intake in the liver of beef cattle
C. M. Zarek
*, A. K. Lindholm‑Perry
*, L. A. Kuehn and H. C. Freetly
Abstract
Background: To better understand which genes play a role in cattle feed intake and gain, we evaluated differential expression of genes related to gain and intake in the liver of crossbred beef steers. Based on past transcriptomics studies on cattle liver, we hypothesized that genes related to metabolism regulation and the inflammatory response would be differentially expressed. This study used 16 animals with diverse gain and intake phenotypes to compare transcript abundance after a 78 day ad libitum feed study.
Results: A total of 729 genes were differentially expressed. These genes were analyzed for over‑representation among biological and cellular functions, and pathways. Cell transport processes and metabolic processes, as well as functions related to transport, were identified. Pathways related to immune function, such as the proteasome ubiquit‑ ination pathway and the chemokine signaling pathway, were also identified.
Conclusions: Our results were consistent with past transcriptomics studies that have found immune and transport processes play a role in feed efficiency. Gain and intake are impacted by complex processes in the liver, which include cellular transport, metabolism regulation, and immune function.
Keywords: Feed efficiency, Transcriptome, Steers, Beef cattle, Immune response, Metabolism, Cellular transport
© The Author(s) 2017. This article is distributed under the terms of the Creative Commons Attribution 4.0 International License (http://creativecommons.org/licenses/by/4.0/), which permits unrestricted use, distribution, and reproduction in any medium, provided you give appropriate credit to the original author(s) and the source, provide a link to the Creative Commons license, and indicate if changes were made. The Creative Commons Public Domain Dedication waiver (http://creativecommons.org/ publicdomain/zero/1.0/) applies to the data made available in this article, unless otherwise stated.
Background
The highest production cost for beef cattle is feed, so it is important to select cattle that can produce more meat, while consuming less feed [1]. Thus, an understanding of differentially expressed genes and over-represented gene clusters and pathways in organs like the liver that may impact gain and feed intake in beef cattle, is critical. In addition, these genes and pathways may result in biologi-cal markers for the identification or selection of animals with superior phenotypes.
The liver was chosen because of its role in metabolism. Gluconeogenesis, glycolysis, and glyconeogenesis regu-late blood glucose levels and occur to a large extent in the liver. The phosphogluconate oxidative pathway accounts for a significant portion of glucose oxidation in the liver [2]. In ruminant digestion, the microorganisms in the rumen break down plant material to the volatile fatty
acids acetic acid, propionic acid, and butyric acid, which are absorbed through the rumen [3]. The liver produces approximately 85% of the glucose turnover in ruminants, which is a key process for energy production in rumi-nants [4]. Huntington [5] states that the liver metabolizes 50–90% of the butyrate and propionate absorbed by the rumen. The liver is also a major organ for glycogenesis, storage of glycogen, and glycogenolysis, which also help to regulate the blood glucose level. In addition, fatty acids are removed from the blood to provide energy via beta-oxidation. Another function of the liver is amino acid metabolism. Amino acids are removed from the blood-stream and used for protein synthesis, metabolism or catabolism [6]. Other functions of the liver include syn-thesis of albumin and fibrinogen, detoxification of blood and waste removal, and conversion of ammonia absorbed from the gut and rumen into urea [6]. In addition, the liver, portal veins, spleen, and gut use about one-half of the total heat energy in cattle, which is far greater than what would be predicted based on the mass of organs [5].
Open Access
*Correspondence: Christina.Zarek@UTSouthwestern.edu; amanda. lindholm@ars.usda.gov
Studies analyzing the liver’s role in feed efficiency using residual feed intake (RFI) have been conducted previously on cattle. Weber et al. [7] found differentially expressed genes involved in lipid metabolism and inflam-mation were down-regulated in the livers of low RFI Angus bull progeny. In 2011 Chen [8] found that low RFI bulls tended to have an up-regulation of genes related to the extracellular matrix and a down-regulation of genes involved in xenobiotic metabolism. From these findings, they concluded that the more efficient animals are better at moving substrates across their membranes and that the less efficient animals have higher levels of cellular stress in the liver [8]. Alexandre et al. [9] showed increased oxi-dative stress and hepatic lesions in the liver of low feed efficiency Nelore bulls. They suggested the altered lipid metabolism causes more reactive oxygen species, leading to inflammation. The inflammation compromises liver tissue in the low efficiency bulls, allowing easier entry for pathogens and increasing the immune response that was not seen in the high efficiency bulls [9].
Rather than RFI, this study uses high and low gain, and high and low feed intake quadrants as phenotypes to evaluate differences in transcript abundance in the liver. These data may help explain the molecular pathways that are important for efficient gain and reduced intake in the liver.
Methods
Animal care and use
The U.S. Meat Animal Research Center (USMARC) Ani-mal Care and Use Committee reviewed and approved all animal procedures. The procedures for handling cattle complied with the Guide for the Care and Use of Agri-cultural Animals in AgriAgri-cultural Research and Teaching (FASS [10]).
Feed trial
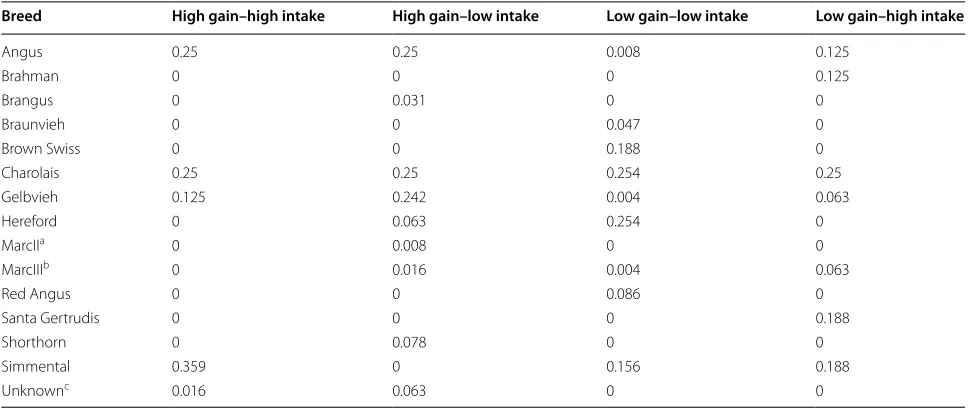
One hundred forty-three 11-month-old crossbred steers were fed ad libitum for 78 days. The finishing diet con-sisted of dry-rolled corn (57.35%), ground alfalfa hay (8%), Steakmaker with Tylan (4.25%), urea (0.4%), and wet distillers grain with solubles (30%). Daily intake of the steers was measured using the Insentec feed-ing system (Marknesse, The Netherlands), and steers were weighed every 3 weeks to record gain. Steers were also weighed at the beginning of the feed trial on day 0 and day 1, and on the last 2 days of the feed trial. Six-teen steers were selected for harvest based on maximiz-ing their distance from the bivariate mean of total gain and intake in four quadrants: high gain–high intake; high gain–low intake; low gain–low intake; and low gain–high intake were selected from the study (Fig. 1). The medical records and representation of breed within phenotypic
groups were also considered while selecting steers for harvest, such that sire breed was not over-represented within groups (Table 1). Animals selected for the experi-ment were euthanized by captive bolt followed by exsan-guination. Tissues were collected from steers harvested over 4 days, with one steer from each phenotypic group harvested each day to reduce environmental effects between groups. A sample of the right lobe of the liver was diced and flash frozen in liquid nitrogen. The sam-ples were stored at −80 °C until RNA isolation.
RNA Isolation
Hepatic RNA was isolated according to the manufac-turer’s protocol for Trizol (Ambion, Carlsbad, CA, USA), with a few exceptions. Briefly, a six-station Omni Prep homogenizer (Omni International, Kennesaw, GA, USA) was used to homogenize 50–100 mg of liver in 1 mL of Trizol for 40 s. The first centrifugation was lengthened to 20 min (at 11,750 rcf) from the standard 15 min, and the pelleted RNA was washed twice with 70% etha-nol. The RNA pellets were suspended in 50–150 µL of nuclease-free water, depending on the size of the pellet. Genomic DNA was removed from the extracted RNA using the Qiagen RNeasy mini-kit (Valenci, CA, USA) with a gDNA eliminator column, according to the manu-facturer’s protocol. A Nanodrop 8000 spectrophotometer (Thermo Scientific, Wilmington, DE, USA) was used to measure the concentration of the total RNA. The average 260/280 ratio was 1.93 (range 1.91–2.15). The RNA integ-rity number was measured using an Agilent Bioanalyzer and a RNA 6000 Nano kit (Santa Clara, CA, USA). The range of the RNA integrity numbers (RIN) was 4.9–8.7, with an average of 6.7. All samples had a RIN of 6.0 or
[image:2.595.306.539.87.242.2]higher, except two samples, which had RINs of 4.9 and 5.9.
Microarray
The samples were prepared according to the Affymetrix GeneAtlas System (Santa Clara, CA) microarray pro-tocol. Briefly, 250 ng of RNA and Poly-A RNA controls were reverse-transcribed to cDNA. The cDNA was tran-scribed to cRNA, which was purified with Agencourt AMPure XP beads (Beckman Coulter Life Sciences, Indi-anapolis, IN, USA) and washed with 80% ethanol. Fif-teen microgram of cRNA was then reverse-transcribed to single-stranded cDNA. RNase was added to the cDNA to remove the remaining RNA, and then the ss-cDNA was purified with AMPure beads (Indianapolis, IN) and washed with 80% ethanol. 5.5 μg of ss-cDNA was fragmented and biotinylated with the WT Expres-sion Kit. The labeled ss-cDNA, bioB, bioC, bioD, cre con-trols, and Control Oligonucleotide B2 were hybridized to Bovine 1.1ST array strips (Santa Clara, CA) for 20 h at 48 °C. The array strips were then stained and washed by the GenetAtlas Fluidics station and Wash and Stain Kit for WT Array Strips (Santa Clara, CA) according to protocol and imaged by the Affymetrix GeneAtlas scan-ner. CEL files produced by the scanner were normalized and converted to CHIP files using the Affymetrix Expres-sion Console software. The Guanine Cytosine Count Normalization and Signal Space Transformation algo-rithms and Robust Multichip Analysis are conducted by the software as part of the normalization and processing.
The GCC normalizes the intensities of the signals read by the scanner. The cel and chp files can be accessed at the Gene Expression Omnibus (GEO) with accession number GSE75700. Differential expression between the phenotypic groups described above was determined by one-way ANOVAs for each Cartesian quadrant (3° of freedom). P values were multiple-test corrected for false discovery rate using the Benjamini and Hochberg calcu-lations [11].
Gene function and pathway analysis
Differentially expressed genes were analyzed with the Protein Analysis Through Evolutionary Relationships (PANTHER) statistical over-representation test for Bos taurus with the default parameters, except the Bonfer-roni correction for multiple testing was not used. The over-represented GO-Slim biological processes and molecular functions are summarized in Tables 2 and 3. PANTHER Version 10.0, released May 15, 2015 was used in the analysis [12, 13].
Ingenuity® Pathway Analysis (IPA®) by Qiagen was also used for differential expression analysis to identify genes over-represented in canonical pathways. The top five pathways with the lowest P value (P < 0.05) were reported by the system.
Validation
The RNA was reverse-transcribed to cDNA using iScript™ Reverse Transcription Supermix for qRT-PCR (BioRad, Hercules, CA, USA) according to the
Table 1 Cattle breeds within each phenotypic group
a MarcII animals are 0.25 Simmental, 0.25 Gelbvieh, 0.25 Hereford, and 0.25 Angus
b MarcIII animals are 0.25 Pinzgauer, 0.25 Red Poll, 0.25 Hereford, and 0.25 Angus
c Unknown animals have breed of unknown origin
Breed High gain–high intake High gain–low intake Low gain–low intake Low gain–high intake
Angus 0.25 0.25 0.008 0.125
Brahman 0 0 0 0.125
Brangus 0 0.031 0 0
Braunvieh 0 0 0.047 0
Brown Swiss 0 0 0.188 0
Charolais 0.25 0.25 0.254 0.25
Gelbvieh 0.125 0.242 0.004 0.063
Hereford 0 0.063 0.254 0
MarcIIa 0 0.008 0 0
MarcIIIb 0 0.016 0.004 0.063
Red Angus 0 0 0.086 0
Santa Gertrudis 0 0 0 0.188
Shorthorn 0 0.078 0 0
Simmental 0.359 0 0.156 0.188
[image:3.595.56.540.101.305.2]manufacturer’s protocol. Briefly, RNA was read using a Nanodrop 8000 spectrophotometer (Thermo Scientific, Wilmington, DE) and diluted to 1 μg in 16 μL of water. The iScript (4 μL) was added and placed on a Dyad Pel-tier Thermal Cycler (BioRad, Hercules, CA, USA) at 25 °C for 5 min, 42 °C for 30 min, and 85 °C for 5 min. The cDNA was used for validating the microarray by qRT-PCR. Primers were designed using Primer3 [14, 15]. USB VeriQuest® SYBR Green qPCR Master Mix (2×) with Fluorescein (Affymetrix, Santa Clara, CA, USA) was used with 10 μM primers according to protocol. The gene RPLPO (P value 0.4211 for gain and 0.7179 for intake) was used as a housekeeper, and the results were normalized to its expression. The polymerase chain reac-tions (PCR) were run on a C1000 Touch Thermal Cycler, CFX384 Real-Time System (BioRad, Hercules, CA, USA) at 95 °C for 10 min, followed by 40 cycles of 95 °C for 15 s, and 60 °C for 30 s. The 2−ΔΔCt was calculated according to
Livak and Schmittgen [16] then log transformed for data analysis. Validation assays were analyzed with the same 3° of freedom Cartesian quadrant model. Genes selected for validation, oligonucleotide primers, and amplicon sizes are listed in Additional file 1: Table S1.
Results
Analysis of microarray data identified 729 differentially expressed genes (nominal P ≤ 0.05; Additional file 2: Table S2). Of these, 449 genes were annotated. None of
the differentially expressed genes passed a false discov-ery rate correction for multiple testing. To determine whether genes were over-represented among pathways or by gene function, they were analyzed using PANTHER and IPA.
The PANTHER over-representation test identified biological processes related to cellular transport and metabolism (Table 2). Five transport processes and two metabolic processes were identified. The top three bio-logical processes with the greatest number of differen-tially expressed (DE) genes were transport processes, two of which were related to ion transport. Another 20 genes were classified as carbohydrate metabolism and 13 DE genes were identified as belonging to the process of mito-sis, which had a fold change of 1.91.
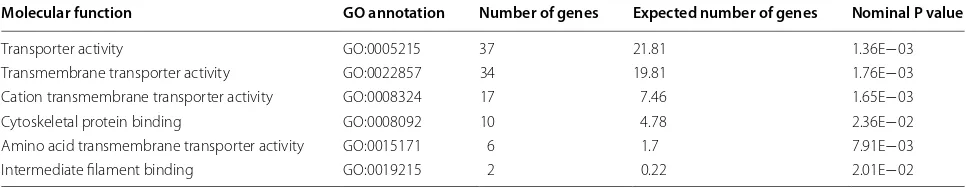
The PANTHER analysis also identified six molecular functions that were over-represented by the DE genes (Table 3). Four of the six were a form of transporter activ-ity, with two focused on transmembrane transportation. The other two molecular functions also have cellular transportation implications since they were cytoskeletal protein binding and intermediate filament binding. The cytoskeleton helps to move vesicles, molecules, and orga-nelles within cells, which underscores the transportation function identified by PANTHER.
Several IPA pathways showed that the differen-tially expressed genes are related to differences in immune responses. The protein ubiquitination pathway,
Table 2 Over-represented biological processes identified by PANTHER
Biological process GO annotation Number of genes Expected number of genes Nominal P value
Transport GO:0006810 61 48.86 4.06E−02
Ion transport GO:0006811 24 14.13 9.09E−03
Cation transport GO:0006812 22 11.39 2.93E−03
Carbohydrate metabolic process GO:0005975 20 10.94 7.92E−03
Mitosis GO:0007067 13 6.79 2.09E−02
Polysaccharide metabolic process GO:0005976 11 3.5 9.62E−04
Nucleobase‑containing compound transport GO:0015931 7 2.27 8.56E−03
Sensory perception GO:0007600 5 12.14 1.74E−02
Table 3 Over-represented molecular functions identified by PANTHER analysis
Molecular function GO annotation Number of genes Expected number of genes Nominal P value
Transporter activity GO:0005215 37 21.81 1.36E−03
Transmembrane transporter activity GO:0022857 34 19.81 1.76E−03 Cation transmembrane transporter activity GO:0008324 17 7.46 1.65E−03
Cytoskeletal protein binding GO:0008092 10 4.78 2.36E−02
Amino acid transmembrane transporter activity GO:0015171 6 1.7 7.91E−03
[image:4.595.57.540.101.221.2] [image:4.595.56.539.265.359.2]selenocysteine biosynthesis II pathway, and chemokine signaling pathway were identified by IPA (Table 4). Fif-teen DE genes were in the proteasome ubiquitination pathway, two in the selenocysteine biosynthesis II path-way, and five in the chemokine signaling pathway. The genes in each pathway are listed in Table 5.
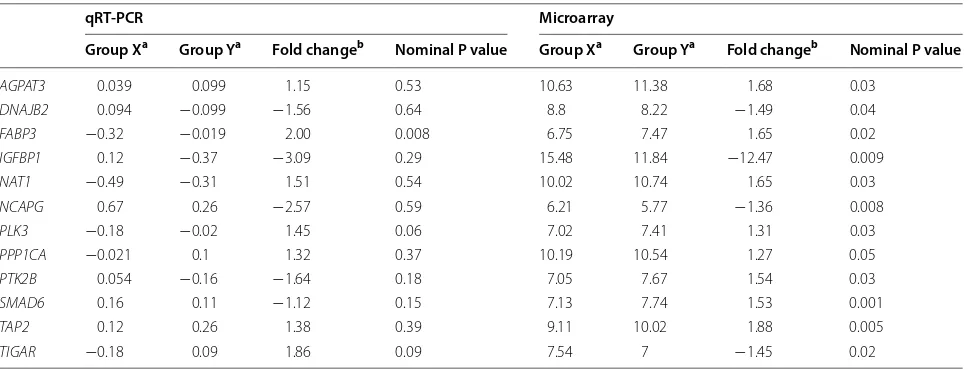
Validation of differentially expressed genes was per-formed using qRT-PCR for twelve genes. Three of the genes were significantly associated with the phenotypes tested (P < 0.1), and 7 of the 12 genes showed qRT-PCR expression patterns consistent with the microarray data (Table 6).
Discussion
The purpose of this study was to determine whether DE genes in the liver contribute to variation in gain and feed intake in beef steers. In total, 729 genes were identi-fied as differentially expressed in the liver. Although the
individual genes identified as differentially expressed did not pass FDR, they were over-represented among path-ways and gene functions. Moreover, the pathpath-ways and processes found by analyzing our DE genes are similar to other transcriptomic studies, suggesting that these results have biological relevance. It is likely that these genes did not pass FDR due to a small sample size (n = 16) of 4 animals/phenotypic group or due to the large number of breeds represented in the study. These data could be used for further analysis with additional data from other tissue types from these same animals or as part of a meta-analy-sis with similar data from other populations of cattle.
Similar “transport” processes and functions were identified as over-represented among the differentially expressed genes by PANTHER for both biological and molecular function tests suggesting that transporta-tion or movement of substances within or among cells is associated with gain and intake in the liver of beef
Table 4 Top canonical pathways identified by IPA analysis for DE genes
a The percent of DE genes in the pathway in relation to the total number of genes in that pathway is given
Pathway Number of DE genes Percentage of genes (%)a Nominal P value
Protein ubiquitination pathway 15 6.4 2.42E−03
Selenocysteine biosynthesis II (Archaea and Eukaryotes) 2 33.3 1.07E−02
Chemokine signaling 5 8.1 2.86E−02
Table 5 DE genes identified by IPA
Pathway Gene symbol Gene name Nominal P value
[image:5.595.58.538.327.385.2] [image:5.595.56.538.436.726.2]cattle. This is supported by the RFI study conducted by Chen et al. [8] with Angus bulls. They found an up-reg-ulation of extracellular matrix genes and genes involved in cell movement and organization in the low RFI bulls. Chen et al. [8] suggest that the up-regulation of genes involved in transportation suggests greater cellular proliferation and growth in the low RFI animals, com-pared to the high RFI animals. Similar gene families, such as solute carrier family genes and collagen genes, were identified by both Chen et al. [8] and this study. The pathways identified by IPA were representative of immune response, suggesting that cellular stress may have impacted the growth of the steers. For example, the proteasome ubiquitination pathway marks proteins for degradation by binding them to ubiquitin, and has been shown to be important for cellular growth, as well as immune function. The proteasome removes damaged proteins, and cleaves some proteins to active forms that may influence transcriptional regulation or other pro-cesses, such as inflammation. Further, the proteasome cleaves proteins for MHC-I antigen presentation and degrades some antigens during an immune response [17]. The TAP2 codes for a transmembrane transporter located in the endoplasmic reticulum that functions with TAP1 to move MHC I peptides into the ER. It is up-regulated by IFN-beta, TNF-alpha, and IFN-gamma [18]. In this study, TAP2 was up-regulated among the animals with high intake. We postulated that the high gain–high intake animals were under less oxidative stress, which seems to be supported by the differen-tial expression of components of the protein ubiquitin
pathway in this study. This suggests that more efficient animals expend less energy degrading cellular compo-nents, and thus are able to utilize that energy for gain.
The selenocysteine biosynthesis pathway and chemokine signaling pathways also imply that the steers’ immune system may impact their gain and intake. Sele-nocysteine is an amino acid that is incorporated into several proteins that require selenium to function. Some of these proteins play a role in reducing oxidative stress, while others are required for selenium transport or syn-thesis of other compounds [19]. Chemokines are signaling molecules that recruit leukocytes to sites of infection or injury by binding to G-protein coupled receptors on the plasma membrane and initiating a cascade. These cas-cades can lead to transcriptional regulation, chemotaxis, or cell polarization, which prepares the cell for movement [20]. Both of these pathways have components related to immune function and were shown to be differentially expressed between the gain and intake phenotypes.
Some of the genes in the chemokine signaling path-way have been found to have metabolic roles in addition to their immunological roles. For example, CAMK2 is needed for glucose production, and is activated by gluca-gon in the liver. Further, it was shown to activate the tran-scription factor FOXO-1, which activates transcription of the genes that lead to glucose production (glucose-6-phosphatase and phosphoenolpyruvate carboxykin-ase). The CAMK2 may also play a role in obesity through its regulation of glucose production in the liver [21]. The
CAMK2 expression in this study was highest in the high gain–low intake animals.
Table 6 Microarray and qRT-PCR expression of genes chosen for validation
a For AGPAT3, DNAJB2, SMAD6, and TAP2, Group X was high gain-low intake and Group Y was low gain-high intake. FABP3, PTK2B, PLK3, and TIGAR had high gain-high intake (Group X) and low gain-high intake (Group Y). IGFPB1, NAT1, and NCAPG had high gain-low intake (Group X) and low gain-low intake (Group Y). PPP1CA had high gain-high intake (Group X) and low gain-low intake (Group Y)
b Expression of Groups X and Y (the groups with the greatest differential expression) were compared to determine fold change for each gene
qRT-PCR Microarray
Group Xa Group Ya Fold changeb Nominal P value Group Xa Group Ya Fold changeb Nominal P value
AGPAT3 0.039 0.099 1.15 0.53 10.63 11.38 1.68 0.03
DNAJB2 0.094 −0.099 −1.56 0.64 8.8 8.22 −1.49 0.04
FABP3 −0.32 −0.019 2.00 0.008 6.75 7.47 1.65 0.02
IGFBP1 0.12 −0.37 −3.09 0.29 15.48 11.84 −12.47 0.009
NAT1 −0.49 −0.31 1.51 0.54 10.02 10.74 1.65 0.03
NCAPG 0.67 0.26 −2.57 0.59 6.21 5.77 −1.36 0.008
PLK3 −0.18 −0.02 1.45 0.06 7.02 7.41 1.31 0.03
PPP1CA −0.021 0.1 1.32 0.37 10.19 10.54 1.27 0.05
PTK2B 0.054 −0.16 −1.64 0.18 7.05 7.67 1.54 0.03
SMAD6 0.16 0.11 −1.12 0.15 7.13 7.74 1.53 0.001
TAP2 0.12 0.26 1.38 0.39 9.11 10.02 1.88 0.005
[image:6.595.57.544.100.285.2]The inclusion of distiller’s grains with solubles resulted in a diet that exceeded the minimum protein level rec-ommended for growing cattle. Since the liver is the pri-mary site of catabolism of excess amino acids, and is the primary site of ureagenesis, elevated protein potentially could result in an increase in expression of genes asso-ciated with those metabolic processes. However, we did not detect genes involved in ureagenesis as differentially expressed between animals with high and low intake in this study.
Other transcriptome studies of cattle liver have found immune response to play a role in feed efficiency. Connor et al. [22] conducted a feed restriction study followed by ad libitum feeding study with black angus steers to study differential expression in the liver. Genes involved in cell proliferation were lower in transcript abundance during the restriction period, and cytokinesis, inflammation, and oxidative stress were higher in transcript abundance after the ad libitum feeding [22]. Paradis et al. [23] used RNA sequencing to identify differentially expressed genes in liver biopsies from beef replacement heifers with low or high RFI adjusted to backfat thickness. They found seven DE genes, five of which are regulated by interferon sign-aling. They also used qRT-PCR to identify DE genes and identified genes that play a role in oxidative stress and detoxification. These results showed that more efficient heifers may have an improved response to inflammation and may expend less energy combating pathogens than high RFI heifers [23]. Chen et al. [8] saw a down-regu-lation of genes involved in inflammation and oxidative stress in high feed efficiency Angus bulls, and an up-reg-ulation of those genes in the low efficiency bulls [8].
Conclusions
In conclusion, this study utilized microarray to identify processes that may impact gain and feed intake in beef cattle. While our results did not pass multiple testing cor-rection, they suggested that immune response and oxida-tive stress play a role in feed efficiency. The proteasome ubiquitination pathway and chemokine pathways were over-represented by our DE genes, underscoring poten-tial immune functions that underlie some of the variation in gain and intake.
Additional files
Additional file 1: Table S1. Forward and reverse primers for qRT‑PCR validation. Sequences of oligonucleotides designed for qRT‑PCR validation of differentially expressed genes. Table also includes GenBank ID used for primer design, length of primers and expected amplicon size (bp). Additional file 2: Table S2. Differentially expressed genes in steer liver. LSMEANS by phenotypic quadrant, nominal P values and FDR p values are presented. Table includes the list of differentially expressed genes with nominal P < 0.05.
Abbreviations
DE: differentially expressed; ER: endoplasmic reticulum; FDR: false discov‑ ery rate; IPA: ingenuity pathway analysis; qRT‑PCR: quantitative real time polymerase chain reaction; PANTHER: Protein Analysis through Evolutionary Relationships; PCR: polymerase chain reaction; RFI: residual feed intake; RIN: RNA integrity number.
Authors’ contributions
CMZ completed RNA isolation, microarray data collection, and validation, and was a major contributor in writing the manuscript. ALP conceived of the study, designed the experiments, and provided oversight. LAK designed the experiment and performed statistical analysis. HCF analyzed phenotypes for the study. All authors read and approved the final manuscript.
Acknowledgements
The authors would like to thank Linda Flathman and Becca Kern for technical assistance; Donna Griess for manuscript preparation; the cattle operation crew for caring for the animals; and the abattoir crew for their assistance with the harvest.
Mention of trade names or commercial products in this article is solely for the purpose of providing information and does not imply recommendations or endorsement by the USDA. USDA is an equal opportunity provider and employer.
Competing interests
The authors declare that they have no competing interests.
Availability of data and materials
The dataset supporting the conclusions of this article is available in the Gene Expression Omnibus repository, GEO accession number GSE75700, http:// www.ncbi.nlm.nih.gov/geo/query/acc.cgi?acc=GSE75700. The datasets sup‑ porting the conclusions of this article are also included within the article and its additional files.
Ethics approval and consent to participate
The U.S. Meat Animal Research Center (USMARC) Animal Care and Use Com‑ mittee reviewed and approved all animal procedures. The procedures for handling cattle complied with the Guide for the Care and Use of Agricultural Animals in Agricultural Research and Teaching (FASS [10]).
Received: 7 September 2016 Accepted: 14 December 2016
References
1. Ahola JK, Hill RA. Input factors affecting profitability: a changing para‑ digm and a challenging time. In: Hill RA, editor. Feed efficiency in the beef industry. 1st ed. Hoboken: John Wiley, Inc.; 2012. p. 7–19. 2. Jensen D. The Principles of Physiology. 2nd ed. New York: Appelton‑
Century‑Crofts; 1980.
3. Ensminger ME, Olentine CG. Ruminant digestive system. Feeds and nutri‑ tion. Clovis: Ensminger Publishing Company; 1978. p. 49–50.
4. Bergman EN, Brockman RP, Kaufman CF. Glucose metabolism in rumi‑ nants: comparison of whole‑body turnover with production by gut, liver and kidneys. Fed Proc. 1974;33:1849–54.
5. Huntington GB. Energy metabolism in the digestive tract and liver of cattle: influence of physiological state and nutrition. Reprod Nutr Dev. 1990;30:35–47.
6. Freetly HC, Knapp JR, Calvert CC, Baldwin RL. Development of a mechanistic model of liver metabolism in the lactating cow. Agric Syst. 1993;41:157–95.
7. Weber KL, Welly BT, Van Eenennaam AL, Young AE, Porto‑Neto LR, Reverter A, Rincon G. Identification of gene networks for residual feed intake in angus cattle using genomic prediction and RNA‑seq. PLoS ONE. 2016. doi:10.1371/journal.pone.0152274.
• We accept pre-submission inquiries
• Our selector tool helps you to find the most relevant journal • We provide round the clock customer support
• Convenient online submission • Thorough peer review
• Inclusion in PubMed and all major indexing services • Maximum visibility for your research
Submit your manuscript at www.biomedcentral.com/submit
Submit your next manuscript to BioMed Central
and we will help you at every step:
9. Alexandre PA, Kogelman LJA, Santana MHA, Passarelli D, Pulz LH, Fantin‑ ato‑Neto P, Silva PL, Leme PR, Strefezzi RF, Coutinho LL, Ferraz JBS, Eler JP, Kadarmideen HN, Fukumasu H. Liver transcriptomic networks reveal main biological processes associated with feed efficiency in beef cattle. BMC Genet. 2015;16:1073.
10. FASS. Guide for care and use of agricultural animals in agricultural. Research and teaching. 3rd ed. Fed Savoy: Animal Science Society; 2010. 11. Benjamini Y, Hochberg Y. Controlling the false discovery rate: a practical
and powerful approach to multiple testing. J R Stat Soc. Series B (Meth‑ odological). 1995;57:289–300.
12. Mi H, Poudel S, Muruganujan A, Casagrande JT, Thomas PD. PANTHER ver‑ sion 10: expanded protein families and functions, and analysis tools. Nucl Acids Res. 2016;44:336–42.
13. Mi H, Thomas P. PANTHER pathway: an ontology‑based pathway database coupled with data analysis tools. Meth Mol Biol. 2009;563:123–40. 14. Untergasser A, Cutcutache I, Koressaar T, Ye J, Faircloth BC, Remm M,
Rozen SG. Primer3—new capabilities and interfaces. Nucl Acids Res. 2012. doi:10.1093/nar/gks596.
15. Koressaar T, Remm M. Enhancements and modifications of primer design program Primer3. Bioinformatics. 2007;23:1289–91.
16. Livak KJ, Schmittgen TD. Analysis of relative gene expression data using real‑time quantitative PCR and the 2‑ΔΔCT method. Methods. 2001;25:402–8.
17. Lecker SH, Goldberg AL, Mitch WE. Protein degradation by the ubiquitin‑ proteasome pathway in normal and disease states. J Am Soc Nephrol. 2006;17:1807–19.
18. Ambagala APN, Feng Z, Barletta RG, Srikumaran S. Molecular cloning, sequencing, and characterization of bovine transporter associated with antigen processing 2 (BoTAP2). Immunogenetics. 2002;54:30–8. 19. Schmidt RL, Simonović M. Synthesis and decoding of selenocysteine and
human health. Croat Med J. 2012;53:535–50.
20. Mellado M, Rodríguez‑Frade JM, Mañes S, Martínez‑A C. Chemokine signaling and functional responses: the role of receptor dimerization and TK pathway activation. Ann Rev Immunol. 2001;19:397–421.
21. Ozcan L, Wong CCL, Li G, Xu T, Pajvani U, Park SKR, Wronska A, Chen BX, Marks AR, Fukamizu A, Backs J, Singer HA, Yates JR 3rd, Accili D, Tabas I. Calcium signaling through CaMKII regulates hepatic glucose production in fasting and obesity. Cell Metab. 2012;15:739–51.
22. Connor EE, Kahl S, Elsasser TH, Parker JS, Li RW, Van Tassell CP, Baldwin RL 6th, Barao SM. Enhanced mitochondrial complex gene function and reduced liver size my mediate improved feed efficiency of beef cattle during compensatory growth. Funct Integr Genom. 2010. doi:10.1007/ s10142‑009‑0138‑7.