RESEARCH NOTE
Unique microglia expression profile
in developing white matter
Ori Staszewski and Nora Hagemeyer
*Abstract
Objective: Recently we demonstrated that amoeboid microglia in white matter regions are essential for proper oli‑ godendrocyte homeostasis and myelinogenesis in the first postnatal week. Amoeboid microglia in the mouse corpus callosum change their activation profile within few days after postnatal day (P)7 with microglia of the cerebellum showing similar features. Here we expanded our previous transcriptional analysis and performed detailed bulk RNA sequencing of microglia from corpus callosum, cortex and cerebellum at P7, P10 and P42. The goal of this study was to identify a specific gene profile for both, white matter and grey matter microglia during development.
Results: Microglia in white matter regions display unique characteristics in the first postnatal week of murine life. In both the corpus callosum and cerebellum microglia show amoeboid morphology and a similar transcription profile during development including high expression of genes related to priming of microglia, phagocytosis and migra‑ tion at P7; characteristics which are already lost at P10. Together these data verify our previous transcriptional data obtained by microarray analysis and enable a more complete view into white matter and grey matter microglia at different developmental stages.
Keywords: Amoeboid microglia, RNA sequencing, White matter, Grey matter
© The Author(s) 2019. This article is distributed under the terms of the Creative Commons Attribution 4.0 International License (http://creat iveco mmons .org/licen ses/by/4.0/), which permits unrestricted use, distribution, and reproduction in any medium, provided you give appropriate credit to the original author(s) and the source, provide a link to the Creative Commons license, and indicate if changes were made. The Creative Commons Public Domain Dedication waiver (http://creat iveco mmons .org/ publi cdoma in/zero/1.0/) applies to the data made available in this article, unless otherwise stated.
Introduction
Microglia are the resident myeloid cells in the brain parenchyma with diverse functions during homeostasis and disease [1]. The accumulation of activated micro-glia with an amoeboid morphology along the ventricles and white matter regions within the first postnatal week was described as early as 1932 [2, 3]. This phenomenon was not restricted to rodents; in 1939 Kershman coined the term “fountain of microglia” for hot spots of acti-vated microglia during human embryogenesis [4]. Many decades later this phenomena was confirmed by several studies [5–10]. Their function, however, has remained unknown. Recently we identified an essential role for amoeboid microglia in murine white matter regions for oligodendrocyte homeostasis and myelinogenesis dur-ing the first postnatal week [11], an observation which was replicated shortly after [12]. On the transcriptional
level, microarray based analysis showed that microglia of the corpus callosum (CC) at postnatal day (P)7 are highly activated compared to cortical microglia. As we observed that the amoeboid phenotype rapidly changed within a few days after P7 and cerebellar microglia appeared to display very similar characteristics to callosal microglia, we proceeded here to analyze microglia during devel-opment in a more detailed way, by assessing P7, P10 and adult (P42) microglia from the CC, cortex (Cx) and cerebellum (Cb) with bulk RNA sequencing. Our data identify that the transcriptional profile of microglia in the CC and Cb at P7 and P10 is driven largely by age and much less by the specific brain region assayed and corti-cal microglia show a transcriptional profile different from white matter microglia. Finally, at P42 microglia from all brain regions appeared to share a common transcrip-tional pattern. These data suggest that early during post-natal development white matter microglia in all brain regions possess a unique transcriptional profile com-pared with grey matter that is lost during maturation.
Open Access
Main text
Materials and methods Mice
Cx3cr1GFP/WT and wildtype (C57BL/6 J) mice were bred
in-house under pathogen-free conditions. All animal experiments were approved by the Regierungspräsidium Freiburg, Germany, Section: Landwirtschaft, Ländlicher Raum, Veterinär- und Lebensmittelwesen. Application no. G17/55 and X-16/04.
Cell sorting and histology
Tissue samples were prepared as described before [11,
13]. Briefly, mice were lethally anesthetized and perfused. Brain tissue was fixed in 4% PFA for immunohistochem-istry or brain regions were separated and homogenized for cell sorting.
Cell sorting was done on a MoFlo Astrios (Beckman Coulter, Krefeld, Germany). Live/Dead stain: Fixable Viability Dye eFluor®506 (eBioscience, San Diego, USA).
Fc block: Fc-receptor blocking antibody CD16/CD32 (clone:2.4G2, BD Bioscience, Heidelberg, Germany). Antibodies used: anti-CD45 (clone:30-F11, eBioscience, San Diego, USA), anti-CD11b (clone:M1/70, eBioscience, San Diego, USA), anti-Gr1 (clone:RB6-8C5, Biolegend, Fell, Germany).
For immunofluorescence staining tissues were treated as described before [11]. Briefly, mouse brains were fixed overnight, dehydrated and embedded in
Tissue-Tek®O.C.T.TM Compound (Sakura Finetek Europ B.V.,
Netherlands). 12 µm cryosections were stained. Primary antibodies used: IBA-1 (1:500, Cat. No.: NB100-1028, Novus Biologicals, Wiesbaden, Germany), SPP1 (1:200, Cat. No.: ab8448, abcam, Berlin, Germany), CLEC7A (1:30, Cat. No.: mabg-mdect, InvivoGen, Toulouse, France) and CD206 (1:100, Cat. No.: MCA2235, Bio-Rad, Munich, Germany). Secondary antibodies used: Alexa Fluor 555, Alexa Fluor 568, Alexa Fluor 488, Alexa Fluor 647 1:500 (Life technologies, Darmstadt, Ger-many). Nuclei counterstaining: 4,6-diamidino-2-phe-nylindole (DAPI, 1:10,000, Cat. No.: 236276, Boehringer, Mannheim, Germany). Imaging was performed on the BZ-9000 Biorevo microscope (Keyence, Neu-Isenburg, Germany). N = 3–4/timepoint. Quantification of
micro-glia (Fig. 1c) was performed on three parasagittal brain sections (every 10th section starting at the level of the rostral migratory stream) per animal (N = 3 mice).
RNA sequencing
FACS-sorted microglia were processed at the Genomics Core Facility “KFB-Center of Excellence for Fluorescent Bioanalytics” (University of Regensburg, Regensburg, Germany; http://www.kfb-regen sburg .de). Library prepa-ration and RNA sequencing was performed as described
before [13]. Quality control of Fastq Files was done using FastQC [14]. Using the Star aligner (version 2.5.2b), reads
were mapped to the GRCm38 mouse genome [15]. Read
counts were acquired by the featureCounts (version 1.6.2) package with essentially standard settings. Specifi-cally counts were combined at the gene level, multimap-ping and multi overlapmultimap-ping counts were discarded and reads were required to overlap by at least 1 base with an annotated feature. Differential gene expression analy-sis was done by the limma/voom (version 3.38) pipeline in R following the limma vignette [16–18]. Specifically genes with zero reads were discarded. Following counts were summarized for each gene over all samples and the lower third of genes were removed (averaging to about 1.5 counts per sample). After prefiltering the limma/ voom pipeline was followed as described the vignette. Heatmaps were created using the ComplexHeatmaps R package [19]. Pathway Analysis was conducted using Ingenuity Pathway Analysis (IPA, Qiagen). For IPA analy-sis all genes with an adjust p-value of < 0.01 were retained and IPA analysis was performed with standard settings except that only experimentally observed interactions in mouse datasets were queried.
Results
To investigate the expression profile of microglia during development in white and grey matter regions, we per-formed bulk RNA sequencing of fluorescent activated cell sorted (FACS) microglia (CD45+, CD11b+, Gr−) of
the CC, Cx and Cb at postnatal day P7, P10 and P42. By analyzing the gene expression of microglia at these differ-ent ages and brain regions it became clear, that microglia of the CC and Cb display a similar expression profile. In these brain regions, the developmental stage had a higher impact on gene expression compared to brain region itself (Fig. 1a). In contrast, cortical microglia at P7 and P10 clustered separately from CC and Cb microglia at P7 and P10. This suggests that, in this instance, the brain region itself had higher impact on the gene profile of cor-tical microglia than did age. Finally, at P42, microglia of all brain regions investigated were quantitatively similar at the gene expression level. Next, using Cx3cr1GFP/WT
these data indicate that developmental transcriptional profile, morphological phenotype, and cell dynamics are similar between microglia of the CC and Cb and different from cortical microglia.
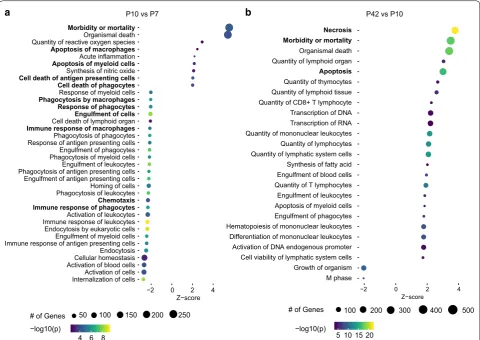
To more closely assess differences in gene expression over time, we performed pathway analyses, which dem-onstrated a higher expression of genes related to apopto-sis at P10 compared to P7 in the CC, whereas at P7, genes related to phagocytosis and chemotaxis were highly upregulated compared to P10 (Fig. 2a). Interestingly, with further maturation (comparison of microglia at P42 to P10) mainly genes related to apoptosis and necrosis were highly expressed in the CC (Fig. 2b). A similar pro-file could be seen for microglia in the Cb and Cx related to apoptosis (data not shown), whereas genes related to phagocytosis (e.g. Gsn, Cd36, Abca1, Grk6 and Scarb1)
were not expressed as highly as in the CC and were not as strongly altered over time (Fig. 3a).
Finally, we carried out hierarchical clustering of known priming genes as Axl, Mrc1, Gas7, Clec7a, Igf1, Spp1, Anxa5, Gpnmb, Itgax, Lgals3, Cd36 and F13a1, which suggested that these genes are highly upregu-lated in P7 CC microglia. In contrast, Cb microglia at P7 showed a somewhat lower upregulation of these genes, while no expression was observed in corti-cal microglia (Fig. 3b). At P10, upregulation of these genes was no longer observed in any of the three regions assessed. Finally, in agreement with the tran-scriptional assessment we observed clear expression of
SPP1, CLEC7A and CD206 (Mrc1) in IBA-1+ microglia
at P7 in the CC by immunohistochemistry (Fig. 3c, d)
Cor
pus callosum/Cor
te
x
Cerebellum
b a
CC Cx Cb
P7 P10 P42 CC Cb Cx -2 0 2 4
c
age region
600
400
200
0
P7 P10P21
CC Cx Cb
P7 P10P21 P7 P10P21
CX
3
CR1
+ cells/m
m
2
Fig. 1 a Heatmap of the most regulated genes (all genes with absolute log2fold‑change ≥ 1 and adjust p‑value ≤ 0.01) in the corpus callosum (CC),
[image:3.595.59.540.87.455.2]which was not detectable in the CC at P10 (Fig. 3c, d). Interestingly, in the Cb CLEC7A and CD206 were not expressed in white matter microglia at any timepoint, however single positive SPP1+ microglia or patches
of SPP1+ microglia could only be found in the central
area of the white matter at P7 (Fig. 3c right (arrow), Additional file 1: Figure S1b). No expression of SPP1, CLEC7A and CD206 could be found in microglia of the cortex at any timepoint (Fig. 3e left; Additional file 1: Figure S1a). These data, again, demonstrate similar phenotype of white matter microglia early in develop-ment and a strong transcriptional dynamic occurring over just a few days.
Discussion
Here we have demonstrated a detailed RNA sequenc-ing analysis of murine microglia of white and grey mat-ter regions over different developmental stages. This complements our previous data which identified spe-cific properties of a microglia subpopulation which is only present in the developing CC and cerebral white
matter. First, we could demonstrate here that micro-glia of white matter regions, namely the CC and Cb, are closely related to each other at P7 and P10 compared to cortical grey matter microglia. Second, microglia in both CC and Cb undergo a change in their gene expres-sion profile between P7 and P10, demonstrating rapid alterations specific to white matter microglia at these developmental stages. At P7, CC and Cb microglia dis-play a distinct transcriptional profile, including genes related to phagocytosis and migration as well as prim-ing of microglia described durprim-ing agprim-ing and disease [20,
21]. Genes related to apoptosis and necrosis, instead, are highly expressed at P10, and further increased at P42. The unique phenotype of P7 CC microglia was further confirmed in assessment of SPP1, CLEC7A and CD206 protein immunoreactivity, which was uniquely present at this timepoint, while not present in the cortical microglia and only partly recapitulated (SPP1 expression) in glia of the Cb. Third, in contrast to white matter micro-glia, gene transcription of cortical microglia was driven by the brain region itself and was therefore distinct
M phase Growth of organism Cell viability of lymphatic system cells Activation of DNA endogenous promoter Differentiation of mononuclear leukocytes Hematopoiesis of mononuclear leukocytes Engulfment of phagocytes Apoptosis of myeloid cells Engulfment of leukocytes Quantity of T lymphocytes Engulfment of blood cells Synthesis of fatty acid Quantity of lymphatic system cells Quantity of lymphocytes Quantity of mononuclear leukocytes Transcription of RNA Transcription of DNA Quantity of CD8+ T lymphocyte Quantity of lymphoid tissue Quantity of thymocytes
Apoptosis
Quantity of lymphoid organ Organismal death
Morbidity or mortality Necrosis
−2 0 2 4
Z−score Internalization of cellsActivation of cells
Activation of blood cellsCellular homeostasis Endocytosis Immune response of antigen presenting cellsEngulfment of myeloid cells Endocytosis by eukaryotic cells Immune response of leukocytesActivation of leukocytes
Immune response of phagocytesChemotaxis
Phagocytosis of leukocytesHoming of cells Engulfment of antigen presenting cells Phagocytosis of antigen presenting cellsEngulfment of leukocytes Phagocytosis of myeloid cellsEngulfment of phagocytes Response of antigen presenting cellsPhagocytosis of phagocytes
Immune response of macrophagesCell death of lymphoid organ Engulfment of cells Response of phagocytes Phagocytosis by macrophagesResponse of myeloid cells Cell death of phagocytes Cell death of antigen presenting cellsSynthesis of nitric oxide Apoptosis of myeloid cellsAcute inflammation Apoptosis of macrophages
Quantity of reactive oxygen speciesOrganismal death
Morbidity or mortality
−2 0 2 4
Z−score
# of Genes 50 100 150 200 250
4 6 8
−log10(p) −log10(p)
# of Genes
5 10 15 20
100 200 300 400 500
P10 vs P7 P42 vs P10
a b
[image:4.595.58.539.88.428.2]Fig. 3 a Heatmap of regulated genes related to phagocytosis in the corpus callosum (CC), cerebellum (Cb) and cortex (Cx) at different ages [postnatal day (P)7, 10, 42]. b Heatmap of known priming genes in the CC, Cb and Cx at P7, P10 and P42. Asterisks highlighting genes confirmed on protein level; Representative immunofluorescence pictures of wildtype mice depicting SPP1 [red (c, e)], CLEC7a [white (c, e)] and CD206 [white (d)] expression in IBA‑1+ microglia (green) in the CC (c, d), Cx (e left) and Cb (e right) at P7, P10 and P42. Scale bar 50 µm; blue = DAPI; arrow indicating
IBA‑1+/SPP1+ cell in Cb; N = 3–4 mice per timepoint
Gsn Cd36
Abca1
Grk6
Scarb1
Tlr2 Tgfbi Cxcl1 Cxcl2 Fgl2 Mmp12 Arg1 Axl Cd163 Alox15
Mrc1 *
Cxcr4 Gas7
Clec7a *
Igf1
Spp1 *
Anxa5 Gpnmb Itgax Lgals3 Marco Cd36 F13a1
P7
P10
P42
CC
Cb
Cx
4 2 0 -2 age
region
a b
IBA-1 SPP1 CLEC7A CLEC7A
IBA-1
DAPI DAPI
IBA-1 SPP1
P7
IBA-1 CD206 DAPI
IBA-1 CD206
P7
CX3CR1 SPP1 CLEC7A
CX3CR1 SPP1 CLEC7A
DAPI
P1
0
CX3CR1 CD206 DAPI
CX3CR1 CD206
P1
0
CX3CR1 SPP1 CLEC7A
CX3CR1 Spp1 CLEC7A
DAPI
P4
2
CX3CR1 CD206 DAPI
CX3CR1 CD206
P4
2
4
CLEC7A
DAPI SPP1
DAPI
IBA-1
CLEC7A SPP1 CX3CR1
DAPI
CLEC7A CX3CR1 SPP1
DAPI
CLEC7A CX3CR1
SPP1
DAPI
CLEC7A CX3CR1 SPP1 DAPI
CLEC7A IBA-1 SPP1
P7
P1
0
P4
2
c
from white matter microglia. Fourth, gene expression of microglia was similar across regions in the adult brain. These results indicate that white matter microglia, per-haps by migration and phagocytosis, may play a special role in local tissue dynamics around P7, impacting oli-godendrocyte homeostasis and myelination. This role is likely restricted to a brief window of time, after which cell numbers decline through apoptosis. As maturation con-tinues into adulthood, resident microglial populations develop a common homeostatic role across white and grey matter regions. It will be of interest to understand the responsible molecular mechanisms and functional consequences in future studies.
Limitations
• Transcriptional data are presented without func-tional analyses.
• Juvenile stages could have been included.
Additional file
Additional file 1: Figure S1. Representative immunofluorescent images of wildtype or Cx3cr1GFP/WT mice presenting expression of SPP1 (red),
CLEC7A (white) and CD206 (white) in IBA‑1+ or CX
3CR1+ microglia in
the cortex (a) and cerebellum (b) at P7, P10 and P42. Scale bar 50 µm; blue = DAPI; arrow indicating IBA‑1+/SPP1+ cell in Cb; N = 3–4 mice per
timepoint.
Abbreviations
CC: corpus callosum; Cx: cortex; Cb: cerebellum; CNS: central nervous system; P: postnatal day; FACS: fluorescent activated cell sorting.
Acknowledgements
We thank Prof. Marco Prinz for his support of this study as well as Jaclyn Wam‑ steeker Cusulin for critically reading and editing the manuscript.
Authors’ contributions
NH designed and conducted the experiments. OS analyzed the RNA sequenc‑ ing data. NH and OS wrote the manuscript. Both authors read and approved the final manuscript.
Funding
This work received no funding.
Availability of data and materials
The main GEO accession number for RNAseq data: GSE132688
Ethics approval and consent to participate
All animal experiments were approved by the Regierungspräsidium Freiburg, Germany, Section: Landwirtschaft, Ländlicher Raum, Veterinär‑ und Lebensmit‑ telwesen. Application No. G17/55 and X‑16/04.
Consent for publication Not applicable.
Competing interests
The authors declare that they have no competing interests.
Received: 17 April 2019 Accepted: 26 June 2019
References
1. Prinz M, Erny D, Hagemeyer N. Ontogeny and homeostasis of CNS myeloid cells. Nat Immunol. 2017;18:385.
2. Rio‑Hortega P. Microglia. Cytol Cell Pathol Nerv Syst. 1932;2:482–534. 3. Sierra A, de Castro F, del Río‑Hortega J, Rafael Iglesias‑Rozas J, Garrosa M,
Kettenmann H. The, “Big‑Bang” for modern glial biology: translation and comments on Pío del Río‑Hortega 1919 series of papers on microglia. Glia. 2016;64:1801–40.
4. Kershman J. Genesis of microglia in the human brain. Arch Neurol Psych. 1939;41:24–50.
5. Chertoff M, Shrivastava K, Gonzalez B, Acarin L, Giménez‑Llort L. Differen‑ tial modulation of TREM2 protein during postnatal brain development in mice. PLoS ONE. 2013;8:e72083.
6. Hristova M, Cuthill D, Zbarsky V, Acosta‑Saltos A, Wallace A, Blight K, et al. Activation and deactivation of periventricular white matter phagocytes during postnatal mouse development. Glia. 2010;58:11–28.
7. Dalmau I, Vela JM, González B, Finsen B, Castellano B. Dynamics of micro‑ glia in the developing rat brain. J Comp Neurol. 2003;458:144–57. 8. Ellison JA, de Vellis J. Amoeboid microglia expressing GD3 ganglioside are
concentrated in regions of oligodendrogenesis during development of the rat corpus callosum. Glia. 1995;14:123–32.
9. Verney C, Monier A, Fallet‑Bianco C, Gressens P. Early microglial coloniza‑ tion of the human forebrain and possible involvement in periventricular white‑matter injury of preterm infants. J Anat. 2010;217:436–48. 10. Rezaie P, Male D. Colonisation of the developing human brain and spinal
cord by microglia: a review. Microsc Res Tech. 1999;45:359–82. 11. Hagemeyer N, Hanft K‑M, Akriditou M‑A, Unger N, Park ES, Stanley ER,
et al. Microglia contribute to normal myelinogenesis and to oligodendro‑ cyte progenitor maintenance during adulthood. Acta Neuropathol (Berl). 2017;134:441–58.
12. Wlodarczyk A, Holtman IR, Krueger M, Yogev N, Bruttger J, Khorooshi R, et al. A novel microglial subset plays a key role in myelinogenesis in developing brain. EMBO J. 2017;36:3292.
13. Datta M, Staszewski O, Raschi E, Frosch M, Hagemeyer N, Tay TL, et al. Histone deacetylases 1 and 2 regulate microglia function during devel‑ opment, homeostasis, and neurodegeneration in a context‑dependent manner. Immunity. 2018;48(514–529):e6.
14. Andrews S. FastQC: a quality control tool for high throughput sequence data. 2010. http://www.bioin forma tics.babra ham.ac.uk/proje cts/fastq c. 15. Dobin A, Davis CA, Schlesinger F, Drenkow J, Zaleski C, Jha S, et al. STAR:
ultrafast universal RNA‑seq aligner. Bioinf Oxf Engl. 2013;29:15–21. 16. Law CW, Chen Y, Shi W, Smyth GK. voom: precision weights unlock linear
model analysis tools for RNA‑seq read counts. Genome Biol. 2014;15:R29. 17. Ritchie ME, Phipson B, Wu D, Hu Y, Law CW, Shi W, et al. limma powers dif‑ ferential expression analyses for RNA‑sequencing and microarray studies. Nucleic Acids Res. 2015;43:e47.
18. Phipson B, Lee S, Majewski IJ, Alexander WS, Smyth GK. Robust hyperpa‑ rameter estimation protects against hypervariable genes and improves power to detect differential expression. Ann Appl Stat. 2016;10:946–63. 19. ComplexHeatmap R package. https ://acade mic.oup.com/bioin forma tics/
artic le/32/18/2847/17435 94.
20. Hickman SE, Kingery ND, Ohsumi TK, Borowsky ML, Wang L, Means TK, et al. The microglial sensome revealed by direct RNA sequencing. Nat Neurosci. 2013;16:1896–905.
21. Holtman IR, Raj DD, Miller JA, Schaafsma W, Yin Z, Brouwer N, et al. Induction of a common microglia gene expression signature by aging and neurodegenerative conditions: a co‑expression meta‑analysis. Acta Neuropathol Commun. 2015;3:31.
Publisher’s Note
![Fig. 1 a Heatmap of the most regulated genes (all genes with absolute log2fold‑change ≥ 1 and adjust p‑value ≤ 0.01) in the corpus callosum (CC), cerebellum (Cb) and cortex (Cx) at different ages [postnatal day (P)7, 10, 42]](https://thumb-us.123doks.com/thumbv2/123dok_us/8253205.275792/3.595.59.540.87.455/heatmap-regulated-absolute-corpus-callosum-cerebellum-different-postnatal.webp)
![Fig. 3 IBA‑1a Heatmap of regulated genes related to phagocytosis in the corpus callosum (CC), cerebellum (Cb) and cortex (Cx) at different ages [postnatal day (P)7, 10, 42]](https://thumb-us.123doks.com/thumbv2/123dok_us/8253205.275792/5.595.58.539.87.664/heatmap-regulated-related-phagocytosis-callosum-cerebellum-different-postnatal.webp)
