RESEARCH NOTE
Does dietary diversity predict the nutritional
status of adolescents in Jimma Zone, Southwest
Ethiopia?
Birhanu Jikamo
1*and Mekonen Samuel
2Abstract
Objective: This study aimed to assess the association between dietary diversity and nutritional status of adolescents in Jimma Zone, Southwest Ethiopia. A secondary data was used to assess the association between dietary diversity and nutritional status of adolescents in Jimma Zone, Southwest Ethiopia. Adolescents in the age of 13–17 years old included in the analysis. The data cleaned, coded and analyzed using Stata version 14.
Results: Over all prevalence of stunting and thinness were 26.1% and 25.3%. Stunting was higher among female adolescents (23.8%) than male (21.9%), while thinness was higher among male (27.5%) than female (25.3%) ado-lescents. In multivariate binary logistic regression model, being female adolescents were 98% (AOR = 1.98; 95% CI 1.6, 2.4] higher odd of stunted compared with those male adolescents, households had food insecurity were 67% [AOR = 1.67; 95% CI 0.6, 0.9] more likely to be associated with stunted than with those households which had secure foods. Adolescents who had high workload were 2.6 times [AOR = 2.6; 95% CI 1.2, 3.1] more likely to be associated with thinness compared with those adolescents who didn’t had high workload.
Keywords: Nutritional status, Dietary diversity, Adolescent, Ethiopia
© The Author(s) 2019. This article is distributed under the terms of the Creative Commons Attribution 4.0 International License (http://creat iveco mmons .org/licen ses/by/4.0/), which permits unrestricted use, distribution, and reproduction in any medium, provided you give appropriate credit to the original author(s) and the source, provide a link to the Creative Commons license, and indicate if changes were made. The Creative Commons Public Domain Dedication waiver (http://creat iveco mmons .org/ publi cdoma in/zero/1.0/) applies to the data made available in this article, unless otherwise stated.
Introduction
In, 2017 international report indicated that 1.8 billion estimated adolescents were live, from these 90% of them were from Low and Middle Income Countries (LMICs) [1]. Similarly, in Ethiopia in 2010 report showed that from the total population more than quarters (25.9%) of them were adolescents [2]. For the reason that, adoles-cents should provide special concentration not only their health and nutrition requirements but also they are our hope of problem-solvers, doctors, politicians and univer-sal leaders [3].
In, 2017 South Asia report found that magnitude of moderate and severe underweight is highest compared with other countries; one in 5 girls aged 5–19 years and nearly 1/3rd of their male peers were underweight [4]. Adolescents lowest body mass index (BMIs) were
registered in Ethiopia, Niger, Senegal, India, Bangladesh, Myanmar, and Cambodia [4].
Adolescents vulnerable to overweight and poor meta-bolic activities were associated with the happening of Non-Communicable Disease (NCD) and associated mor-tality later in life [5, 6]. In addition to this, global problem of moderate or severe proportion of underweight were higher than that of overweight and obesity [4, 5]. The adolescent nutritional problem is mainly public health concern in Sub-Saharan Africa where the percentage of underweight is much higher than that of overweight and obesity [4, 5].
Stunting is one of main public health crisis among ado-lescent girls because of adoado-lescent pregnancy is associated adverse-birth outcome and sexual transmitted diseases were very common in international societies [7, 8]. Fur-thermore, adolescent pregnancy not only affects growth for numerous girls in the region of the world, it is also risk factors for fetal growth restriction, premature birth and early neonatal deaths [7, 8]. As the result of these, giving
Open Access
*Correspondence: bjikammo@gmail.com
1 College of Medicine and Health Sciences, School of Public Health,
Hawassa University, Hawassa, Ethiopia
attention for adolescent nutrition and health is important to improve maternal and child health [7, 8].
For a number of years, the healths of adolescents and nutrition have not been given a major public health con-cern and there were no sufficient published literatures [8, 9]. Many of the global societies considers they were believed to be lesser susceptible to disease and suffer from fewer life-threatening conditions than those children and elderly people [8, 9]. Besides, adolescent nutrition receives very little attention and difficult to quantify accurately in this age group due to rapid change in growth and develop-ment and lack of consensus over which definition to use [8, 9].
Ethiopia, as the LMICs, nutritional problem is one of the major public health concerns for all phases of human life [9]. Moreover, in Ethiopia under nutrition is a main public-health catastrophe due to most people addicted non-diversified diet [10]. But, there is little evidence about the nutritional status of adolescents in Ethiopia [11, 12]. Furthermore, adolescent nutrition is distress from lack of documented evidences, low policymaker interest and little attention of program experience in the study setting [11, 12].
Responsible bodies will give consideration for adolescent nutrition which is potential to improve economic produc-tivity of countries, good pregnancy outcomes, and mini-mize adverse-chronic disease outcomes [10, 12]. Moreover, in Africa specifically in Ethiopia and Tanzania higher mag-nitude of under nutrition among adolescents have been registered (27%) [10], and (21%) [13]. Consequently, excep-tional concern is needed to adolescent dietary intake and practice, which is important contributor to get better ado-lescent health and productivity [10, 12].
Adolescents are frequently considered as healthy and strong but, previous literature indicated that numerous adolescent were underweight and stunted in height [11, 12]. In spite of this, previous literature in Ethiopia showed that still gave more consideration on vulnerable people die-tary intake such as: infant, pregnant and lactating women but, limited evidences for adolescents [10, 11]. Under-standing the association of determinants with adolescent’s dietary diversity in take, this is important to reduce under-nutrition among adolescents and gives specific interven-tion. Dietary diversity and nutritional status of adolescents in Ethiopia is significant problem. The findings from this study could be used to assess the association between die-tary diversity and nutritional status of adolescents in Jimma Zone, Southwest Ethiopia.
Main text
Methods
Study design, setting and population
We analyzed secondary data collected from a commu-nity-based cross-sectional longitudinal survey con-ducted in selected woredas in Jimma zone, Southwest Ethiopia. The Jimma Longitudinal Family Survey on Youth (JLFSY) was conducted in 2005–2006. Adoles-cents in the age group of 13–17 years old included in the analysis.
Sample size and sampling procedure
Two-stage sampling technique used to select sample of adolescents. At the first stage, households were randomly selected from selected kebele based on proportional allo-cation of adolescents. In the second stage, one adolescent (a boy or a girl) was randomly selected from each house-hold. A total of 2084 adolescents used for this analysis, of 1025 female and 1059 male.
Data collection tools and procedure
The data for prevalence of stunting and thinness and associated factors was taken from baseline survey of ado-lescents in Jimma zone. The variables reviewed were rel-evant for this research question were collected from the SPSS filled data.
Questionnaires translated into Amharic and Oromifa languages and checked for consistency by another per-son who speaks both Oromifa and English. The ques-tionnaires focused on issues related to adolescents’ such as: practice of nutritional status, socio demographic, economic and environmental factors, food insecurity and anthropometric measurements of the adolescent included and used to address the research question.
Anthropometric measurements measured by trained health professionals by using mid upper arm circumfer-ence, weight and height of the study participants.
A Dietary Diversity Score (DDS) constructed by count-ing the intake of the food groups over a period of 1 week based on the definition that it is the sum of food groups consumed over the reference period. For example, an adolescent who consumed one item from each of the food groups at least once during the week would have the maximum DDS. The DDS converted into tertiles and the highest tertile used to define ‘‘high’’ dietary diversity score, “medium” score and while the two lower tertiles combined labeled ‘‘low’’ dietary diversity score.
frequency questionnaire containing food items that were commonly consumed in the study setting.
Data processing and analysis
The data analyzed using Stata version 14. Frequency, per-centage and descriptive summaries used to explain the amount of study participants in the analysis. Detection of specific factors associated with nutritional status among adolescents using binary logistic regression. Explanatory variables were significant in the binary logistic regression analysis with a cut-off point of P-value < 0.25 were can-didate factors for the multiple binary logistic regression models [14].
In the multiple binary logistic regression models meas-ure of strength of association were reported as odds ratio (OR) with 95% CIs, by controlling the effect of other fac-tors. P-value of < 0.05 was indicated significant associa-tion between the nutriassocia-tional status and the independent predictors.
Stepwise forward method of model building technique was used for each model development. Confounders and interaction effects were assessed by calculating relative changes on ß coefficients with a cutoff point 15% [15]. Multicolinearity effect was assessed with cut off point mean of variation inflation factor (VIF) less than five [16] and model robustness was also assessed using Hosmer and Lemeshow techniques [17].
Dietary diversity obtained by summing the number of food and food items consumed in each group separately [18–20]. The total score calculated and this ranged from
0 to 12. Tertiles of DDS used to classify the children into low (≤ 4), medium (5–8) and high (9–12) [18, 19].
Anthropometric measurements: three indicators assessed such as: weight-for-age, height-for-age and weight-for-height Z-scores for all the adolescents. The weight was measured using portable standing scale. The weight was recorded to the nearest 0.1 kg. It was cali-brated against known weight regularly. During the pro-cedure the subjects wore light clothes and bare foot. The level of stunting (height for age z-scores), which was an indicator of chronic malnutrition, and thinness (BMI for age z-scores), which was another indicator of malnutri-tion, were calculated using WHO Athro-Plus software [21]. Thus, those below − 2 standard deviations of the NCHS median reference for height-for-age and weight-for-height were defined as stunting [22].
Results
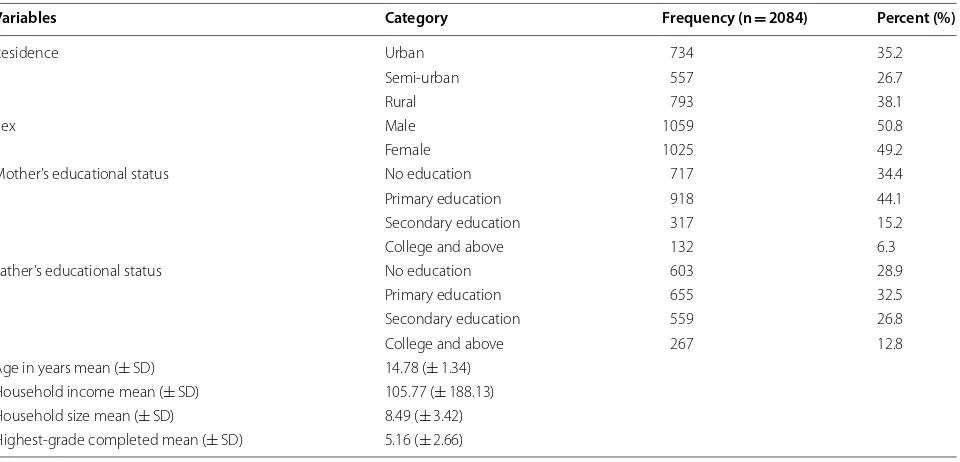
Socio‑demographic characteristics of the study participants A total of 2084 participants were interviewed: 1059 (50.8%) were boys with a mean age of 14.78 years and a standard deviation of 1.34. More than one-fourth 793 (38.1%) of study participants were reside in rural commu-nities (Table 1).
In the multivariable analysis, residence, sex of adoles-cent, and households food insecurity had significantly associated with being stunted (Table 2).
After adjusted binary logistic regression analysis, rural adolescents had 83% [AOR = 1.83; 95% CI 1.2, 3.1] higher odds of being stunted compared with those adolescents who resided in urban areas. Female adolescents had
Table 1 Socio-demographic characteristics of study adolescents in Jimma Zone, Ethiopia, October, 2015 (N = 2084)
Variables Category Frequency (n = 2084) Percent (%)
Residence Urban 734 35.2
Semi-urban 557 26.7
Rural 793 38.1
Sex Male 1059 50.8
Female 1025 49.2
Mother’s educational status No education 717 34.4 Primary education 918 44.1 Secondary education 317 15.2 College and above 132 6.3 Father’s educational status No education 603 28.9
Primary education 655 32.5 Secondary education 559 26.8 College and above 267 12.8 Age in years mean (± SD) 14.78 (± 1.34)
[image:3.595.60.540.495.726.2]98% (AOR = 1.98; 95% CI 1.6, 2.4] higher odds of being stunted compared with male adolescents. Households’ with food insecurity were 67% [AOR = 1.67; 95% CI 0.6, 0.9] more likely to be associated with stunting compared with those households which had secure foods (Table 2).
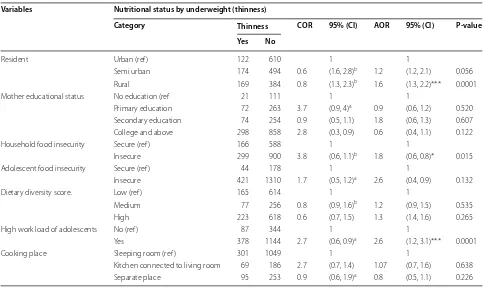
During multivariable analysis the following variables were associated with being thinness, residence, house-hold’s food insecurity and high work load of adolescents (Table 3).
During adjusted binary logistic regression analysis, adolescents who had high workloads were 2.6 times [AOR = 2.6; 95% CI 1.2, 3.1] more likely to be associ-ated with thinness compared with those adolescents who didn’t had high workloads. Household food inse-curity those insecure households had 80% [AOR = 1.8; 95% CI 0.6, 0.8] higher odds of being thinness compared with those household which secured food. Rural adoles-cents had 60% [AOR = 1.6; 95% CI 1.3, 2.2] higher odds of being thinness compared with those adolescents who resided in urban areas (Table 3).
Discussion
The prevalence of stunting was 26.1%. This finding is higher than other studies conducted in Nigeria 17.4% [23], Kenya 16.64% [24]. Discrepancy of proportions might be due to the difference in cultural, feeding habits, and environmental factors of adolescents. This may also due to economical difference among countries [25].
The magnitude of underweight (thinness) was 25.3%. This finding is higher as compared with the other stud-ies conducted in Southeast Ethiopia in 2015 13.6% [26], in Kenya 21.9% [24], and in east central Uganda [27]. The reason for the difference in the prevalence may attrib-ute from the difference in study setting in socio-demo-graphic, cultural and economic characteristics [27]. The other possible justification may result from the current focus of the Ethiopian policy towards nutrition [26].
Stunting was higher among female adolescents (23.8%) than male (21.9%), while thinness was higher among males (27.5%) than female (25.3%) adolescents. This find-ing is in line with other study conducted in West Hararge, Ethiopia in, 2015 [11] when compared between boys and girls the prevalence of underweight was higher among boys than girls (32.4% VS 10.4%). This might be due to variation of maturation time in boys and girls, for which girls reached maturation earlier than boys [11].
Adolescent stunting was significantly associated with rural residence. Being rural adolescents were more likely stunted than those urban adolescents. This finding is sim-ilar to the other studies done from India [28], in Burkina Faso [29], Nigeria [23]. Possible reason might be the fact that adolescents in the urban setting have better access for food, nutrition information and had more educated families.
Stunting is significantly associated with sex of ado-lescent. Female adolescents were approximately twice more likely stunted than their counterparts of Table 2 Bivariate and multivariable logistic regression analysis with stunting of Jimma zone, Ethiopia, (JLFSY2005-2006) (N = 2084)
* Significant results 1-reference category. Statistical significant (*p < 0.05), highly significant (** p ≤ 0.001) *** p ≤ 0.0001, * p ≤ 0.05b, p ≤ 0.25a
Variables Nutritional status by stunted
Category Stunted COR 95% (CI) AOR 95% (CI) P-value Yes No
Residence Urban (ref ) 147 408 1 1 1
Semi urban 203 529 0.9 (0.7, 1.2)a 0.93 (0.7, 1.2) 0.16 Rural 194 477 0.33 (0.8, 1.3)b 1.83 (1.2, 3.1)** 0.001 Sex of adolescent Male (ref ) 214 759 1 1 1
Female 330 655 0.5 (0.5, 0.7)b 1.98 (1.6, 2.4)*** 0.0001 Household food insecurity Secure (ref ) 198 560 1 1 1
Insecure 346 854 0.8 (0.7, 1.07)a 1.67 (0.6, 0.9)* 0.025 Adolescent food insecurity Secure (ref ) 45 160 1 1 1
Insecure 499 1254 0.7 (0.5, 1.05)a 0.65 (0.4, 0.9) 0.055 Dietary diversity Low (ref ) 203 578 1.3 1 1
Medium 92 241 0.9 (0.9, 1.4)a 1.3 (.99, 1.8) 0.067 High 249 595 0.9 (0.8, 1.4)a 0.29 (1.06, 1.6)** 0.001 High work load of adolescents No (ref ) 116 315 1 1 1
[image:4.595.62.539.112.337.2]adolescents. Similarly other study in India found that under nutrition was significantly prevalent in girls than boys [28]. Possible reason could be attributed to socio cultural influence at the early age parents give priority care for boys than girls.
Household food insecurity is significantly associ-ated with underweight (thinness) of adolescents. This finding is in line with the other studies conducted in Bangladesh [30], and in Kenya [24]. Possible reason might be due to seasonal variations within countries may affect under-nutrition, particularly stunting and underweight in Ethiopia the prior survey agreed with the long rainy season, when there is generally a lack of food at home [31].
Conclusion
In Jimma zone, southern Ethiopia significant pro-portion of underweight and stunting among ado-lescents and dietary diversity is an independent predictor. There were also identified factors associated with stunting and underweight. Thus, programmers should support adequate nutrition for adolescents.
Limitations
This study was used cross-sectional study design which can’t determine causality that means temporal sequence between exposure and disease can’t be established.
Abbreviations
AOR: adjusted odd ratio; OR: odd ratio; DDS: Dietary Diversity Score; FAO: Food and Agriculture Organization of the United Nations; FFQ: Food Frequency Questionnaire; FSNP: Food Security and Nutrition Policy; GoE: Government of Ethiopia; IDDS: Individual Dietary Diversity Score; JLFSY: Jimma Longitudinal Family Survey Youth; EDHS: Ethiopia Demographic and Health Survey; VIF: variance inflation factor.
Acknowledgements
Jimma University, College of Public Health and Medical Sciences provided the opportunity to conduct this study. We thank Dorothy L Southern for her criti-cal review of this manuscript and for scientific writing support.
Authors’ contributions
BJ and MS took part in planning the study, management quality of data, ana-lyzes the data and writing the manuscript. Both authors read and approved the final manuscript.
Funding
No funding was received for this study
Availability of data and materials
[image:5.595.56.540.110.398.2]All the data that support the findings of this study is available from the cor-responding author upon reasonable request in the form of Stata Version 14. Table 3 Bivariate and multivariate logistic regression table for thinness of Jimma zone, Ethiopia (JLFSY2005-2006) (N = 2084)
* Significant results 1-reference category. Statistical significant (*p < 0.05), highly significant (*** p ≤ 0.0001, ** p ≤ 0.001), * p ≤ 0.05b, p ≤ 0.25a
Variables Nutritional status by underweight (thinness)
Category Thinness COR 95% (CI) AOR 95% (CI) P-value Yes No
Resident Urban (ref ) 122 610 1 1
Semi urban 174 494 0.6 (1.6, 2.8)b 1.2 (1.2, 2.1) 0.056 Rural 169 384 0.8 (1.3, 2.3)b 1.6 (1.3, 2.2)*** 0.0001 Mother educational status No education (ref 21 111 1 1
Primary education 72 263 3.7 (0.9, 4)a 0.9 (0.6, 1.2) 0.520 Secondary education 74 254 0.9 (0.5, 1.1) 1.8 (0.6, 1.3) 0.607 College and above 298 858 2.8 (0.3, 0.9) 0.6 (0.4, 1.1) 0.122 Household food insecurity Secure (ref ) 166 588 1 1
Insecure 299 900 3.8 (0.6, 1.1)b 1.8 (0.6, 0.8)* 0.015 Adolescent food insecurity Secure (ref ) 44 178 1 1
Insecure 421 1310 1.7 (0.5, 1.2)a 2.6 (0.4, 0.9) 0.132 Dietary diversity score. Low (ref ) 165 614 1 1
Medium 77 256 0.8 (0.9, 1.6)b 1.2 (0.9, 1.5) 0.535 High 223 618 0.6 (0.7, 1.5) 1.3 (1.4, 1.6) 0.265 High work load of adolescents No (ref ) 87 344 1 1
Yes 378 1144 2.7 (0.6, 0.9)a 2.6 (1.2, 3.1)*** 0.0001 Cooking place Sleeping room (ref ) 301 1049 1 1
Ethics approval and consent to participate
This study obtained ethical Clearance from the Ethical Review Board of Jimma University Ethiopia and Institutional Review Board (IRB) of Brown University USA. The source of data for this research question from the baseline survey of Jimma Longitudinal Family survey of youth conducted from 2005 to 2006 after getting permission.
Consent for publication
Not applicable’ for this section.
Competing interests
The authors declare that they have no competing interests.
Author details
1 College of Medicine and Health Sciences, School of Public Health, Hawassa
University, Hawassa, Ethiopia. 2 Hossaena Town Communicable Disease
Con-trol Clinical Officer, Hosanna, Ethiopia.
Received: 15 January 2019 Accepted: 5 July 2019
References
1. Merriam Webster Dictionary. https ://www.merri am-webst er.com/dicti onary /adole scenc e. Accessed 18 Dec 2017.
2. Kettunen J. Examination of genetic components affecting human obesity-related quantitative traits (Dissertation). Helsinki: University of Helsinki; 2010.
3. Bloom D, Canning D, Sevilla J. The demographic dividend: a new per-spective on the economic consequences of population change; 2003: Rand Corporation.
4. NCD Risk Factor Collaboration (NCD-RisC). Worldwide trends in body-mass index, underweight, overweight, and obesity from 1975 to 2016: a pooled analysis of 2416 population based measurement studies in 128.9 million children, adolescents, and adults. Lancet. 2017;390:2627–42. 5. Twig G, et al. Body-mass index in 2.3 million adolescents and
cardiovas-cular death in adulthood. N Engl J Med. 2016;374:2430–40.
6. Saydah S, et al. Cardiometabolic risk factors among US adolescents and young adults and risk of early mortality. Pediatrics. 2013;131:e679–86. 7. Kozuki N, et al. Short maternal stature increases risk of
small-for-gesta-tional-age and preterm births in low- and middle-income countries: individual participant data metaanalysis and population attributable fraction. J Nutr. 2015;145:2542–50.
8. Ministry of Communication and Information Technology Federal Demo-cratic Republic of Ethiopia. Bulletin. 2014. https ://www.mcit.gov.et. 9. Alderman H, et.al. Long-term consequences of early childhood
malnutri-tion. Food consumption and nutrition division discussion paper 168, Washington, DC: International Food Policy Research Institute; 2003. 10. Mulugeta A, Hagos F, Stoecker B, Kruseman G, Linderhof V, Abraha Z,
Yohannes M, Samue GG. Nutritional status of adolescent girls from rural communities of Tigray, Northern Ethiopia. Ethiop J Health Dev. 2009;23(1):5–11.
11. Dekeba Damie T, Wondafrash M, Nigussie-Teklehaymanot A. Nutritional status and associated factors among school adolescent in Chiro Town, West Hararge, Ethiopia. Gaziantep Med J. 2015;21(1):32–42.
12. Aurino E. Do boys eat better than girls in India? Longitudinal evidence on dietary diversity and food consumption disparities among children and adolescents. Econ Hum Biol. 2017;25:99–111.
13. Ecker O, KennedyA. Making agriculture pro-nutrition opportunities in Tanzania. September, 2011.
14. Hosmer DW, Lemeshow S. Applied logistic regression. 2nd ed. New York: Wiley; 2000. https ://doi.org/10.1002/04717 22146 v.
15. Bursac Z, Gauss CH, Williams DK, Hosmer DW. Purposeful selection of vari-ables in logistic regression. 2008. http://www.scfbm .org/conte nt/3/1/17. 16. Garson GD. Testing statistical assumptions. 2012. pp. 44–5. https ://www.
stati stica lasso ciate s.com.
17. Hansen AM (2012) Goodness-of-fit tests for autoregressive logistic regres-sion models and generalized linear mixed models.
18. Ogechi UP, Chilezie OV. Assessment of Dietary Diversity Score, nutritional status and socio-demographic characteristics of under-5 children in some rural areas of Imo State, Nigeria. Malays J Nutr. 2017;23(3):425–43. 19. FAO. The state of food insecurity in the world 2010. Addressing food
insecurity in protracted crises. Roma: FAO; 2010.
20. WFP & UNICEF (2009) Summary of food security and vulnerability in selected urban centers of Ethiopia; August 2009. http://home.wfp.org/. 21. Belachew T, Hadley C, Lindstrom D, Gebremariam A, Lachat C, et al. Food
insecurity, school absenteeism and educational attainment: a longitudi-nal study. Nutr J. 2011;10:29.
22. Ethiopia Demographic and Health Survey 2011. Addis Ababa, Ethiopia and Calverton, Maryland, USA: Central Statistical Agency and ICF Interna-tional; 2012.
23. Brabin L, Ikimalo J, Dollimore N, Kemp J, Ikokwu-Wonodi C, Babatunde S, Obunge O, Briggs N. How do they grow? A study of south-eastern Nigerian adolescent girls. Acta Paediatr. 1997;86:1114–20.
24. Susan K, Guy P, Bart vdB. Household food insecurity access: a predictor of overweight and underweight among Kenyan women. Agric Food Secur. 2014;3(2):1–8. https ://doi.org/10.1186/2048-7010-3-2.
25. Nandy S, et al. Poverty, child undernutrition and which is similar to the pattern morbidity: new evidence from Indian. Bull World Health Organ. 2005;83:210–6.
26. Mohammed AY, Tefera TB. Nutritional status and associated risk factors among adolescent girls in Agarfa high school, Bale Zone, Oromia Region, South East Ethiopia. Int J Nutr Food Sci. 2015;4(4):445–52.
27. Lwanga F, et al. Food security and nutritional status of children residing in sugarcane growing communities of east-central Uganda: a cross-sectional study. J Food Secur. 2015;3(2):34–9.
28. Haboubi G, Shaikh R. A comparison of the nutritional status of adoles-cents from selected schools of South India and UAE: a cross-sectional study. Indian J Community Med. 2009;34:108–11.
29. Daboné C, Delisle HF, Receveur O. Poor nutritional status of schoolchil-dren in urban and peri-urban areas of Ouagadougou (Burkina Faso). Nutr J. 2011;10:34.
30. Choudhury KK, Hanifi MA, Rasheed S, Bhuya A. Gender inequality and severe malnutrition among children in a remote rural area of Bangladesh. J Health Popul Nutr. 2000;18:123.
31. Ali D, et al. Household food insecurity is associated with higher child undernutrition in Bangladesh, Ethiopia, and Vietnam, but the effect is not mediated by child dietary diversity. J Nutr. 2013;143:2015–21.
Publisher’s Note