Rochester Institute of Technology
RIT Scholar Works
Theses
Thesis/Dissertation Collections
5-1-1996
A Three-dimensional model of pulsatile flow at an
arterial bifurcation
Andrew Hayes
Follow this and additional works at:
http://scholarworks.rit.edu/theses
This Thesis is brought to you for free and open access by the Thesis/Dissertation Collections at RIT Scholar Works. It has been accepted for inclusion
in Theses by an authorized administrator of RIT Scholar Works. For more information, please contact
.
Recommended Citation
A Three-Dimensional Model of Pulsatile Flow
at an Arterial Bifurcation
by
Andrew R. Hayes
A Thesis Submitted
m
Partial Fulfillment
of the
Requirements for the Degree of
MASTER OF SCIENCE
IN
tvffiCHANICAL ENGINEERING
Approved by:
Professor s.
Kandlikar
(Thesis Advisor)
Professor
Alan Nye
Professor
P. Marletkar
Professor
Charles Haines
(Department Head)
DEPARTMENT OF tvffiCHANICAL ENGINEERING
COLLEGE OF ENGINEERING
ROCHESTER INSTITUTE OF TECHNOLOGY
Abstract
Atherosclerosis in
known
toform
at sites ofpredilection.These
sites aretypically
areas of reduced pressure or shear stress.In
the
thesis alink between
hemodynamics
and atherosclerosisformation
willbe
investigated. In
the
study
three-dimensional
pulsatileflow
at a simplified carotidartery bifurcation
has
been
modeled with computational
fluid
dynamics
(CFD).
A
flow
visualizationexperiment
has
alsobeen
performed on a glass replica ofthe
bifurcation
to
verify
the
CFD
results.An
intense literature
reviewhas
been
included in
the
thesisto
Title of Thesis:
..A Three-dimensional Model of Pulsatile Flow at an Arterial Bifurcation."
I, Andrew R. Hayes, hereby grant pennission to the Wallace Memorial Library of
Rochester Institute of Technology to reproduce my thesis in whole or in part. Such
reproduction shall not be for commercial use or profit.
Date: May 1996
Andrew R. Hayes
Forward
I
wouldlike
to
expressmy
appreciation andthanks to the
following
people:Dr. Kandlikar for
all ofhis
help, inspiration,
and motivationduring
this
workandthroughout
my
yearsatRIT,
Christine for her
support andcaring
whenI
wasunableto
give
her
the
time,
Preston
Blay
for his
help
and alternativeviews onthings,
andmy
parents,
Paul
andKaren,
whohave
supported andhelped
methrough
my
college career.Table
ofContents
List
ofFigures
viiList
ofTables
xi1
.Introduction
1
1
.1
Heart
Disease
1
2.
Literature
Review
2
2. 1
General
2
2.1.1 Pulsatile Flow
7
2.1.2
Anatomy
8
2
.2 Numerical
Modeling
1
0
2.3 Experimental Investigations
14
2.4
Importance
ofStudy
20
2.5
Objectives
21
3. Theoretical
22
3.1
Computational Fluid Dynamics
22
3
.2Computational
Fluid
Dynamics Model
23
3.3
Assumptions
25
3.4
Boundary
Conditions
28
3.5
Numerical Validation Analysis
29
4. Experimental Investigation
37
4.2
Experimental Procedure
41
5.
Results
andDiscussion
44
5.1 General
44
5.2 Theoretical
Results for
Clean Model
45
5.3 Theoretical
Results
for
Blockage
in
Model
84
5.4 Experimental
Results
for
Clean Model
1 19
5
.5 Experimental
Results
for
Blockage in Model
1 25
5.6 Comparison
131
6. Conclusion
134
References
136
Appendix
138
A. CFDS Command File
139
B. CFDS FORTRAN Subroutine
142
List
ofFigures:
2.1.2 I
Anatomy
ofthe
Large
Arteries
2.3. 1
Bharadvaj
et al.(1982)
Vortex Flow Pattern
3.2.1 CFD
Grid Distribution
3.5.1
90Tee-junction
3.5.2
Case
1,
CFD
Results
3.5.3
Case
1,
Work
ofKarino,
et al.3.5.4
Case
2,
CFD
Results
3.5.5
Case
2,
Work
ofKarino,
et al.4.1.1
Experimental
Setup
5.2.1 Cardiac Cycle
5.2.2
Centerline
Velocity
Vectors
at0.149s
5.2.3
Centerline
Velocity
Vectors
at0.186s
5.2.4
Centerline
Velocity
Vectors
at0. 189s
5.2.5
Centerline
Velocity
Vectors
at0.191s
5.2.6
Centerline
Velocity
Vectors
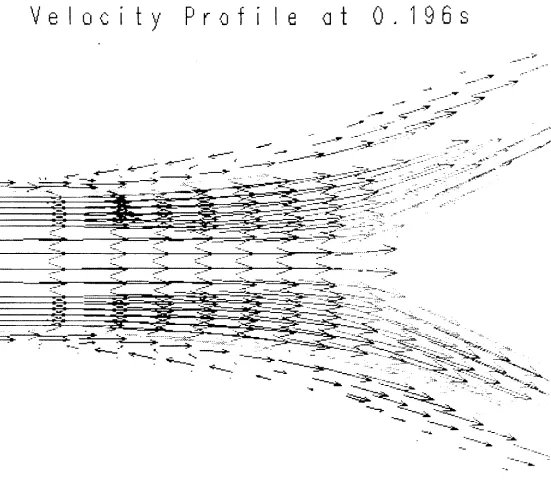
at0.196s
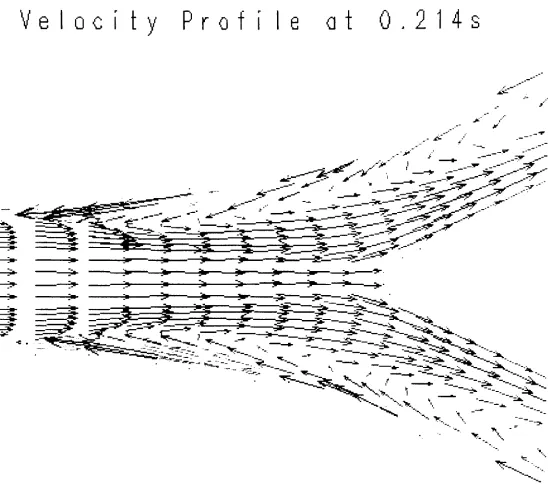
5.2.7
Centerline
Velocity
Vectors
at0. 199s
5.2.8
Centerline
Velocity
Vectors
at0.200s
5.2.9
Centerline
Velocity
Vectors
at0.203s
5.2. 10
Centerline
Velocity
Vectors
at0.209s
5.2.
1 1
Centerline
Velocity
Vectors
at0.212s
5.2.13
Centerline
Velocity
Vectors
at0.230s
5.2.
14
Centerline
Velocity
Vectors
at0.255s
5.2. 15
Centerline
Velocity
Vectors
at0.257s
5.2.16
Centerline
Velocity
Vectors
at0.263s
5.2.17
Centerline
Velocity
Vectors
at0.268s
5.2.18
Centerline
Velocity
Vectors
at0.278s
5.2.19
Centerline
Velocity
Vectors
at0.281s
5.2.20
Centerline
Velocity
Vectors
at0.290s
5.2.21
Centerline
Velocity
Vectors
at0.293s
5.2.22
Centerline
Velocity
Vectors
at0.302s
5.2.23
Centerline
Velocity
Vectors
at0.308s
5.2.24
Centerline
Velocity
Vectors
at0.365s
5.2.25
Centerline
Velocity
Vectors
at0.383s
5.2.26
Centerline
Velocity
Vectors
at0.392s
5.2.27
Centerline
Velocity
Vectors
at0.395s
5.2.28
Centerline
Velocity
Vectors
at0.410s
5.2.29
Grid
Distribution
withSites labeled
5.2.30 Shear
Stress
Plot
atSite
1
5.2.3 1 Shear
Stress
Plot
atSite
2
5.3.1 Centerline
Velocity
Vectors
withBlockage
at0. 138s
5.3.2 Centerline
Velocity
Vectors
withBlockage
at0. 165s
5.3.3 Centerline
Velocity
Vectors
withBlockage
at0. 180s
5.3.4
Centerline
Velocity
Vectors
withBlockage
at0. 192s
5.3.5
Centerline
Velocity
Vectors
withBlockage
at0. 195s
5.3.6
Centerline
Velocity
Vectors
withBlockage
at0. 198s
5.3.7
Centerline
Velocity
Vectors
withBlockage
at0.201s
5.3.8
Centerline
Velocity
Vectors
withBlockage
at0.210s
5.3.9
Centerline
Velocity
Vectors
withBlockage
at0.213s
5.3.10
Centerline
Velocity
Vectors
withBlockage
at0.216s
5.3. 1 1
Centerline
Velocity
Vectors
withBlockage
at0.219s
5.3.12
Centerline
Velocity
Vectors
withBlockage
at0.222s
5.3.13
Centerline
Velocity
Vectors
withBlockage
at0.225s
5.3.
14
Centerline
Velocity
Vectors
withBlockage
at0.228s
5.3.15
Centerline
Velocity
Vectors
withBlockage
at0.23 Is
5.3. 16
Centerline
Velocity
Vectors
withBlockage
at0.234s
5.3. 17
Centerline
Velocity
Vectors
withBlockage
at0.239s
5.3.18
Centerline
Velocity
Vectors
withBlockage
at0.250s
5.3. 19
Centerline
Velocity
Vectors
withBlockage
at0.252s
5.3.20
Centerline
Velocity
Vectors
withBlockage
at0.254s
5.3.21
Centerline
Velocity
Vectors
withBlockage
at0.258s
5.3.22
Centerline
Velocity
Vectors
withBlockage
at0.261s
5.3.23
Centerline
Velocity
Vectors
withBlockage
at0.273s
5.3.24
Centerline
Velocity
Vectors
withBlockage
at0.279s
5.3.26
Centerline
Velocity
Vectors
withBlockage
at0.363s
5.3.27
Shear Stress Plot
withOcclusion
atSite 1
5.3.28 Shear
Stress
Plot
withOcclusion
atSite 2
5.4.1 Experiment Video
Capture
I
5.4.2 Experiment
Video
Capture
2
5.4.3 Experiment Video
Capture
3
5.4.4 Experiment Video
Capture
4
5.5.1 Experiment Video
Capture,
Blockage 1
5.5.2 Experiment
Video
Capture,
Blockage 2
5.5.3 Experiment Video
Capture,
Blockage 3
List
ofTables:
I
Introduction
l.l
Heart
Disease
Heart disease
is
the
leading
cause ofdeath in
the
world today.In
a resent articlethe
Wall
Street Journal
reportedthat
150,000 Americans
die
annually
from
stroke,
aderivative
ofheart disease. Some
75%
ofthose
deaths
are relatedto
arterial occlusivedisease,
or atherosclerosis.Atherosclerosis is
a variation of atheromain
whichthe
arterialwalls thicken and
harden. Atherosclerosis
may
initiate
asearly
asthe
late
teens
orearly
twenties.
The
disease
propagates atdifferent
ratesin different
people,
depending
on numerous variables andrisk factors.
Some
ofthese
risk factors
areage,
heredity,
occupation,
generalhealth,
sex,
etc.All
the
risk
factors
do
nothave
to
be
presentconcurrently,
and no one combination offactors
is
moredetrimental
than another.Generally,
there
is
noway
to
detect
the
state of2
Literature Review
The
purpose ofthis
sectionis
twofold.
The
first
goalis
to
develop
anunderstanding
of atherosclerosis and the possiblerelationship between
disease
initiation
and
hemodynamics. The
second goal ofthe sectionis
to review some oftheimportant
published studies
in
this
area.The
focus
ofthis
review willbe
on two-dimensional andthree-dimensional
modeling
studies.Both
analytical and experimental studies willbe
reviewed.
2.1 General
In
this section,
early
papers onblood flow
andits
possible effect onatherosclerosis will
be
reviewed.The
following
papers presentthis
information in
avery
detailed
manner and are reviewedhere
in
somewhat greaterdetail.
-
Imparato
et al.(1979)
-Sigmundet.al.
(1964)
-Fry
(1969)
-Texon(1970) -Nerem
and
Cornhill
(
1 98 1
)
-Liepsch
and
Moravec
(1984)
-Harison
and
Marshall
(1983)
Atherosclerosis
is
the
fatty
degeneration
ofthe
large
arteries.At
the
earliest stageof
the
disease,
fatty
plaques,
ordeposits,
form in
the
vessel wall.These
plaquesthen
progressively
become
more pronounced andinterfere
withthe
blood flow. The inner layer
of
the
artery,
the
endotheliallayer,
is
enamciated or wornthrough, followed
by
the
deposition
of cholesterol and glyceridesfrom
the
blood
streamto the
exposed area.As
the
reduced.
The
effects ofthe
reductionin blood
supply
aredependent
onthe
particularorgan or region of
the
body
the
artery
supplieswithblood.
Imparato
et. al.(1979)
reported onthe
locations
and characteristics of plaquesfound
in
the
carotidbifurcation. The
review analyzed symptomsin
various patients andlesions
removedfrom
their carotidbifurcations.
The
plaques werefound
to
vary
considerably
from
patient to patient.However,
two
characteristics were seenin
allthe
cases.
The
typical
extent ofinvolvement
ofthe
distal
common and proximalinternal
andexternal carotid arteries was shared
by
most plaques.All
the
plaqueshad
some amount offibrous
tissue
in
their
structure.Other
thanthese two characteristics, the
plaques werelargely
different in
structure, appearance,
andformation.
Thrombus
wasfound
to
occurin
avariety
ofconditions and was eithergray, pink,
or red.
Gray
or pinkthrombus
wasfound
to
form
whileblood flow
was still rapid and wasinitiated
by
the
adherence of plateletsto the
arterialwall.The
red clot wasfound distal
andproximal
to
areas of marked stenosis orin
association withtotally
occluded arteries andwas
interpreted
by
the
authors ashaving
occurred whereblood flow had
either ceased orbecome
extremely
sluggish.The
authorfurther discovered
that
avariety
ofseemingly
unrelated pathologic events
may
contributeto the
occurrence of stenosis ofthe
carotidarteries with
the
area ofthe
carotidbulb
andbifurcation
being
mostcommonly
involved.
The
link
to the
study
is
the
fibrotic
plaqueatthe
carotidbifurcation,
whichmay
develop
in
response
to
hemodynamics factors.
Over
the
past25
years,
atremendous
amount of workhas been done in
the
area ofatherosclerosisand
the
possiblelink between
hemodynamics
andthe
disease.
The
earlieststudies were
distributed into
two
groups.The
division between
these
groups arousefrom
their
respective views onthe
mechanism ofplaquedeposition
andlocation.
One group
the regions ofthe aorta where shear stress was reduced.
The
othergroup focused
onhigh
shear regions.
Fry
(1968)
demonstrated
that
high
shear stress woulddamage
theendothelium.
Sigmund
et al.(1964)
investigated
the
link
between
turbulence and thedistribution
of atheroscleroticlesions.
They
found
turbulence
atallthe
sites ofpredilectionfor
atherosclerosis.The determination
of sites of predilection was made through arterialimaging
studies ofdisease
victims.Two
possible mechanismsfor
the
location
ofatherosclerotic
lesions
to
be determined
by
the
presence ofturbulence
wereintroduced.
The
first
relatedto
high-frequency
vibrationpossibly
having
adestructive
effect onthe
arterial wall.
This
kind
ofinjury
was suggestedto
lead
to
atype
ofhealing
in
the
arterialtissue
similarto
atheroscleroticlesion. The
second mechanism wasthe
concentration ofincreased
lateral
wall pressurein
certain areas causedby
the
presence ofturbulence.
In
the
areas of
increased
pressure atherogenesisis known
to
be
accelerated.These
areasmay
create a critical
injury
or retardthe
secretionoflipids
synthesizedin
the
arterial wall.The
effects of
the
injury
may
resultin
alocal
accumulation oflipids,
described
asthe
first
phaseof
the
pathogeneses of atherosclerosis.The
relationsbetween
turbulence
andatherosclerosis were
found
to
be
the
strongest ofany
ofthe
earlerhemodynamics factors
investigated.
Fry
(1969)
carried out experiments in-vivoto
determine
the
effects ofhigh
shearstress on
the
endotheliallayer. The
endothelial cells were seento
realignthemselves
in
the
direction
offlow
afterthe
cell orientation was altered.At higher levels
of shear stressthe
cells
may
erode,
whereas atlower
levels
the
permeability
ofthe
endotheliumincreased.
Fry
suggests a critical yield stress valueto
quantify
these
effects(see
figure).
Below
the
critical yield stress value
the
endothelialcells remainhistologically
normal.At
orabovethe
shear,
Fry
saw an enhancement of protein transport withincreasing
shear stress.As
theshear stress was
further
increased,
the erosionlevel
is
reached anddenudation
of theendothelium
invasion
anddeposition
oflipid
material,
adherence of cellularelements,
anddeposition
offibrin
occur.Fry
quotesa valuefor
the
critical yield stress of400
dynes/cm2and a value of
1000
dynes/cm2for
the
erosion stress.These
values areonly
representativedue
to the
numerousfactors
controlling
the
chemical and physical environments of theendothelium.
Texon
(1983)
discussed
the
possible mechanisms of atherogenesis.Texon
suggested a pressure
differential
leading
to
deposition.
The
area oflocalized decreased
static pressure creates a
local
suction onthe
artery
wall.The
suction resultsfrom
animbalance between
the
constant outside pressure andthe
decreasing
internal
pressure ofthe
wall.The
intima
ofthe
vesselis lifted
or raiseddue
to the
flowing
blood
uponthe
endothelium.
This
area representsthe
area ofdisease impetus.
Texon
callsthe
response a "biologic
change,
a reparative process or reactivethickening
due
to the
proliferation ofendothelial cellsand
fibroblasts
from
the
subjacentlayers."Nerem
andCornhill
(1980)
reviewedthe
interaction
ofblood flow
withthe
arterialwall.
They
describe
the
normal pressureforce acting
onthe
wall asplaying
adouble
role.The
first
role arisesfrom
the
hydrostatic
pressurebeing
higher
withinthe
lumen
of anartery
than
atits
outer surface.There
exists a potentialto
drive
abulk flow
acrossthe
endotheliumand
through the
wall.This
transfer
willbe
determined
by
the
magnitude ofthe
pressuredifference
andthe
resistance offeredby
the
arterial wall.The
second roleNerem
andCornhill
discussed
wasthe
pressure reaction withthe
arterial wallproducing
distension
orstretching
ofthe
wall.This
will produce stresses withinthe
wallthat
may
At
the time
oftheirwork,
Nerem
andCornhill
(1980)
concluded thatthere
was aninsufficient
amount of evidenceto
link hemodynamics
andlocalization
oflesions.
They
did
highlight
the
fact
that
in
allthe
investigations
regions ofarterialbranching
wereidentified
as areas where
early
lesions
occur.However,
the
exactlocation
ofthe
initial lesion
development
withinthat
region remained unresolved, withcontradictory
resultsfrom
many
studies.The
unknownfluid dynamics
ofblood flow in
these
areasis believed
to
be
partially
responsiblefor
the
incomplete findings.
Another
complicationto
the
problemis
brought
aboutby
the
extremevariationin
the
geometry
ofthe
artery
andthe
bifurcation
region
from
personto
person.The flow
patternin
one example can notbe
assumedrepresentative of
the
flow
patternin
multiple cases.Liepsch
andMoravec
(1984)
found both high
andlow
shear stressesto
be
responsible
for
the
adhesion anddeposition
ofplatelets andlipids. The
findings illustrated
the
process ofinitial blood
cellsdamage
or surface alterationin
ahigh
shearfield.
The
particles
then
have increased
adhesionwiththe
arterial wall andbegin
to
stickto
the walland
form deposits in low
shear regions.Presently,
low
andhigh
shear stresses are provento
play
a rolein
atherosclerosis.
High
shear stresshas been
provento
play
a rolein
initial depostion.
In
the
areas of
high
shearstress,
plaqueformations have been discovered
atthe
early
stagesofarterial
deposition
(Nerem
et.al.,
1993).
The
body
removesthese
plaquesthrough
naturalprocesses similar
to
mechanicalcleaning.At
alatter
stagein
the
disease,
withthe
high
shear regions
clean,
deposits form in
the
low
shear stress regions.Cell
damage
from
the
high
shear regioncreates anincrease in
the
adhesive properties ofthe
cell.These low
2.1.1 Pulsatile Flow
Atherosclerosis is
adisease
ofthe
large
arteriesproximalto the
heart.
Blood flow
in
the
large
arteries can notbe described
aslaminar
with a parabolicvelocity
profile.Instead,
the
flow is
characterizedby
avariety
of complexities.These
complexitiesinclude
the
presence of asymmetricvelocity
patternsdue
to
vesselgeometries,
turbulent ortransitional
flow,
secondary
flow
motions,
andflow
separation.In
thelarge
arteriestheflow
ofblood is
pulsatile,
orcyclic,
due
to
the
function
ofthe
heart.
As
the
left
ventricle ofthe
heart
contractsit
ejectsblood
at amaximumvelocity
into
the
aorta.At
the
end ofthe
blood
ejection phasethe
ventricle pressureis
reduced.The
aortic pressureis
then
greaterthanthe
ventriclepressure,
allowing blood
in
the
aortato
flow
back
into
the
left
ventricle.As
the
pressurein
the
ventricleincreases from
the
influx
ofblood,
the
valvebetween
the
ventricle andthe
aorta closes.The
valveclosing
creates a
higher
pressure atthe
base
ofthe aorta,
pumping
moreblood
away from
the
heart
andinto
the
systemic circulation system.As
the
pressuredecreases
atthe
base
ofthe
aorta, there
is
anotherperiod of reverseflow in
the
system.Finally,
asthe
pressure reaches2.1.2
Anatomy
In
the
thesis,
blood
flow
throughthe
carotidartery bifurcation
is
analyzed.The
carotid arteries are
the
major suppliers of oxygenatedblood
to the
brain
andhead.
There
are
two
carotid arteriesin
the
body,
located
symmetrically
about theneck,
Figure
2.1.2.1.
The
carotid arteriesbegin
atroughly
the
samelocation
on theaorta,
continueto
themiddle of
the neck,
and splitinto
the
internal
and external carotids atthe
carotidbifurcation.
The
internal
carotidartery
suppliesblood
to the
brain
whilethe
externalcarotid
artery
suppliesblood
to the
face
and scalp.An
occlusionin
either carotidartery
is
commonly
known
asapoplexy,
or stroke.In
a stroke
the
supply
of oxygenatedblood is
reduced orhalted,
resulting
in
a suddenloss
ofconsciousness,
sensation andvoluntary
movement.The
severity
ofthe
strokedepends
onthe
period oftime
an organis deprived
of oxygen.In
a stroke ofthe
external carotidartery,
depending
onthe severity, the
victimmay
suffer minimal sideeffects,
partialparalysis of
the
face,
or,
in
the
extremecase,
mortality.An
occlusionin
the
internal
carotidartery
decreases
or eliminatesblood
supply
to the
brain,
resulting in
a range of side effectsfrom
partialparalysis ofthebody
to
,in
the
most extremecase,
mortality.Harrison
andMarshall
(1983)
performedautopsy
studiesto
determine
an averagegeometry
ofthe
carotid arteries andbifurcation.
The
common carotidartery
wasdetermined
to
be
7.6
mm(1.64 mm) inner
diameter. The
internal
carotidartery
wasdetermined
to
be
5. 1
mm(1.1 mm) inner diameter
withthe
sinusbeing
8.3
mm(
1
.95mm) inner
diameter. The
angle ofbifurcation,
orthe
angledividing
the
internal
andexternal
carotids,
wasfound
to
be
36.4_
Internal
Carotid
External
Carotid
Common Carotid
Artery
Aorta
2.2
Numerical
Modeling
In
thissectionthefollowing
papers onnumericalmodeling
oftwo-dimensional andthree-dimensional
bifurcations
willbe
reviewed:-
Fernandez
et al.
(1976)
-Chang and
Tarbell
(1985)
-Rindtetal.
(1987)
-Rindtetal.
(1990)
-Nazemietal.
(1990)
-
Baaijens
et al.(1993)
Two-dimensional
andthree-dimensional
modelshave been
investigated.
The
two-dimensional
modelshave
givenlimited
insight into
the
problembecause
oftheir
simplifications ofthe
flow field. At branches
or curvesin
the
flow
field,
secondary
flow is
created.These secondary
flows
are not presentin
atwo-dimensional
model.In
athree-dimensional
modelthe
flow field is
better
simulated,
withthe
entire phenomena present.Fernandez
et al.(1976)
studiedthe
pulsatileflow
of aNewtonian,
incompressible
fluid
through
atwo-dimensional
symmetricbifurcation. The
authors utilizedthe
Marker
andCell
numerical
technique to
solvethe
equations ofcontinuity
and motion.The
results of thestudy
show recirculation at
the
nondivider wallin
the
daughter
branches
andhigh
shear stress values onthe
divider
walls.The
position ofthe
high
shear stress values was not changed withthe
pulsatileflow
pattern.Due
to the
two-dimensional simplification ofthe study,
nosecondary flow
wasdetermined,
andthus
no zones ofstagnationwerecalculated.The
authorsdetermined
the
presence anddisappearance
of separation atthe
nondividerwall as
the
pressureforcing
function
goes throughthe
cycle.As
the
Reynolds
numberincreases,
the recirculation area
increases
in
size.As
the
Reynolds
numberdecreases,
the
recirculation zonedecreases.
The
pressure values aroundthe
stagnation point onthe
nondivider wall weredetermined
to
be
1.7
times the
pressure values atthe
boundary. The
authors note that thispressure
difference
couldbe
ofimportance in
evaluating
the
impaction
mechanismfor
walldamage.
Variable
shear stress values were also calculatedfor
this
area ofthe
daughter
branch,
with
high
shear stressfound
onthe
divider
wall.To
further
understandthe
flow field development in
the
carotidartery bifurcation
region,
areview on pulsatile
flow
through
curvedtubes
is included.
Chang
andTarbell
(1985)
employednumerical methods
to
model pulsatileflow
through
a curved tube.The
authorsfocused
onthe
secondary flow
field
atthe
curvature section.The
results ofthe
study
showthe
presence ofup
to
seven vortices
in
the
secondary
flow
structure atthe
curve.These
vortex patterns show vorticeswithin
vortices,
representing
ahighly
complexflow field
atthe
curved section ofthe
tube.In
the
secondary
flow
areasthe
authors calculatedthe
shear stress valuesto
be
equal orgreater
than the
shear stress valuesfor
the
axial component ofvelocity
for
the
flow field.
In
pulsatile
flow
the
peakwall shear stressis
atthe
inside
wall ofthe curve,
withthe
highest
shearstress
occurring
atthe
outside wallfor
steady
flow.
In
the
pulsatileflow
study
reverseflow
wascalculated at
the
inside
wall ofthe curve,
implying
an area of recirculationis
presentfor
someduration
ofthe
cycle.Rindt
et al.(1987)
studied atwo-dimensional,
rigid
model ofthe
carotidbifurcation.
In
the
study
the
authors performedexperimentalanalysis aswell as numerical.A
numerical methodbase
on
Galerkin's finite
element method was utilizedto
solvethe
continuity
andNavier-Stokes
equation.
In
the
study
the
authorsused a sinusoidal pulseto
modelthe
pulsatileinlet
flow,
wherethe
Reynolds
number variedfrom
250
to
770.
The
authorsdetermined
high
velocity
gradientswere present
along
the
divider
wallsofthedaughter
branches
andlarge
zonesof reverseflow
nearthe
nondivider walls ofthese
branches. The
extent ofthe
reverseflow
region variedstrongly
withtime.
There
washigh
shear stress atthe
divider
wallthroughout the
entirecycle,
withlow
andfluctuating
shear stress onthe
nondividerwallin
the
carotid sinus.Nazemi
et al.(1990)
solvedthe
Navier-Stokes
equationsfor
pulsatilelaminar flow in
atwo-dimensional
rigid bifurcation.
The
authorsincluded
the
carotid sinusin
their carotidbifurcation
model.The
numerical model was ableto
createdeposits in
the
area wherethe
local
shear stress values
fell
within a predetermined critical range.The
results ofthe
study
showrecirculation zones at
the
divider
walls,
in
the
early
stages ofthe cycle,
and atthe
nondivider wallsat
the
latter
stages.In
the
region ofthe
carotid sinusthe
authorsfind
separationin
the
accelerationphase of
the cycle,
and recirculationwiththe
deceleration
ofthe
inlet
velocity.The
plaquedeposition
modelin
the
study
found
3
possible sitesfor
deposition,
the
sinus atthe
upperwall,
onthe
lower
nondividerwall,
andthe
upperdivider
wallnearthe
end ofthe
sinus.The
authors comparedtheir
numericaldeposition
regions with actualhuman
angiograms andfound
good agreementbetween
the two.
Baaijens,
et al.(1993)
performed a numerical analysis onthe
steady
flow
ofNewtonian
and non-Newtonian
fluid in
a two-dimensional model ofthe
carotidbifurcation.
In
the
study
the
authors employed a
finite
element modelto
solvethe
Navier-Stokes
equations.The Reynolds
number was set equal
to
300,
the
typical value atthe
end ofthe
diastolic
phase ofthe
cardiaccycle.
With
aNewtonian
fluid
asthe
working
mediumthe
authorsfound
the
velocity
patternin
authors
determined
the
presence ofreverseflow.
The secondary
velocitiesin
the
region are anorder of magnitude greater than
the
secondary
velocitiesin
the
mainbranch. When
the authorsrepeated
the
calculations withthe
non-Newtonianfluid
criteriathe
samevelocity
pattern wasdetermined
in
the model,
but
the
magnitudes ofthe
Velocity,
secondary
velocities, andthe
shearstresses were
5
to10
%
less,
indicating
the
Newtonian
assumptionintroduces
on minimal errorinto
the
calculation.In
the
external carotidbranch,
branch
withoutsinus, the
authorsfound
no reversalin
flow.
Negative secondary
velocities werefound
in
the
region.Low
shear stresses were also calculatedin
the
external carotid.For
the
calculations with non-Newtonianfluid,
thevelocity
values wereagain
determined
to
be
slightly
lower
than the
Newtonian
model,
withthe
pressure valuesbeing
slightly higher
in
the
non-Newtonian model.The
authorsdetermined for large
valuesofthe
length
divided
by
radius ratiothe
differences
between
the two
modelsdecrease.
The
authors summarizethe
study
by
stating
that the
Newtonian
fluid
model gives goodresults.
The
velocity
magnitudes areslightly higher
thanthat
for
non-Newtonianfluid,
but
the
velocity
patterns are similar.The Newtonian
model also yieldsslightly
larger
recirculation zonesthan
those
for
non-Newtonian models.These
statements are validatedby
comparison withpreviously
published experimental studies.2.3
Experimental
Investigations
In
thissection,
early
papers on experimentalinvestigations
ofblood
flow
willbe
reviewed.The
following
papers represent an overview oftheprevious work performed and are reviewedin
detail.
-
Fukushima
and
Azuma
(1982)
-
Motomiya
and
Karino(1984)
-Bharadvaj
et al.(1982)
-Fukushima
et
al.(
1987)
-
Singh
etal.
(1990)
-Liepsh
andMoravec
(1984)
-Rindtetal.
(1988)
-
Walburn
andStein
(1982)
-Rindtetal.
(1988)
Fukushima
andAzuma
(1982)
investigated
the
secondary flow fields
generatedin
modelsof
stenosis,
bifurcation,
andbranchings due
to
asteady flow.
The
authorsfound
that
fluid
particlesflowing
in
the
center ofthe
maintube
nearthe
wallturn
in
the
vicinity
ofthe
apex ofthe
bifurcation
andtravel
into
the
branches
swirling
spirally.The
highest
pressureis found
atthe
apexof
the
bifurcation.
The resulting
pressuredifferential
in
the
region aroundthe
apex produces avortex
flow
muchlike
the
horseshoe
vortexfound in flow
over a cylinder.The
vortex extendsto
the
outer walls ofthe
bifurcation
which arelow
pressure regions and generatesswirling flow in
each
daughter branch. The
authorsfound
similar vorticesin
flow
through
a90
degree
Tee-junction.
Motomiya
andKarino(1984)
investigated
the
flow
patterns and shear ratedistributions
in
branching
arteries withrigid
walls and comparedthe
resultsto
clinical studies on atherosclerosisand
thrombosis.
Due
to
a new method ofblood
vessel preparation which allowed vesselExact
flow
patterns andvelocity distributions
were viewed withthe
aid offlow
particlesflowing
through transparent
blood
vessels.Steady
flow
wasanalyzed at variousReynolds
numbers andflow
rate ratios.The
authorsfound
a recirculation zone atthe
internal
carotidartery
sinus.The
formation
and size ofthe zonewas
largely
dependent
onthe
flow
rateratio,
with minimaldependence
onReynolds
number.At
aflow
rate ratio ofQ\IQq
=0.65
(Qj
is
the
external carotidflow
rate,
internal)
arecirculation zone was
determined
in
the
internal
carotid sinus atReQ
=170.
The
recirculationzone grew
in
sizewithincreasing
Reg,
but
remainedin
the
sinus.At
Rec
=800,
the
recirculationzone
decreased in
size as acounter-rotating helical flow developed
downstream
from
the
stagnation point.
In
the
external carotid recirculation wasonly
found
whenthe
external wasextremely
occluded(Q\IQq
=>0.8).
Thus,
a continuous recirculation zone existsin
the
internal
carotid sinus under normal physiological
flow
conditions,
orRe0
=600.
At
the
time,
the
existing
data
onatheroscleroticplaqueformation indicated
the
high
occurrence offormation in
the
internal
carotid
artery
atthe
sinus.Further study
reveledthe
plaqueslocalized
onthe
lateral
and outerwalls of
the
internal
carotidartery
in
the
region offlow
separation, reversal,
andlow
wall shearstress,
emphasizing
the
importance
oflocal flow
patternsin
the
carotid sinusin
atherogenesis.Bharadvaj
et. al.(1982)
studiedsteady
flow
through
a generalized carotidbifurcation.
The
working
modelbifurcation
wasfabricated from
glass withthe
geometry
determined
by
statisticalanalysis of angiograms.
Reynolds
numbers of400,
800, 1200,
and1400
in
the
common carotidwhere studied with
varying flow
rate ratios throughthe
daughter branches. The
working
fluid
studied was
water,
withhydrogen bubbles
utilizedfor flow
visualization.At
a givenflow
rate,
the
authorsdetermined
the
location
ofthe
separation zone movesupstream with
decreasing
flow
through theinternal
carotidartery,
while at afixed
ratio offlow
rate
it
moves upstream withincreasing
Reynolds
number.The
flow from
the
maintube
impinges
on
the
divider
creating
an area ofhigh
shear stress.On
the
nondivider wallsthe
flow
decelerates,
as
in flow in
a curvedtube,
and createslow
shear stress andsecondary
flow.
The
Secondary
motion was
detected in
the
area of a three-dimensional stagnationline. This secondary
motion,
along
with the axialflow,
leads
tohelical
pathsfor
the streamlines oftheflow
field,
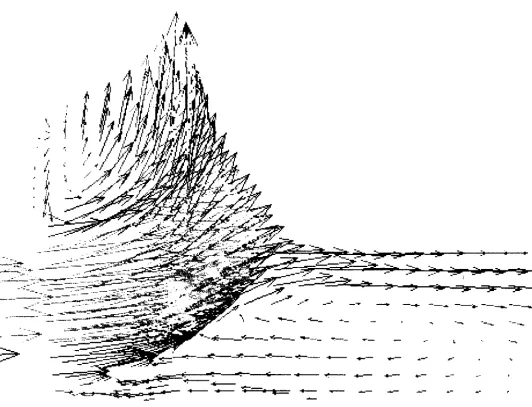
seeFigure
2.3.1.
Fukushima
et. al.(1987)
performed anin depth
study
onthesecondary flow in steady
andpulsatile
flow
through a symmetricalbifurcation.
The
modelbifurcation
was arigid
walled,symmetrical glass
Y.
The working fluid for
the
investigation
was water and a water-glycerinmixture.
To
minimizethe
opticaldistortion
ofrefraction,
the model was placedin
a transparentchamber
filled
withthesameworking
fluid. Dye-injection
and aluminumparticles,
20
micrometersis
diameter,
were utilizedfor
visualization oftheflow
patterns.The
characteristics ofthe
steady flow in
the
modelbifurcation
werefound
to
be dependent
on
Reynolds
number andflow
ratiobetween
parent anddaughter
vessels.The secondary
flow
pattern was seen at
Re0
above500. Initial
flow
separation occurred atRe0
of about1490
whenthe
flow
ratesin
both daughter branches
was equal.With
unevenflow
ratesin
the
daughter
branches,
separationoccurred atlower
Re0
Increasing
the
Re0
with unevenflow
rates madethe
swirling
secondary flow
unstableand produce an almostturbulent
flow
effectin
the
model.Mean
Reynolds
andWomersley
numbers of1890
and20,
305
and8.9,
and133
and5.4
were studied
in
the
pulsatileflow
analysis.The
Womersley
numberis defined
by
tube
radius,
fundamental
angularfrequency
ofthe pulse,
andkinematic
viscosity.The
secondary flow
wasmostly
observedin
the
decelerating
phase and notduring
acceleration.The
secondary flow
produced a net reversal
flow from
the
apexto
the
parent vessel onthe
nondivider wall sides.A
stagnation point
is
produced whenthe
back flow
meetsthe
forward
flow in
the
parent tube.The
aluminum
dust in
the
working
fluid deposited
onthe
wall surfaceby
gravitationalforce. The
deposited
particles movedslowly
on the wall withthe
flow
and accumulated on an area oflow
shear.
These
areas are coincidental withthe
sitesofatheroscleroticlesions
in humans. The
authorsuggest particles such as
platelets,
leukocytes,
and erythrocytesplay
animportant
rolein
atherosclerosis.
Singh
et. al.(1990)
performed a multiangle visualization offlow
patternsin
arterialsecondly flow
- waH
layar
ZZZ
frea
stream
Figure 2.3. 1
Bharadvaj
et al.(1982)
Vortex
Flow
Pattern
diameter,
0.8
cmdaughter
branches,
and angle ofbifurcation
equal to60 degrees.
Visualization
was performed with an
ink
injection
technique whilerotating
the model to photograph athree-dimensional
flow field. The Reynolds
numberfor
theflow
was equalto
297,
andequalflow
ratioswere allowedthrough
the
daughter
tubes.The
authors'results support
the
findings
ofFukushima
et. al.(1987)
andWalburn
andStein
(1982).
The
flow
pattern showsthe
horseshoe
vortex asdescribed. The
dye
injection
method allowed
for secondary
motions visualizationalong
the
outer wall ofthebifurcation,
alsoas
previously
seen.Rindt
et al.(1988)
investigated
the
flow
field in
steady
flow
with equalflow
rate ratiosthrough
a carotidbifurcation. This
modelis
a more accurate representation ofthe
actualgeometry
than that
of symmetricalbifurcations,
due
to the
inclusion
ofthe
carotid sinus.The
sinusis
abulb
at
the
beginning
ofthe
internal
carotidartery,
just
afterthe
bifurcation
region.The
authors studiedthe
steady
flow,
Reynolds
number equalto
480,
through the
bifurcation. The
parabolicvelocity
profile
from
the
mainbranch
continues aboutthree-quarters
ofthe
way
in
the
bifurcation
region.Then
the
velocity
increases
atthe
divider,
anddecreases in
the
area ofthe
nondivider walls.In
thesinus
region,
reverseflow in
seen onthe nondiver wall side ofthe
bifurcation. The
reverseflow
continues until
the
diameter
ofthe
sinusbegins
to
decrease
andform
the
internal
carotid artery.As
the
diameter
decreases,
the
nondivider wallflow begins
to
accelerateforming
a region of equalflow
onboth
the
divider
and nondivider sides ofthe
artery.No
recirculationis
seen onthe
nondivider wall side of
the
external carotid artery.In
this region, the
flow does
notdecelerate
enough
to
create recirculation.The
maximumflow is
onthe
divider
wall side ofthe
artery,
asin
the
internal
carotid artery.The
authorsdetermined
the
secondary
flow in
the
common carotidartery
to
be low
untilthe
area ofthe
bifurcation
wherethe
diameter
begins
to
increase. As
the
artery
widensthe
secondary flow increases
towards the
external carotid.In
the
internal
carotidartery
the
secondary
velocity
goestowards the
nondivider side.In
the
region ofthe
sinus closestto the
bifurcation,
velocities.
Further downstream in
the sinus,
secondary
flow
velocitiesdecrease
nearthe
divider
wall and
increase
near the nondivider and adjacent walls.Secondary
flow in
this regionis
causedmainly
by
curvature effects and shows avortex withits
center shiftedtowardsthe
nondivider wall.About half
way
into
the
sinus a stagnation pointis
observed nearthe
divider
wall.The
secondary
flow is
a maximum atthe
adjacent wall near nextto
the
stagnationpointAs
the
sinustapers
into
the
internal
carotidartery, the
secondary
flow increases in
the
direction
ofthe
center of thebranch.
At
the
beginning
ofthe
externalbranch
thesecondary
flow forms
avortex.Fluid flows
from
the
nondividerwallto the
divider
wall andthenreturnsalong
theouter radius ofthe artery.The
changesin
the
secondary flow further down
the
external carotid arelimited,
and nostagnation
is detected.
The
secondary
flow
was seento
affectthe
flow
throughthe
sinus.In
atwo-dimensional
study, the
secondary flow is
not present.Thus,
any
effectsfrom
secondary
flow
onthe
mainflow
field
arelost
in
two-dimensional
analysis,
limiting
the
usefulness oftwo-dimensional
studies.2.4
Importance
ofStudy
Atheroslerotic lesions form
at sites of predilectionin
the
large
arteries.These
sitesare
typically
areasofbranching,
bifurcation,
andtaper.
At
thesis sitesthelateral
pressureis
decreased
due
to
a combination ofthe
geometry
ofthe
vessel andthe
blood flow
characteristics.
By
analyzing
the
normalflow
patternthrough
anartery,
information
canbe
gained as
to
thenormal,
orhealthy,
pattern ofblood flow in
the
region.Then
by
examining
the
flow
patternin
anartery
ofanunhealthy
individual,
the
detection
ofany disturbances
in
the
flow field
may
lead
to
earlierdiagnosis
andtreatment.2.5
Objectives
The
hypothesis
ofthe
hemodynamic influence
on atherosclerosisis
detailed in
theliterature
review.The
shear ratevariation and particle stagnationis
believed
to
be
one ofthe
majorfactors in
the
role of atherosclerosisinitiation.
The
objects ofthe
present workare as
follows:
1
To
modelthe
90tee-junctionflow
visualizationstudy
ofKatrino, Kwang,
andGoldsmith
using
acommercially
available computationalfluid dynamics
softwarecode,
CFDS-FLOW3D,
asverificationofthe
code.2.
To
develop
atransient
fluid flow
modelto
simulatethe
flow
ofblood
atthe
carotidartery
bifurcation.
3.
To
generate resultsshowing
the
flow
field,
including
flow
reversal andrecirculation,
~and
the
shear stress variationduring
onecomplete cardiac-cycle.4.
To study
the
flow in
the
carotidartery
bifurcation
after ablockage
has
formed
upstrearrtof
the
bifurcation
5.
Develop
an experimentalflow
loop
to
modelthe
pulsatile^low of waterthrough
asimplified carotid
artery
bifurcation.
6.
Capture
the
flow field from
the
experiment withhigh
speed videoto
determine
the
flow
recirculations and reversals.7.
Conduct
the
experimentalflow
study
withablockage
in
the
mainbranch
ofthe
modelupstreamof
the
bifurcation,
and capturethe
results withhigh
speed video.3 Theoretical
3.1
Computational Fluid Dynamics
The
thrust
ofthe
study
was performed withComputational
fluid
dynamics (CFD).
All CFD
analysisin
the thesis
was performedutilizing
the
commercial software packageCFDS-FLOW3D.
This
software packageis
afinite
control volumefluid dynamics
solver.CFD
analysisinvolves
discretization
ofcomplex geometriesinto
small quadrilaterals.The
software allows
the
userto
setthe
boundary
conditionsfor
the
new geometrieswith eitherconstant values or
FORTRAN
subroutine.After
the
boundary
conditions areset, the
relevant equations are solved
for
each new geometry.The
equations usedin
the
analysis arethe
continuity
equation^-+V-(p[/)=0,
(3.1)
and
the
momentumequation^-+V-(pUU)=B+V-a,
(3.2)
at
where
B
is
the
body
force
and ais
the
stresstensora =-pd +n(yU-KVUf).
(3.3)
The CFD
codehas
the
optionto
solveturbulence
viathe
k-E
model or variationsof
the
Reynolds
stress modelfor
turbulence.In
this
study
the
averageReynolds
numberis
The
software results canbe
outputin
the
form
of vector plots, concentrationgradients,
or numericaltabulation.
In
the
resultssections, vector plotsand numerical tablesare presented.
3.2
CFD Model
A
simplified carotidartery
bifurcation
was studied withthe
previously
statedassumptions.
The daughter
branches have
equalinner
diameters,
branching
off thecenterline of
the
maintube.
The
maintube
expandsinto
the
daughter
branches in
a smoothtransition.
This
geometry
is
symmetric aboutthe
centerline.The
flow
ofblood
atthe
bifurcation is
transient
withsecondary
flow
playing
akey
rolein flow
field
development.
It
is
this
secondary
flow
that
limits
the
accuracy
oftwo-dimensional,
or symmetrical analysis.The
model studied wasthree-dimensional and symmetric aboutthe
centeraxis.The bifurcation
was constructed of8
blocks,
orlarge
quadrilaterals.The
actualbifurcation
regionis
comprised of3
blocks.
Two
blocks
openinto
the two
daughter
branches,
andthe third
forming
the
divider
wall.Each
daughter
branch
was modeledwith1
block, beginning
atthe
specificinner bifurcation block
opening
andbranching
off at25
degrees
to the
centerline.The
maintube
consisted of3
blocks. These
blocks
alljoin into
the
3
bifurcation
blocks. The
maintube
had
a sufficientlength
asto
allowfor
fully
developed flow
atthe
bifurcation.
The
modelbifurcation
was created withthe
CFDS-FLOW3D
Preprocessor,
calledSophia. The first
step
in
creating
the
bifurcation
modelin Sophia
wasto
input
geometricalpoints
that
form
the
corners ofthe
blocks
ofthe
model.These
points werethen
connectedwith arcs
forming
faces.
Two
faces
are connected withfour
lines,
thuscreating
aquadrilateral,
orblock.
Sophia
createsblocks
having
straight edgesTo
create roundededges
the
square edges are projected ontothe
previously
created arcsby
the
process ofmapping.
After
mapping
ofthe
blocks
was completethe
block
wasin
its finished
form.
Four
more points wereinput into Sophia
andthe
process was repeatedto
form
an adjacentblock
to the
onealready
created.This
process was repeatedfor
the
3
blocks
forming
themain
branch
ofthe
bifurcation.
The
processinvolved in
building
the
3
blocks
ofthe
bifurcation
regionwas muchmore complicated.
The
3
faces from
the
ends ofthe
mainbranch
blocks
were used asstarting
pointsin
the
construction.To
create aface
joining
the
bifurcation
region with adaughter
branch
the
points mustbe determined
that
will createthe
25
degree departure
angle of
the
daughter branch.
Arcs
arethen
drawn
withthese
pointscompleting
the
face
joining
the
bifurcation
regionwiththe
daughter branch. Five
points werethendetermined
to
createthe
decrease
in
inner
diameter
ofthe
maintube
atthe
bifurcation
region.These
points were
then
joined
with splines.The
straight edges ofthe
squareblock
representing
the
bifurcation
region were then mappedto
the
splines.Creating
the
smoothtransformation of main
branch
to
daughter
branch.
This
process was repeatedfor
the
remaining
junction
of mainbranch
to
daughter
branch.
The
middle section ofthe
bifurcation
region ends with an arced surfaceopening
away
from
the
mainbranch.
The
arc was constructedto
create a smoothtransition to the
The
bifurcation geometry
wasbroken down
into
8,
000
cellsfor
the analysisThe
grid
distribution is
shownis
Figure 3.2.1. The
celldistribution for
the mainbranch
is
coarse at
the
inlet,
becoming
finer
approaching
the
bifurcation.
In
the
region of thebifurcation
the
celldistribution is
very
fine.
The
flow field in
this
areais
critical,
so the griddistribution is
very
fine for increased
accuracy
andto
eliminateany
griddependence
onthe
flow field.
In
the
daughter
branches,
the
celldistribution
is
a geometric progression.The
cell
distribution is finer
atthe
base
ofthe
branch
wereaccuracy
is
critical.Further down
the
daughter
branch,
nearthe outlet, the
celldistribution is
more sparsein
an effortto
savecomputational
time
incurred
by
unnecessary
computation.3.3 Assumptions
Due
to the
difficulty
in
handling
blood
outsidethe
body,
certainassumptionshave
been
madein
the
study.The first
assumptionis
to
considerblood in
the
large
arteries acontinuous
fluid.
Blood
is
composed ofplasma, platelets,
and red and white cells.The
redblood
cells arethe
most abundant cellsin
the
blood.
However,
the
red cells aretypically
only 8
micrometersin diameter. There
arefewer
whiteblood
cellsin
the
blood,
but
arethe
largest
ofthe
solidparticles,
with adiameter
ofbetween
10
to
20
micrometers.The
commoncarotid
artery
typically
has
adiameter
of about8
millimeters,
about200
times the
diameter
of a whiteblood
cell.Therefore,
the
continuousfluid
assumptionis
acceptablein
blood
in
alarge
artery.Blood
is known
tobehave
as a non-Newtonianfluid.
The study
focuses
onlarge
arteries
only,
in
whichthenon-Newtonian effectsplay
a minimal rolein
thefluid
dynamics
Therefore,
blood
may
be
assumedtobehave
as aNewtonian
fluid in
the study.Blood
plasmais
the
major component of wholeblood.
Plasma
consists of almostentirely
water.Therefore,
withthe
aboveassumptions, the
flow
ofwateris
modeled torepresentthe
flow blood in
large
arteries.The
walls ofthe
arteries aredistensible,
or compliant.The
distensibility
of theartery
wallsacts as adamper
to the
pulsatileflow. The
walldamping
actsto
eliminatethe
pulsatile nature of
blood
flow,
slowly changing it
to
steady
flow
asit
goes through thesystemiccirculation.
In
the
arteriesfurthest from
the
heart
the
oncepulsatileflow
ofblood
is
steady.The
veins are return vesselsin
the
circulation system.The flow
ofblood is
steady in
the veins,
with valvesstrategically
formed
throughout the
vesselsto
eliminateany
reversal offlow.
Atherosclerosis
is
notfound
the
veins,
thus
supporting
the
hemodynamic
effectshypothesis.
In
the
thesis,
the
walls ofthe
arteries are assumedrigid,
forgoing
the
distensibility
characteristics ofartery
walls.This
assumption willhave
aneffect on
the
flow
pattern,
but it is
unknownif
the
addedcomplexity
from
the
distensibility
factor
willamountto
a comparableincrease in
accuracy.Finally,
the
geometry
ofthe
bifurcation
has been
assumedsymmetric,
both
daughter branches
being
equalin
diameter. The
bifurcation
angleis
50,
atypical
value.The
mainbranch
ofthe
bifurcation
is
8
mmin
diameter,
andthe
daughter
branches
are5
mm
in diameter.
Throughout
the
study
only
equalflow
ratesthrough the
daughter
branches
are allowed.This
assumption allowsthe
flow
patternto
develop
in
the
bifurcation
without theinfluence
of adominant flow
branch.
Thus,
allowing
a cleardepiction
oftheflow
field,
eliminating
aboundary
conditiondependence.
3.4
Boundary
Conditions
The
CFD
program allowsthe
userto
setboundary
conditionsby
calling
subroutines at
the
appropriate section ofthe
code.The
inlet
condition onthebifurcation
is
the transient
output ofthe
heart,
the
cardiac cycle.The
cycle was modeledby
aFORTRAN
subroutine(
see appendixB ). In
the
subroutinethe
period ofthe
cycleis
setat
0.8
seconds.The
heart
output as afunction
oftime
is
approximated overthis
cycle.As
the
CFD
software solvesthe transient simulation, the
subroutinefor
the
velocity
at theinlet is
calledto
determine
the
inlet
boundary
condition.Only
equalflow
ratesthroughthe
bifurcation
are studiedin
the
analysis.The
outletboundary
conditions onthe
daughter
branches
are setto
equal pressureboundaries
to
create
the
equalflow
rates.All
otherboundaries
are solidwalls,
in
conjunction withthe
rigid
artery
wallassumption stated earlier.In
the
second section ofthe
analysis a25%
occlusionis
setin
the
mainbranch
ofthe