Rochester Institute of Technology
RIT Scholar Works
Theses
Thesis/Dissertation Collections
2007
Images in Electronic Performance Support Systems
(EPSS): An Eye Tracking Study
Niyati N. Bedekar
Follow this and additional works at:
http://scholarworks.rit.edu/theses
This Thesis is brought to you for free and open access by the Thesis/Dissertation Collections at RIT Scholar Works. It has been accepted for inclusion
in Theses by an authorized administrator of RIT Scholar Works. For more information, please contact
Recommended Citation
Images
in
Electronic Performance Support
Systems (EPSS):
An
Eye
Tracking
Study
By
Niyati N. Bedekar
Thesis
submitted
in
partial
fulfillment
of
the
requirements
for
the
degree
of
Master
of
Science
in Information
Technology
Rochester
Institute
of
Technology
B.
Thomas
Golisano
College
of
Computing
and
Information
Sciences
Rochester Institute of Technology
B. Thomas Golisano College
of
Computing and Information Sciences
Master of Science in Information Technology
Thesis Approval Form
Student Name:
Niyati Bedekar
Thesis Title:
Images in Electronic Performance
Support Systems (EPSS): An Eye
Tracking Study
Thesis Committee
Name
Signature
Evelyn Rozanski
Evelyn Rozanski
Chair
Anne Haake
Anne Haake
Committee Member
Keith Karn
Keith Karn
Committee Member
Thesis Reproduction Permission Form
Rochester Institute of Technology
B. Thomas Golisano College
of
Computing and Information Sciences
Master of Science in Information Technology
Images in Electronic Performance Support
Systems (EPSS): An Eye Tracking Study
I, Niyati Bedekar, hereby grant permission to the Wallace Library of the
Rochester Institute of Technology to reproduce my thesis in whole or in part.
Any reproduction must not be for commercial use or profit.
Abstract
Current
forms
of onlinehelp
areincreasingly
making
use ofimages
(graphical
illustrations
orphotographs),
along
withtextual
instructions
to
effectively
assist usersin
performing
a specifictask.
Users
typically
wantto
accomplishtasks
quickly
anddevote
limited
attentionto
help
systems.Hence,
it is
essentialthat these
images facilitate
efficient
understanding
ofthe task
athand
andcomplementthe
instructions
well.The
first
goal of
the
projectwasto
create quick andinexpensive images
that
workbetter
than
or aswell as
existing
graphicalillustrations. The
second goal wasto
conduct ausability
test
with eye
tracking
to
compareguidance ofvisualattentionby
three
types
ofimages:
graphic
illustrations,
digital
photographsand modifieddigital
photographs.During
the
test,
otherkey
measureslike
success rates andtime
ontask
were alsomeasured.Subjective
preferencesfor
the
three types
ofimages
werealso evaluated.Results
indicated
that the
modifiedphotographs performedbetter
in
guiding
the
visualattention of users
to the
relevantareas ofthe
image
than
the
othertwo
image
types.
Though
notstatistically
significant, the trend
showedthat task
completiontimes
for
tasks
with
the
modified photographswereshorterthan those
withthe
otherimage
types
(i.e.,
tasks
with modifiedphotographswerequickerthan those
with otherimage
types).
Subjective
ratingsindicated
that
participants preferred photographs and modifiedAcknowledgements
I
wouldfirstly
like
to thank
my
committeemembers,
Dr. Evelyn
Rozanski,
Dr.
Anne Haake
andDr. Keith Karn
for
their
continued support and guidanceduring
this
project,
andfor
providing
me anopportunity
to
workin
the
exciting
field
of eyetracking.
I
wouldalsolike
to thank
Dr. Robert
Parody
for his
unending
help
in
the
statistical analysis
done for
the
study.I
wouldlike
to
expressmy
gratitudetoward
Dr. Pelz
for his
help
wheneverI
had
questions
regarding
the
eyetracking
equipment.Thanks
to
Leanne Stefano (Visual
Perception
Lab)
for her
help
withRITCode.
Thanks
to
Brian Ashbaugh for
being
such a wonderful"hand
model"for
allthe
photographs used
in
the
study
andfor
being
such a greathelp during
the
entire study.Thank
youDr. Peter Anderson
for providing
the
HP
printer usedin
the
study.A
special note ofthanks
goesto the
faculty,
staff and students ofthe
CASCI Lab
for
letting
meborrow
the
coffee maker(sometimes
during
peakhours)
andthe
vacuumcleaner used
in
this
study.I
amdeeply
gratefulto
my
friends
andfamily
for
their
supportand enthusiasm.My
greatestthanks to
my
parentsfor
endlessly supporting
mein
whatI did
andalways
encouraging
meto
strivefor
the
best.
Aai-Baba,
thank
youfor
everything.Last
but
notthe
least,
I
wouldlike
to thank
my
fiance,
Shrikant
for his keen
interest in
the
project andfor
standing
by
methrough
allthe temperamental
mood-swings
I
had
during
the
courseofthe
study.Thank
youall,
Table
of
Contents
LIST OF FIGURES
iii
LIST
OF TABLES
vCHAPTER 1
-Introduction
1
CHAPTER 2
-Background
5
2. 1 Eye Movements
andImages
6
2. 2 Images
andEPSS
-7
2. 3 Motivation for
the
study
9
2.4 Aim of
the
study
12
CHAPTER 3
-CurrentProject Introduction
14
3.1 Problem
Statement
14
3.2 Artifacts
14
3.2.1 Products
14
3.2.2 Types
ofImages
18
3.2.3 The Performance
Support Systems
21
3. 3 Hypotheses
24
3.4 Methods
25
3.4.1 Participants
25
3
.4.2Apparatus
andTesting
Environment
25
3.5 Measures
27
3.5.1 Independent
andDependent
Variables
27
3.5.2 Variables
to
be Controlled
32
3.
6 Experimental Design
33
3. 7 Procedure
34
CHAPTER 4
-Results
& Data Analysis
36
4.1.1
Hypothesis
1: Question 1
36
4.1.2 Hypothesis 1: Question 2
38
4.1.3
Hypothesis 1:
Question
3
40
4.2
Hypothesis 2
43
4.2.1
Hypothesis
2: Question 1
43
4.2.2 Hypothesis 2: Question 2
44
4. 3
Subjective Rankings
46
CHAPTER 5
-Conclusions & Future
Considerations
48
5. 1
Conclusions
48
5. 2 Future
Considerations
49
REFERENCES
51
APPENDICES
54
A.
Experimental Design
Details
54
B.
Raw Data for
the
Participants
55
C. ANOVA Results & Descriptive
Statistics
64
D. Project Documents
91
a.
Informed Consent Form
91
b.
Script
93
c.
Post-test
questions95
d.
Scenarios
96
List
of
Figures
Figure
1.1
Snapshot
of anHTML-based EPSS for
anHP
inkjet
multifunction officemachine
2
Figure 1.2 Snapshot
of aPDF-based EPSS
for
aDirtDevil
vacuumcleaner2
Figure 2.1 Eye Movements
for
the
same subjectviewing "An Unexpected
Visitor"
by
I.E.
Repin
6
Figure 2.2 Aggregated
eyefixations from
131
subjectsviewing Paolo Veronese's Christ
addressing
aKneeling
Woman
12
Figure
3.1 HP Inkjet Multifunction
Office
Machine
15
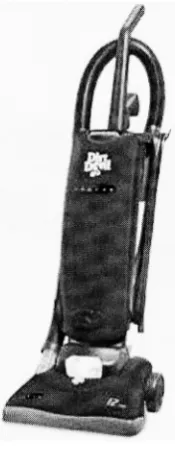
Figure 3.2 DirtDevil Vacuum Cleaner
15
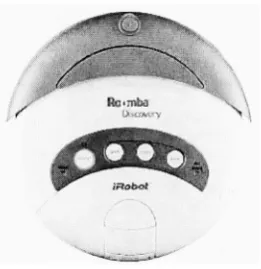
Figure 3.3 Roomba Robotic Vacuum Cleaner
16
Figure 3.4 Epson
82c Projector
16
Figure 3.5 Braun Tassimo
Coffee Maker
17
Figure 3.6 Xerox M750 Inkjet Printer
17
Figure
3.7a Example
for
Existing
Illustration (DirtDevil vacuum)
18
Figure 3.7b Example
for
Photograph (DirtDevil vacuum)
18
Figure 3.7c Example for Modified Photograph (DirtDevil
vacuum)
19
Figure
3.8 The
three types
ofimages
in
the
context of a given productEPSS
22
Figure
3.9 Administrator Table
in
the
Eye
Tracking
Lab
26
Figure 3.10 ASL 501 Head Mounted Eye Tracker
27
Figure
3.1 1 Areas
ofinterest
(AOI)
asdisplayed
in
allthe three
image
types
28
Figure 3.12 Example
of ablow-out diagram in
the
existing illustration
ofthe
HP
inkjet
multifunction office machine
29
Figure 3.13 AOIs
asindicated
by
the
red circlesin
a photograph(P)
ofthe
HP
inkjet
multifunction officemachine
29
Figure 3.14
AOIs
asindicated
by
the
redcirclesin
a modifiedphotographofthe
HP
inkjet
multifunction office machine29
Figure 4.1 Graph showing
the
mean proportion oftime
users spentlooking
atthe
areas ofinterest
(AOIs)
withrespectto the
entiretime
spentlooking
atthe
images
(AOI/Image)
for
allthree
image
types
37
Figure 4.2 Graph showing
the
mean proportion oftime
users spentlooking
atthe
areas ofinterest
(AOIs)
withrespectto the total time
spent onthe task
(AOI/Total Time
ontask)
for
allthree
image
types
40
Figure 4.2 Graph showing
the
mean proportionoftime
users spentlooking
atthe
areas ofinterest
(AOIs)
withrespectto the total time
spent onthe task
(AOI/Total Time
ontask)
for
allthree
image
types
42
Figure 4.4 Graph showing
the
meantimes
with standarderrorbars
for
successfultask
completion
by
productandimage
type
45
Figure 4.5 Histogram showing
subjective rankings46
List
of
Tables
Table 3.1 Example
for
the three types
ofimages for
all six products23
Table 3.2
Participant
numbersdistributed
among
product andimage
type
cells33
Table
4.1 Means
andStandard
Deviations
for
AOI/Image
for
allthree
image
types
...37
Table
4.2 Means
andStandard Deviations for
AOI/Total Time
ontask
for
allthree
image
types
39
Table 4.3 Means
andStandard
Deviations for AOI/Instructions
for
allthree
image
types
41
Table 4.4 Success Rates
43
Table A.l Task
orderfor
the
eighteen participants54
Table B.l Raw
data for
participant1
55
Table B.2 Raw
data for
participant2
55
Table B.3 Raw
data
for
participant3
56
Table B.4 Raw
data for
participant4
56
Table B.5 Raw data
for
participant5
57
Table B.6 Raw
data for
participant6
57
Table B.7 Raw data
for
participant7
58
Table B.8
Raw data
for
participant8
58
Table
B.9 Raw
data
for
participant9
59
Table
B.10 Raw
data for
participant10
59
Table B.l 1 Raw
data
for
participant11
60
Table B.l 2 Raw
data for
participant12
60
Table B.14 Raw
data for
participant14
61
Table
B.l 5 Raw
data for
participant15
62
Table
B.16
Raw
data for
participant16
62
Table B.l 7 Raw data
for
participant17
63
Chapter
1
-Introduction
Electronic Performance
Support Systems
(EPSS)
are systemsthat
providetraining
to
improve
performance.It
is
akind
ofhelp
referenced whileperforming
atask.
Examples
include
help
accessed whenassembling
anewproduct,
working
with a new softwareapplication or
troubleshooting
a product.Earlier,
performance support systems werepaper-based and
largely
textual
in
nature.Over
time,
the
medium changedfrom
paperto
the
electronicformat,
however
the
systems remainedtext-based.
Research
has
shownthat
such
form
oftextual
help
is
generally
ineffective
andtends
to
hinder
ratherthan
help
the
user's performanceof
tasks
(Carroll
&
Mazur, 1986;
Cohill
&
Willages,
1985;
Dunsmore, 1980;
Sellen &
Nicol,
1990).
Today,
images
are an essential part ofany
help
system.
Electronic
forms
ofhelp
systems(PDFs
orHTML pages)
are a mix oftext
andimages. To
consider an exampleofEPSS,
Figure 1.1
shows a snapshot of anHTML-based
EPSS for
anHP
inkjet
multifunctionoffice machine andFigure 1
.2 shows an4&'
HPOffkefcl Dft<J7100 S^i I** RepUritigthfi{'lirttlwrtdiorInkCartridges-MozilfoFfrefox Ffe Ed* isw Htjtwy goofciMitj Took. Pjsip
J
''[^f^//,t.:/5<^<%20Wt.kjTJ'ow.:t%^
CCuttofrnreWj3Fi-^Ho'.m^ Widow* M^iketptac*PjWindows
- ^ jj
HP OfficeJet D
and7100 Series
-Replacing
thePrintheads
orInk Cartridges
Introduction
This documentprovidesinformationonhow 10replace a ink cartridge
Anmkcartridge needsreplacingwhen a(roni-paneldicpls.)messageindicateseither:
Lewinklevels
ink cartridgeapproachingeapiralianonto
Replacingtheinkcartridges
Foilcrwihe instructions below toreplaceIheinlcartridges
1 Turnnnthe unit,and openIhepnnl-camage acrei?doorbyliftingIhehandleuntil(he door locksmlo place
Flyurst:Openingtlii>accessdoin
7 Thepnnicamaga will move to ihecenter oftheunil
[image:15.547.55.493.66.342.2]FivJ: rask, p*tfi>7ii y*,-f Previous..;)l^rW^[jMat#iW
Figure 1.1
Snapshot
of anHTML-based
EPSS
for
anHP
inkjet
multifunction office machineAdobeRadi-[OlifDevHHHti*l piH] V-. .<& <**** Dooment Tool* Window nd$
J[t.?w-| $HH-" Iff**
iai.lililiIHH!l!I.IIB;li'.I.W,tM:IJJI,Wi',Uil
TFS=^
ne>LACEME(a i ... n MmT"BMr
sunj8
vj'
'
^iwafc>*.&w!i>l<lfci;. wd DisputetfMdkl L> up TofMnnu iwcW yusitu<va Ptafei r.-av*j!i: s. rwnv*twJiimij
kr^<niis.,Uftroa(*8writfl
V ^
u$j
T 1PE?
nttmmw* wt
Mitel
VH.I3-:*
(JiwIMr"f 1O.Viiflfi
\t$)acro;3tewitMitch t*tfW*ttN
tieitob enfamat*to**aCvn-j
Wit Ctri(.hMKlPlWSrrnilF0* f1**'
GENERAL MAINTENANCE
vw*Nfcft KOIXE THE<W> <*HMffflWHMWMMflTS-UMPUU8 BEFOREiBHKNs OfiSfflOMwvaj;v.L;!Hirtt.^mayflM;
'.1)Mfcw+iN>*'iV-w.;.'':-::lit'"<>jji-iOffain! imelu iiwjfcjCfattiiimw iuieitijPj-^e 5
WtP&jee"HOS(SSfiUBLfl
\i i SoflS
IIMHiill;liB!N,'.!.W,tM!lril,Wa.'.
Tf>
mcxK'reptawSrai
loci mlo ri>:*.
TROUBLESHOOTING GUIDE
.Ti<:.r:,-J.h:t vffF.;i'i UHPUJi.'ILCiUCt' &""'.E^:;l
posammimw
fWi :<.i.lr..inri:',[iji>fi i?
Tliviirt[.'(.".UadsSM i^nr^4bMipwurt
lllY! Pi:-iV.',rrtill.'ifl-jII
it-) piivtogbAoim
fat-N1*1
f>^aa sauTiw
f...l'..,4'-j.b.J!.F!i. S. B*i*jtbitP]ft
R.!-r..v.?: .:*o-t.N ri.'i
fJ-i>M-Pi6&M
iitUit*j^vlfailrJlM-Pga
Rf*flfKipeft>M trl
ih.ft
MtuHUuriP|C
[image:15.547.62.490.382.652.2]7^1-In iirvtn ot.foIr
Studies
have
shownthe
importance
ofusing
a combination oftext
and stillimage
(Fischer, 1996; Spangenberg,
1973)
to
aidin
performing
atask.
LeFevre
andDixon
(1986)
suggestedthat
userspreferredto
follow
visual examplesratherthan
readinstructions. Graphics
provides an additionalway
ofrepresenting information
andthey
help
provide a more accurate mental representation ofthe
procedure withinthe
user'sconceptual model.
Harrison
(1995)
suggested:The
useof
visuals within on-linehelp
instructions
for
computer-based proceduresenabled adult subjects
to
perform more procedural stepsin
less
time
and withfewer
errors
than
subjects who received no visuals within on-linehelp
instructions
(p. 89).
Visuals
alsohelp
eliminate orientation problems(Stone &
Glock,
1981). This
becomes
particularly
important
when users work with physical products.Badgett
andSandler
(1989)
concludedthat
one remembers pictures morethan
words andthus,
introducing
graphicsin
any
documentation
may increase
the
likelihood
ofretentionby
the
users.A
stillimage
provides great supportfor
textual
information.
However,
it
is
important
to
useimages
relevantto tasks
underconsideration.Faraday
andSutcliffe
(1998)
suggestedthe
use of'contact
points,'
features
embeddedin
the text to
help
userseasily
locate
relevantinformation in
acorresponding
image.
Some
forms
ofimages,
like
graphicalillustrations,
arespecifically
intended
to
emphasize
the
essentialareas ofthe
image
relevantto the task
athand
whilesuppressing
details
that
shouldnotdistract
the
user'sattention.Such
illustrations
are moreaesthetically pleasing
andmay
guidethe
user more clearly.However,
it is difficult
andsuch
illustrations
andhence
the
process ofmaking
effectiveillustrations
becomes
extremely
labor-intensive
andtime-consuming.
Since
digital
photographsare cheaperto
producethan
hand-drawn
illustrations,
somedevelopment
teams
usephotographs ratherthan
illustrations.
The drawback
ofusing
photographsis
that
extraneousdetail
may
distract
the
userfrom
the
mostrelevant partsofthe
image.
For
this
study
we considered anotheralternative:photographs,
modified
in
someway
to
help
focus
the
user's attentionto the
essential parts ofthe
image.
The
aims ofthis
project wereto
create such modifiedphotographs,
based
on proven principles ofhuman
visual attention and comparethe
performance ofthese
modified photographs
to
both existing
graphicalillustrations
and unmodified photographsusing
eyetracking
methods.More
specifically, the
objectivefocuses
onlearning
whether modified photographsbetter direct
visualattentionto task-relevant
parts ofthe
image
andChapter
2
-Background
Current
theories
of visual perceptionhold
that two types
of mechanisms guidethe
human
visual attention:
bottom-up
andtop-down.
The
bottom-up
mechanismis
stimulusdriven
-attention
is
involuntarily
directed
to the
salientfeatures
ofanimage
that
pop
out(e.g.,
abright
spot against adark background
or a spot of red against abackground
of green).The
top-down
mechanismis
goaldriven
-attention
is
voluntarily
directed
to
objects ofimportance
to the
observerbased
on atask
(e.g.,
whenlooking
for
asetof carkeys,
aperson
looks
in
placeshe
or shelast
remembersplacing
them).
Both
bottom-up
andtop-down
processesarethought to
influence
eye movementssimultaneously
though
somebelieve
that top-down
processes provide greaterinfluence
(Chen
&
Zelinsky,
2006).
Visual
attentionhelps
usfocus
onrelevantinformation
quickly
and efficiently.Eye
movements
play
animportant
rolein
ourunderstanding
ofhuman
visual attention.At
ahigher
level,
eye movements canbe described
as a combination offixationsandsaccades.
Fixations
occurwhenthe
eye restson a spatiallocation in
ascene,
typically
over aminimum
duration
of100-200mS
(Jacob
&
Karn,
2002).
To
re-orientto
otherlocations
ofinterest
in
the scene, the
eye makes rapid movements called saccades.Monitoring
eyemovementsduring
atask
can give us abetter insight into
the
cognitive
processes
taking
placein
the
observer's mind.Though
eyemovements
cannotcompletely
2.1 Eye Movements
and
Images
Buswell
(1935)
providedthe
first detailed
analysis of eye movements whileviewing
apicture.
In
the
study consisting
of255
people,
Buswell
observedthat
peopleshowedtwo
types
of eye movementbehavior
-a gener-al
survey
ofthe
image
and a moredetailed
inspection
of smaller regionsin
the
image.
He
also observedthat
peopletend to
focus
their
attention onforeground
objectslike faces
than the
background
objects.Babcock,
Pelz
andFairchild
(2003)
also corroboratedthis
whenthey
observedthat
peoplefocused
attention
towards
faces
and more semanticfeatures
of animage.
Yarbus
(1967)
concludedthat
eyes weredirected
to
regionsthat
were most"useful
oressential'
to
perception.He
also showedthat
eye movementsgreatly
variedbetween
free
viewing
of animage
and whenpeoplewere askedto
performtasks
onthe
image.
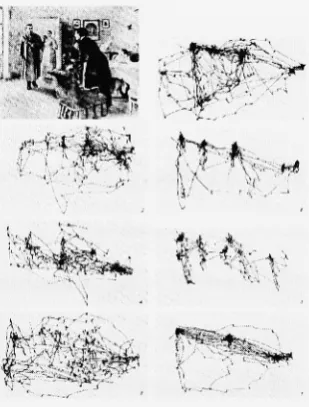
Figure 2.1
Eye
Movements
for
the same subjectviewing
animage
entitled"An
Unexpected
Visitor"
[image:19.547.197.352.399.603.2]Figure
2.1 illustrates
the
eye movementsofthe
same subjectviewing I.E.
Repin's
"The Unexpected
Visitor."As
indicated in
Figure
2.1,
eye movementsfor
the
subjectgreatly
variedbetween
free-viewing
ofthe
image
and whenhe/she
wasgiven specifictasks
withthe
image.
In
general,
whenthe
subjects wereasked specific questions aboutthe
image,
the
eyes concentrated on areasofthe
image
most relevantto the
question(e.g.,
when asked
to
guessthe
ages ofthe
peoplein
the picture, the
eyesfocused
onthe
faces
ofthe
peoplein
the
image).
Following
this,
Mackworth
andMorandi
(1967)
showedthat
observerswerelikely
to
fixate
onthe
mostinformative
regionsin
animage
withinthe
first
two
secondsof
viewing,
implying
that
initial
exposurefrom
the
periphery
provides enoughinformation
to
focus
onthe
mostinformative
regions of animage
early
on.Henderson
and
Hollingworth
(1998)
showedthat
fixations
to
a particular part ofthe
image
areguided
due
to
semanticinformativeness
ofthat
region ratherthan the
structuralinformation
inhenrent in
the
image.
2.2 Images
and
EPSS
The
aim ofanElectronic
Performance
Support System
(EPSS)
is
to
aid usersin
performing
their
tasks
easily
andefficiently
while alsoincreasing
productivity.
Images
become
avery
essential part of such a system.Booher
(1975)
concluded
that
images
areappealing
asthey
arerelatively
easy
to
process andlarge
amounts
ofinformation
canbe
conveyedin
asmall space.Thus,
using
images
reduced cognitiveload
andimproved
retention.
Stone
andGlock
(1981)
studiedassembly
tasks
andfound
that
introducing
tasks
withproducts,
it is
essentialthat
users who are newto the
productorientthemselves
correctly
whileusing
the
product and performthe task
effectively
as
wellas efficiently.Meij
andGellevij (2004)
suggestedthat
every
task
in
a procedure shouldbe broken into
sub-tasks or goals and
there
shouldbe
alogical connectivity between
images
andthe
corresponding
text.
Faraday
andSutcliffe
(1998)
suggestedthe
use ofcontact pointsbetween
the text
andimages
so asto
direct
the
attentionofthe
userto the
partin
the
image
most relevantto the
currenttextual
instruction.
Glenberg
andLangston
(1992)
concludedthat
when appropriategraphicsaccompany
text,
usersmentally
representthe
procedureby
combining
the two
media.This study
promotedthe
use ofimages
withtext
in
proceduralinstructions
sinceimages
helped build
mental modelsamong
users.Yoon
andNarayanan
(2004)
performedan eyetracking
study
with90
subjectssolving
two
problems,
one with adiagram
associated withthe
text,
the
otherwithablank
display.
The
results showedthat
42%
ofthe
subjectsscanned
the
display
to
visually
solvethe
problemthus
showing
that
information displays
that
alignthemselves to
the
user's attention pattern arelikely
to
resultin better
task
performance.
Images
are usefulonly
whenthey
are meaningful and relevantto the text
andtask
being
performed.Cater,
Chalmers
andWard
(2003)
observedthat
users exhibitinattentional
blindness
(i.e., they
focus
ononly task-related
objects
in
animage
andrarely direct
their
attentionto
otherirrelevant
semantic
features in
the
image).
They
built
a
rendering
methodthat
reducesthe
quality
ofthe
image in
partsunrelated
to their
assigned
task
sothat the
users aredirected
only
to the
relevant
areas.Since
the
human
exploit
this to
reducethe
quality
ofthe
partsofthe
image
that
appearin
the
periphery
without
affecting
the
visual processing.2.3 Motivation
for the study
Graphic
designers
developing
illustrations for
productElectronic Performance Support
Systems
(EPSS)
have
the
difficult
task
ofabstracting
images
to
emphasize or preservesome qualities while
suppressing
the
irrelevant
partsin
such away
that
users aredirected
to the
most relevant and useful regions ofthe
image. The
processgenerally
involves
studying
the product,
working
withthe product,
consulting
withthe
design
engineers andthen
developing
the
illustrations
-hand-drawn
or
machine-generated,
whilealsoconsidering
the orientation, size,
etc.Since
this
processis
notstandardized,
skilleddesigners
are neededto
develop
illustrations
andthe
processis
extremely
time-consuming
andlabor
intensive.
The
motivationfor
this
study
was adesire
to
address agraphic
design
problemfor
the
Xerox Industrial Design
/
Human Interface Department
(Rochester,
NY). The
problem wasto
determine
if
images developed
with alower
costmethodcould
direct
usersto the
most relevantareas ofthe
image
aswell ashand-drawn
illustrations.
Displaying
computationally
intensive
graphicslike flight
simulators
orscientific
visualizationsrequiresconsiderable
rendering
power.Baudisch
(2003)
discusses
anumberof
rendering
methodsthat
addressthe
demand for
rendering
power anddisplay
resolution
by
considering
user'sfocus
ofattention.These
displays
also called attentivedisplays
aredesigned
to
expend computationalresources whereits
neededthe
most andsmall part of a
display
at atime,
the
display
is
renderedto
enhancedetail in
that
areawhile
suppressing
extraneousdetail.
Gaze-contingent
displays
(Reingold,
Loschky,
McConkie &
Stampe,
2002)
apply
blurring
to
reducethe
details in irrelevant
parts of animage.
We
considered such a method ofblurring
to
help
reduce unrelateddetails in
ourmodified photographs.
After
carefulreview,
wedecided
againstit
since such animage is
likely
to
cause confusionamong
usersdue
to
orientation problemswhenusing
productssince
that
information
willbe lost due
to
blurring.
Gooch, Sloan, Gooch,
Shirley
andRiesenfeld
(1999)
developed
a computer-based non-photorealistic(NPR)
systemthat
produces
interactive
technical
illustrations
that
build
on established principlesin
traditional
art as well as geometric modeling.This
systemtakes
into
considerationshadows and
lighting
to
emphasize specific regionsin
the
image.
Agrawala
etal.(2003)
developed
a systemthat
providestools
for
building
effectiveassembly
instructions.
The
systemconsists of a.planner
that
searchesfor assembly
sequences and apresenterthat
renders a
diagram
for
eachstep
ofthe
sequence.However,
computer-generatedrenderings or automatic methods
to
createrendering
affect animage
globally.There
is
some manual
intervention
requiredto
detail
areas of potentialimportance
to the
observer.Santella
andDeCarlo
(2002)
developed
a non-photorealisticrendering
(NPR)
systembased
onhuman
visual perceptiondriven
by
eyetracking
data. The
subjectis
askedto
look
at aphotographfor
a givenamountoftime.
The
fixation data
collected
during
eyetracking
is fed
to the
system and apainterly
rendering
is developed emphasizing
the
areas
that
receivedmorefixations
whileremoving
details from
the
areasthat
receivedlittle
orno attentionat all.
Thus
the
resulting image
best describes
the
regions ofinterest
according
to the
observer.Another
system(DeCarlo &
Santella, 2002)
creates
arendering based
online
drawing
and uniform regions of color.However,
such systemsare not suitable
for EPSS images
sincethe
resulting
image is
morelike
apainting
withlarger brush
strokesresulting
in
the
deletion
of some vital productdetails in
the
image
needed
by
users as referencesduring
tasks.
In
addition,
computer generatedrendering
is
still
in
adeveloping
phaseand such systemstend to
requirecomputationally
intensive
resources.
Artists
have
long
usedluminance
andhighlighting
as away
to
direct
the
viewer'sattention
towards the
regions ofinterest.
In
this way, the
artist reducesthe
sceneto the
most essential elements
thus
reducing
cognitivedemand
while alsoaiding understanding
of
the
image.
This
was supportedin
an eyetracking
study
by Wooding
(2002).
The
study
showedthat the
subjectsdirected
their
attentiononly
onthe
two
main charactersin
the
image
(see Figure
2.2)
whilethe
remainder ofthe
image
wasleft
largely
unnoticedFigure
2.2
Aggregated
eyefixations from
131
subjectsviewing Paolo Veronese's Christ
addressing
aKneeling
Woman
2.4 Aim
of
the
study
In
previousstudies,
highlighting
was usedto
emphasizethe
areas ofinterest for
tasks
involving
image
viewing
alone.Our study
takes this
notionfurther
to
addressthe
issues
when
tasks
areinvolved,
notdirectly
withthe
image
(e.g.,
countthe
number of redballs
in
the
image)
but
tasks
involving
the
interaction
with products whileusing
images for
reference
(e.g.,
productassembly,
productmaintenance,
etc.).The
aims ofthe
study
aretwofold:
1
)
Create
quick andinexpensive
graphics suchthat
they
do
the
job
(direct
attention
to
relevantparts ofthe
image)
better
than
or as well asexisting
[image:25.547.75.475.69.365.2]graphical
illustrations.
Since
digital images
arecheaperto produce,
it is
natural
to
modify
the
digital
photographto
enhancethe task-relevant
regionsin
the
image
whilesuppressing
the
irrelevant
parts withoutnegatively
affecting
the
overall comprehension ofthe
image.
2)
Use
eyetracking
to
compare user performance whileusing
three
types
ofimages
-the
existing
illustration in
currentEPSSs,
adigital
photograph(that
willserve as a
baseline),
andthe
modified photograph createdduring
the
first
phase.
The
following
chapterswilldiscuss
the
methodology
usedin
the study, the
eyetracking
instrument,
the
testing
environment, observations,
conclusionsdrawn from
the
Chapter 3
-Current Project Introduction
3.1 Problem Statement
Companies
that
produceElectronic Performance Support Systems
(EPSS)
are concernedwith
time
and expenses requiredto
createhand-drawn
illustrations. To
that
effect,
this
study
is
tries to
addressthis
issue
withthe
following
goals:1)
Reduce
the time
requiredto
createimages
suchthat the
resulting
images
workas well as or
better
than
existing
graphicalillustrations.
2)
Utilize
eyetracking
to
comparetask
performance whileusing
three types
ofimages: existing
graphicalillustration,
original photograph and modifiedphotograph.
3.2 Product
and
Image Types
3.2.1 Products
Six
productswerechosenthat
had
existing EPSSs
including
both
text
andgraphical
illustrations
.We
chose productsthat
wouldbe
novel enoughthat the
user wouldlikely
need need
to
referencethe
EPSS
to
completespecifictasks
withthese
products.
The
participants performed real
tasks,
interacting
with each product whileusing
the
EPSS
associatedwith
the
product.The
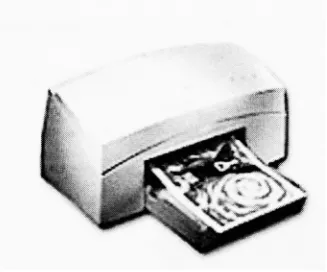
six products usedwere:1)
HP OfficeJet D135 Inkjet Multifunction Office Machine
-print, copy,
scanand [image:28.547.208.332.147.259.2]fax (see Figure
3.1)
Figure 3.1 HP Inkjet Multifunction
Office
Machine
2)
DirtDevil
Jaguar Vacuum Cleaner (see Figure
3.2)
[image:28.547.223.311.378.607.2]3)
iRobot Roomba Discover Automatic Robotic Vacuum Cleaner (see Figure
3.3)
>c
f
[image:29.547.219.350.150.285.2]m,
# #
Q;
Figure 3.3
Roomba Robotic Vacuum Cleaner
4)
Epson 82c Projector (see Figure
3.4)
i
'*# %
Figure 3.4 Epson 82c Projector
[image:29.547.196.359.429.524.2]5)
Braun Tassimo Coffee Maker (see Figure
3.5)
[image:30.547.262.384.145.301.2]"&.
Figure 3.5 Braun Tassimo Coffee Maker
6)
Xerox M750 Inkjet Printer (see Figure
3.6)
[image:30.547.241.405.421.557.2]3.2.2 Types
of
Images
Three
types
ofimages
were usedin
the
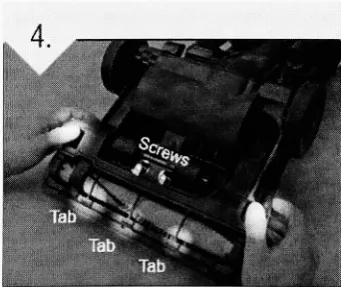
study:1) Existing
Illustration: A
hand-drawn
or machine-generated graphicalillustration
with
task-relevant
parts ofthe
image highlighted using
colordifferences
or arrowswith orwithout
labels
(see Figure 3.7a).
Figure
3.7a Example
for
Existing
Illustration (DirtDevil
vacuum)2)
Photograph: Digital
photographwith no additionalhighlighting
of relevantdetails. These
photographsweretaken
from
viewpointresembling
asclosely
aspossible
to the
originalimage (See Figure 3.7b). Some
considerationsfor
arrowsand
labels
arediscussed
in
the
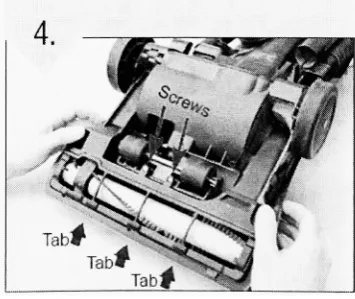
next section. [image:31.547.206.376.202.343.2] [image:31.547.206.384.505.654.2]3)
Modified Photograph: Modified digital
photographusing
aspotlighting
effectto
highlight
the
most relevant partsofthe
image
(parts
ofthe
image
mostlikely
to
help
the
userto
performthe
task)
anddarkening
the
areasirrelevant
to
the task.
For
example,
in
Figure
3.7c,
the
step
requiresreplacing
the screws,
inserting
the
guard
in
the
lower
three tabs
andthen
pressing
the
sidetabs to
secureit.
Only
these
areas arehighlighted
asthey
are relevantto the
user whiledarkening
(but
not
completely eliminating)
the
irrelevant
partsofthe
image,
sincethey
canbe
referenced
by
the
usersfor
productorientation.More
recently,
Holman,
Vertegaal,
Sohn
andCheng
(2004)
used such atechnique
for
a concept calledattentive art.
They
usedaGaussian luminance filter
to
highlight
the
areas ofinterest based
onthe
observer's eyetracking
data
anddarkening
the
irrelevant
parts.
The
softwarecontinuously
processesthe
image
increasing
the
luminance
overareas
that
receive morefixations
whilefading
away
partsthat
receivelittle
orno attention.
All
the
images
werecreatedusing Adobe
Photoshop
CS2
by
overlaying
partially
transparent
(Alpha=0.5)
circular gradient(Gaussian
filter)
layers
overthe
relevantparts of
the
unmodifieddigital
photograph.J%-^
i
...1330 ;>$'::., WkWk
**.
w
Tah
[image:32.547.198.369.508.651.2]
-w
Considerations:
The
following
points weretaken
into
consideration whenthe
photograph and modifiedphotographs were
developed:
1)
The
size and orientation would remainthe
same asin
the
originalillustration.
2)
Arrows
were usedin both
photographs and modified photographsonly
if
they
were used
in
the
existing
illustration
to
indicate
movement.3)
If
arrows were usedto
highlight details in
the
existing
illustration,
such arrowswere replicated
in
the
photographonly
if labels
accompaniedthem.
Arrows
without
labels
andthat
did
not show movement were notreplicatedin
the
photographs.
For
the
modifiedphotograph, the
spotlighting
technique
was usedto
highlight
relevantregions ofthe
image if
the
originalillustrations
made use ofcolor cues
to
highlight
task-relevant
details.
In
cases wherethe
originalillustration
made use of arrowsto
detail
relevantareas, the
modified photographreplaced
the
arrowswiththe
spotlightand replicatedlabels
only
if
presentin
the
original
illustration.
One
reasonto
eliminate suchdetailing
arrowsin
modifiedphotographs was
that
this
wouldreducethe
overall noisein
the
image
and reducethe
cognitiveburden
to
processthe
arrows andthen
direct
attentionto the
objectpointed
to
by
the
arrow.4)
Ifthe
originalillustration
consistedofablow-out diagram
to
zoominto
the
details,
this
wasnotconsideredwhendeveloping
the
otherimage
types.
One
reasonwas
that the
aim ofthe
study
wasto
examineif
inexpensive
graphics
did
an equal or
better job
than the
originalillustration
withoutexpending
too
muchtime
developing
these
images.
3.2.3 The Performance
Support Systems
The existing Electronic Performance Support Systems
(EPSS)
help
documentation
consistedof a mix of
text
andimages.
Two
ofthem
wereHTML
pages(HP Printer
andBraun Tassimo Coffee
Maker)
while others were(DirtDevil
Vacuum,
Roomba
Vacuum,
Epson Projector
andXerox Printer). For
the
existing HTML
pages,
original
illustrations
were replacedby
photographsto
create one versionandby
modifiedphotographs
to
createthe
second.For
the
manuals,
they
were convertedto
HTML
pages.The PDFs
werefirst
converted
to
aPNG
image
andthis
image
was embeddedin
anHTML
page.In
this
casetoo,
two
more versions weredeveloped,
one with photographs andthe
other withmodified photographs.
In
all,
for
every
product, three
versionsofEPSSs
weredeveloped.
The only difference between
the three
versionswasthe
type
ofimages
used(i.e.,
illustrations
werereplacedby
the
photographorthe
modifiedphotograph)
as shownin
Figure
3.8.
Thus,
the
entiredocument
structure as a wholeremainedconsistent across allIMi<klftlllH!kMIWJiMSktM:bnlHU* ',ii
1 ; i.
-^
iH
M
t&wsmm
:. ft
%^
3. & s
jrjgEaBBsaaBarjaniEai
V
tigBb
EMMBM3i!ESESM3m3S3
*fi';.4i:f.WIh?
[image:35.547.80.454.59.295.2]^
Figure 3.8 The
three typesofimages in
thecontext of a givenproductEPSS (DirtDevil vacuum)
Table 3.1
shows examples ofthe three types
ofimages for
all six products:Product
Existing
Illustration
Photograph
Modified Photograph
HP Inkjet
Multifunction
Office
Machine
DirtDevil
Vacuum
Cleaner
1.
H 2,
[image:35.547.22.529.364.681.2]Roomba
Vacuum
-,. Puih
if
$A \
Epson
Projector
\
\
Braun
Coffee
Maker
Xerox Inkjet
Printer
-...
K
[image:36.547.20.531.62.591.2]3.3 Hypotheses
Hypothesis 1:
We
hypothesize
that
withthe
modifiedphotograph, there
wouldbe
an
improved focus
of attentionto the
relevant partsofimage.
To
help
evaluate ourhypothesis,
analysis were plannedto
answerthe
following
questions:o
Will
the
userspend moretime
looking
atthe task-relevant
regions of animage for
the
modified photograph as comparedto the
othertwo
image
types
(existing
illustration
andoriginal photograph)?o
Will
the
user spend moretime
looking
atthe task-relevant
regions of animage
with respectto the time
spent oninstructions
as a whole andtotal
time
onthe task
for
the
modified photograph as comparedto the
othertwo
image
types
(existing
illustration
andoriginal photograph)?Hypothesis
2:
We
alsohypothesize
that
withthe
modifiedphotograph, the task
performance would
be improved.
To
help
evaluate ourhypothesis,
analysis were plannedto
answerthe
following
questions:o
Will
usersbe
morelikely
to
succeedfor
tasks
withthe
modifiedphotographascompared
to
the
othertwo
image
types
(existing
illustration
andoriginal photograph)?
o
Will
the time to
completethe task
successfully
be less for
the
modifiedphotographascompared
to the
othertwo
image
types
(existing
illustration
andoriginal photograph)?
3.4 Methods
3.4.1 Participants
Eighteen
adults(aged
18-50;
ninemale,
ninefemale)
were recruitedthrough
aflyer
advertisement posted at
the
Rochester Institute
ofTechnology (RIT)
campus.Through
the advertisement,
users were askedto
fill
out an online screener survey.Users
werescreened
for
normal vision.People
withhard
contactlenses
andthick
glasses were notconsidered
due
to the
limitations
ofthe
eyetracker.
None
ofthese
participantshad
any
experience
working
withthe
products usedin
this study, though
somehad
experienceworking
with similar products.Out
ofthe
18
participants,
16
werestudentsfrom
variousdepartments
ofRIT;
two
were employees ofRIT
while one was a professional notdirectly
affiliatedto the
school.Each
participant was given afinancial
honorarium
of$15
for
participating
in
the
study.3.4.2 Apparatus
and
Testing
Environment
The study
wasconductedin
the
Eye
Tracking
Laboratory
ofthe
Rochester
Institute
ofTechnology's
Laboratory
for
Computer-Human Interaction
andPerformance Support
(CHIPS). The
testing
room containedthe
administrator'scomputerand video monitorsandrecorder
(Figure
3.9)
andthe
participant computerwith adjustable chairs.The
Applied Science Laboratories Model 501
head
mounted eyetracker
(Figure
3.10)
wasused
in
this
study.The
maincomponentsinclude
the
head
mounted opticsthat
consists ofthe
LED
illuminator,
aminiature video cameraand abeam
splitter.An
externalinfrared
reflective mirror
is
positionedin front
ofthe
participant'sleft
eye andthis
reflectsthe
eyefront
ofthe
headband
to
recordthe
scenefrom
the
user's perspective.The
eye and scenevideo-out
from
the
ASL
control unitwas pipedthrough
apicture-in-picturevideo mixerso
that
the
eyeimage
canbe
superimposed onthe
sceneimage.
This resulting
video wasrecordedon miniDV
tapes
that
werelater
digitized
and encodedmanually using
RITCode,
an open source programwrittenin
Objective C
by
Scott
Lawrence
ofRIT'
s
Center
for
Imaging
Science.
Since
the
study did
notinvestigate
low-level dynamics
ofeye
movements,
the
field
averaging (number
of60 Hz
videoframes
averagedwhencomputing
eyeposition)
was setto
12
to
reducethe
influence
of system noisein
the
computed eye position values.
Figure
3.9
AdministratorTable
in
theEye
Tracking
Lab
[image:39.547.60.488.63.700.2]Figure
3.10
ASL 501 Head Mounted Eye Tracker
3.5 Measures
3.5.1 Independent
and
Dependent Variables
Image
type
(existing
illustration
[EI],
original photograph[P],
modified photograph[MP])
wasthe
independent
variable.In
each ofthe
following
measures,
the
areas ofinterest
(AOI)
meanthe
areasofthe
image
most relevantto the textual
instruction
underconsideration.
For
example, the
circlesin Figure 3.1 1 indicate
the
AOIs
for
the
different
image
types.
Since
the
decision
to
spotlightan areadepended
onthe task
aswellasthe
regions
highlighted in
the
existing
illustration,
the
spotlight was appliedto
relevantregions of an untouched photograph
first
to
createthe
modified photograph.Keeping
this
modifiedphotographas
reference,
the
AOIs for
the
illustrations
andphotographs
weremarked
based
onthis
spotlighted areaofthe
modifiedimage. Since
the
spotlighthad
variable
radii,
the
AOIs
were marked accordingly.Thus,
allthree
images
for
a particular [image:40.547.209.338.91.227.2]UrwFl!
Screws
"- A- - - " '
'>.'". '*,',.--'
Figure
3.1
1 Circles
indicating
theAreas
ofinterest (AOI) in
allthe threeimage
types.The
circles shownhere
areusedonly
asa meanstoillustrate
thedefinition
ofAOI
andwere notincluded in
theactualstudy.One
exceptionto this
definition
ofAOIs
is blow-out diagrams
(see
Figure
3.12)
in
existing
illustrations,
which werealsoincluded
asapartofthe
AOI. This
resultedin
alarger AOI
for
the
existing illustration (see Figure
3.12)
than the
corresponding
photograph
(see
figure
3.13)
and modifiedphotograph(see Figure
3.14)
in
10% (3
out of29
images)
caseswhereblow-outs
wereincluded
in
the
illustration.
Please
notethat the
red circles areusedas ameans
to
illustrate
the
difference in
the
AOI
sizes and were notused
in
the
actual study. [image:41.547.62.493.74.707.2]Figure 3.12 Example
of ablow-out diagram in
theexisting illustration
(EI)
oftheHP
inkjet
multifunctionoffice machine.
The
red circlesindicate
the
areas ofinterest
Figure
3.13 AOIs
asindicated
by
the
redcirclesin
aphotograph(P)
oftheHP
inkjet
multifunction officemachine
Figure 3.14 AOIs
asindicated
by
thered circlesin
a modified photograph(MP)
oftheHP
inkjet
The
dependent
variables were categorizedinto
three
groups:1)
Measures
of visual attentionTo
understandhow
eyetracking
data is
useful,
it is
important
to
know
whatthe
data
looks like
andhow it is
analyzed.Since
eye movements are a mix offixations
andsaccades, the
common patternto
look
atsomething
is
to
scan a number ofdifferent
features
andthen
returnto the
onesthat
were most relevant orinteresting.
When
the
areaof
interest
(AOI)
is known in
advance,
the
aggregatedtime
spentin
the
AOI
becomes
ausefulmeasure
(Salvucci
&
Anderson,
1991). For
the
following
measures, the time
spenton
any
specific areais
the
aggregatedtime
spent onthat
area overthe
entiretask.
For
example,
animage
can contain multipleAOIs
and a givenEPSS
can contain multipleimages.
Thus,
the time
spent onthe
AOIs
for
atask
is
the
cumulativetime
spent onthe
AOIs
ofallthe
images
in
the
EPSS. For
example,
in Figure
3.14,
the time
spent onthe
AOIs
would equalthe time
spentby
the
userin both
circles.The
following
terms
define
what we meanby
time
spentin
different
areas ofthe
screen or on
the task
as a whole:Time
spentin AOIs: This
is
the
cumulativetime
spent onthe
AOIs
of allthe
images
for
the
givenEPSS.
Time
spent onthe
image:
This
is
the
cumulativetime
spent on allthe
images
for
the
givenEPSS (time
spentin AOIs
ofimages
+
time
spent on areas ofimages
otherthan
AOIs).
Time
spentonthe task:
Total
time
spent onthe task.
The
task
began
whenthe
HTML
pagefor
the
EPSS
wasopened.It
ended whenthe
participantbelieved
the task
wascompletedandinformed
the
administrator.Time
spent oninstructions:
Total
time
spent onthe text
as well asthe
images
of agiven
EPSS.
The
measures of visual attention were:-
Time
spent
in
AOIs
as a proportion oftime
spent onthe
image
as a whole(AOI/Image)
This
measure willbe
usedto
answerthe
question:Will
the
userspend moretime
looking
at
task-relevant
regions ofthe
image for
the
modified photograph as comparedto the
other
two
image
types
(existing
illustration
and original photograph)?-
Time
spent
in AOIs
as a proportion oftotal
time
spent onthe task
(AOI/Total
Time
ontask)
This
measure willbe
usedto
answerthe
question:Will
the
user spend moretime
looking
at
task-relevant
regions ofthe
image
withrespectto the total time
ontask
for
the
modified photograph as compared
to the
othertwo
image
types
(existing
illustration
andoriginal photograph)?
-
Time
spentin AOIs
as aproportionoftotal time
spentoninstructions
(AOI/Instructions)
This
measurewillbe
usedto
answerthe
question:Will
the
userspend moretime
looking
at
task-relevant
regionsofthe
image
with respectto the total time
oninstructions for
the
modified photographascompared
to the
othertwo
image
types
(existing
illustration
andoriginal photograph)?
2)
Measures
oftask
performanceMeasures
oftask
performance were:-
Success
rate acrossparticipants(percentage
ofparticipants
Will
usersbe
morelikely
to
succeedfor
tasks
withthe
modified photograph as comparedto the
othertwo
image
types
(existing
illustration
and original photograph)?-
Time for
successful
task
completion(total
time
spent onsuccessfully
completedtasks).
This
measure willbe
usedto
answerthe
question:Will
the time to
completethe task
successfully
be less for
the
modified photograph as comparedto the
othertwo
image
types
(existing
illustration
and original photograph)?3)
Subjective
ratingsThe
subjective ratings arebased
onthe
preference ofthe three
image
types
asindicated
by
the
participantsbased
ontheir
experience withthem
during
the
study.The
participantswere asked
to
rank orderthe three
image
types
based
ontheir
preference and also provideareason
for
their
ranking.Though
the
study
did
not considerthe
correlationbetween
the
individuals'
preferenceandperformancewhen
using
a particularimage type,
the
ratingsare
merely intended
as anindicator
ofthe
type
ofthe
image
most preferredby
the
participantsandwhy.
3.5.2 Controlled Variables
The
variablesthat
wecontrolled were:Learning
effectsEach
participant performed sixtasks,
onewitheach product.Participants
were chosenbased
ontheir
inexperience
withthe products,
solearning
due
to
priorexperience
wasminimized.
In
addition,
since eachproductalong
withthe
associatedEPSSs
wassignificantly
different from
the others,
learning
acrosstasks
was minimized.The
task
order was counter-balanced
by
a random assignment oftasks
to the
participants(Refer
to
Appendix A).
Style &
Quality
ofExisting
Illustration
The
products were chosen suchthat their
existing EPSS
illustrations had
similar stylesand
quality
(i.e., line drawings
withcolorhighlights
orlabeled
arrows).3.6 Experimental Design
Each
participant performed sixtasks,
onewith eachofthe
sixproducts suchthat the
participants received each of
the three
image
types
exactly
twice
(i.e.,
eachparticipantperformed
2
tasks
withexisting
illustration,
2
tasks
with original photograph and2
tasks
with modified photographs).
The
orderin
whichthey
performedthe tasks
was assignedprior
to the
study in
arandom order(refer
to the
Appendix A for
details regarding
the
task
orderandimage
type
breakdown for
each participant).Table 3.2
shows aconsolidated
table
withthe
participant numbersfor
each product-imagetype
cell.Task1
HP
Task
2
DirtDevil
Task
3
Roomba
Task 4
Epson
Task
5
Braun
Task 6
Xerox
Existing
GraphicalIllustration
(EI)
7.8.
10. 13.
15, 16
1,6
11,8, 14.
15
2.3,9,
10,
17,
18
2,3,4,7,13,
16
1, 5, 12.
14,
17, 18
4,5,
6,9,
11,
12
Original
Photograph(P)
2,4,9, 11, 12,
17
2,3,4,5,
10,
18
1,6,7,8,
13.
15
5,
11, 12, 14,
17,
18
3,6,7,8.9. 16
1,
10.
13, 14,
15,
16
Modified Photograph
(MP)
1.3,5,6.
14,
18
7, 13,9,
12. 16.
17
4,5,
11,
12.
14, 16
1.6,9. 10.8.
15
2.4,
10. 11.
13.
152.3,7,8, 17,
[image:46.547.64.479.458.619.2]18
3. 7 Procedure
Each
participantcompleted anInformed Consent
form
(Appendix
D-a)
andthen
receiveda
brief
explanation ofthe
equipmentin
the
lab.
This
wasfollowed
by
the
eyetracking
calibration procedure.
The
eyetracker
was calibratedto
avisualaccuracy
of0.51
degree
(arctan
0.4/45). The
participant was madeto
sit45
inches
away
from
the
monitor andasked
to
look
at each ofthe
ninedifferent
calibrationtargets
wheninstructed.
The
targets
were
located in
rows ofthree
acrossthe
top,
middle andbottom
ofthe
screen.Each
calibration
target
measured0.4
inches
in
radiuswhen projectedonthe
screen.For
greaterdetail
onthe
calibrationscreen points andlayout,
seeAppendix D-e.
The
point of gazewas computed
in
realtime
and presentedsimultaneously
onthe
screenalong
withthe
nine calibration
checking
circles.The
point of gazehad
to
be
withinthe
0.8 inch (1.01
degree)
diameter
circle whenthe
participantfixated
the center, to
be
considered accurateenough
to
moveonto the
nextpointfor
calibration.The
participant wasinstructed
to
look
at eachtarget
during
calibrationandif
the
crosshair marker(displayed
as real-timefeedback
ofthe
eyetracker's
computationofthe
participantsgaze)
was withinthe
0.8
inch