Int. J. Electrochem. Sci., 12 (2017) 4835 – 4846, doi: 10.20964/2017.06.24
International Journal of
ELECTROCHEMICAL
SCIENCE
www.electrochemsci.org
An Electrochemical Selective Detection of Nitrite Sensor For
Polyaniline Doped Graphene Oxide Modified Electrode
Mani Sivakumar1, Mani Sakthivel1, Shen-Ming Chen1,*, Karuppiah Pandi1, Tse-Wei Chen1, Ming-Chin Yu2*
1
Electroanalysis and Bioelectrochemistry Lab, Department of Chemical Engineering and Biotechnology, National Taipei University of Technology, Taipei 10608, Taiwan.
2
Department of Surgery, Chang Gung Memorial Hospital, Taoyuan 333, Taiwan, ROC.
*
E-mail: [email protected], [email protected]
Received: 20 February 2017 / Accepted: 3 April 2017 / Published: 12 May 2017
A PANI@GO (Polyaniline@Graphene Oxide) nanocomposite prepared by the facile synthesis method and applied as an active material for nitrite sensor. Numerous characterization techniques were carried out to identify the physiochemical properties of PANI@GO composite material. Notably, the electrocatalytic properties of PANI@GO modified glassy carbon electrode (GCE) towards the nitrite sensing were obtained by using Cyclic Voltammetry (CV) and amperometric (i-t). Fortunately, the PANI@GO/GCE exhibited high sensitivity, linear range and limit of detection of about 117.23 µA mM-1 cm-2, 0.002 to 44 mM and 0.5 µM respectively. In addition, the PANI@GO/GCE was found as more applicable for the real time application.
Keywords: polyaniline, GO, nitrite, electrochemical sensor.
1. INTRODUCTION
Health Organization (WHO) advising the permissible amount of nitrite in the drinking water was around 3 mg L-1. Hence, the exact monitoring level of nitrite water is needed for preventing the serious health problems. Recent developments in the field of analytical research give many promising techniques for the sensing of nitrite. For instance, the techniques including flow injection technique, liquid chromatography technique, fluorescence technique, spectrofluorometric method, fiber optic colorimetric, spectrophotometric and electrochemical technique [3-8]. Among of the above well-known analytical techniques, the electrochemical technique is considered to be an apt for probing nitrite because of its less time consumption, cost effective, high sensitivity and prompt response at very low concentration of analytes [9]. As compared to the electrochemical techniques, the other techniques have some drawbacks such as complex sample preparation and cost effective instrumental setup. For example: In flow injection techniques the stepwise process has been followed such as distillation, digestion, and matrix removal [10]. For more than two decades, different types of a carbon allotrope [11], metal oxide/hydroxide [12] and polymer [13] materials have been developed and used as an effective active material for the electrochemical oxidation of nitrite.
The polymers with high conductivity and electrocatalytic activity have been focused in various applications for long time. Particularly, the electrochemical sensors based on nanostructured conducting polymers have been considered as an attractive deal. Among the various conducting polymer, polyaniline (PANI) is relatively unique, expansively used in electrochemical sensor owing to its exclusive conductivity, electrochemical redox property and comparatively enhance the sensitivity and selectivity [14]. In contrast, the limited long term stability of PANI is a major problem for its further development in electrochemical sensor. To overcome this problem, PANI makes as the composite with carbon materials such as CNT, fullerene, graphene [15-17]. Especially, graphene oxide (GO) has high conductivity, high surface area, high electrocatalytic activity because of its single atomic plane of sp2 carbon atom network [18]. Moreover, the π-π conjugation between graphene and polyaniline enhances the stability of polyaniline [19]. For instance, Ziyin Yang et al., prepared highly stable Prussian blue/polyaniline/ graphene oxide nanocomposite for the determination of hydrogen peroxide [20]. Thus, the GO is expected as suitable material to prepare highly effective PANI nanocomposite for the oxidation of nitrite.
In this paper, Polyaniline@Graphene Oxide (PANI@GO) nanocomposite is prepared by using step wise process such as graphene oxide prepared from graphite flake using modified Hummer method and PANI@GO nanocomposite prepared in water medium using simple chemical synthesis. The PANI@GO nanocomposite modified glassy carbon electrode was successfully applied to nitrite sensing as shown in scheme 1. The electrochemical activity of PANI@GO/GCE was investigated by using Cyclic Voltammetry (CV) and amperometric i-t technique. Finally, PANI@GO/GCE was found with enhanced sensitivity, limit of detection (LOD) and linear range. Moreover, PANI@GO/GCE is identified as a prominent electrode material for nitrite sensing in practical application.
2. EXPERIMENTAL
2.1. Materials
Graphite flakes and aniline hydrochloride were purchased from Sigma-Aldrich. H2SO4 (98%),
HCl (38%), Na2HPO4, NaH2PO4 and ammonia solution (NH4OH, 28%) were purchased from ACS
reagent. H2O2 was purchased from Wako pure chemical industries. NaNO2 and NaNO3 were purchased
from Katayama Chemicals. All the solutions and chemicals are used without any further purification for all experiments.
2.2. Synthesis of graphene oxide (GO) nanosheets
Graphene oxide (GO) was prepared from graphite powder using modified Hummers method [21]. Graphite flakes (2g) and NaNO3 (2g) were mixed with 90 ml of H2SO4 in a beaker kept under at
ice bath (0-5oC) with continuous stirring. The mixture was stirred for almost 4 hrs at this temperature and KMNO4 (12 g) was added to the suspension very slowly. The rate of addition was carefully
controlled temperature lower than 15oC. The mixture is diluted with very slow addition of 100 ml of water and kept under stirring for 2 hrs. Then the above mixture is kept at 98°C for 10-15min. After 10 mins, temperature was changed to 30°C which gives us brown colored solution. The solution is finally treated with 40 ml of H2O2 by which color changes to light yellow. The resulting mixture is washed
repeatedly by centrifugation with 10% HCL and deionized water several times until it forms gel like substance (pH-neutral). Finally, the gel like substance was dried at 60°C overnight.
2.3. Synthesis of PANI@GO nanocomposite
with continuous stir and then the polymerization procedure was carried out at thi temperature for hr inally, the re ulting black-green color precipitate wa wa hed with ml portion of M and acetone for everal time and dried in the vacuum at for overnight
2.4. Preparation of PANI@GO modified glassy carbon electrode (GCE)
In beginning, the GCE was well polished with alumina powder on polishing cloth followed by washing in deionized water and ethanol. Then, the 6 µl of PANI@GO suspension solution was drop casted on polished GCE surface and then subjected to dry at oven. Consequently, PANI@GO/GCE modified electrode was dipped into N2 saturated 0.05 M PBS (pH 5) electrolyte solution for the further
electrochemical studies.
2.5. Characterization and measurements of PANI@GO
Scanning Electron Microscopy (SEM) was performed using Hitachi S-3000 H electron microscope. Fourier transform infrared spectroscopy (FTIR) measurement was recorded using JASCO FT/IR-6600. Electrochemical impedance spectroscopy was performed using IM6ex ZAHNER impedance measurement unit. The Cyclic Voltammetry (CV), Amperometric (i-t) studies were performed using CHI611A electrochemical analyzer. Conventional three-electrode system was used in these following electrochemical studies where glassy carbon electrode (GCE) was used as a working electrode, a saturated Ag/AgCl electrode used as a reference electrode and a platinum electrode used as the auxiliary electrode. All measurements were carried out at the room temperature.
3. RESULTS AND DISCUSSION
3.1 Characterization of PANI@GO
The surface morphology of PANI, GO and PANI@GO was characterized by using SEM. Fig. 1 (A, B) shows the low and high magnified SEM images of sheet like structured GO with wrinkles and fold and the particle like structure of PANI was clearly displayed in Fig. 1 (C, D). Thus, the successful preparation of GO u ing modified ummer’ method and polymerization of aniline were primarily confirmed. Consequently, PANI@GO was prepared using facile chemical synthesis, which was affirmed by using the Fig. 1 (E, F), where the sheet like structure of GO was successfully covered on PANI particle.
Figure 1. Low and high magnification of SEM images for (A, B) GO, (C, D) PANI and (E, F) PANI@GO.
[image:5.596.157.438.69.352.2] [image:5.596.216.377.411.701.2]
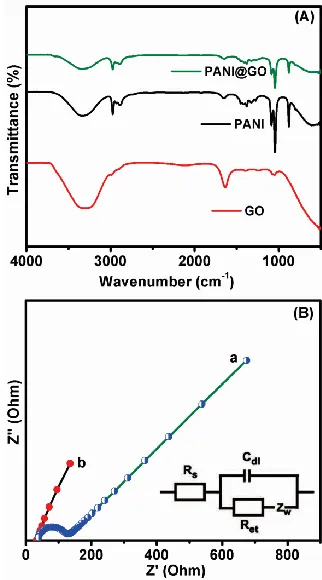
The spectra of PANI was observed with the peak at 3326 cm-1, 1650 cm-1, 1416 cm-1, 1380 cm
-1
and 1087 cm-1 for corresponding stretching vibration of –OH and the vibration of C=N, C=C, CN and CH respectively [24]. The peaks at 1045 cm-1 and 880 cm-1 are assigned to the aromatic C-H bending in plane and out of plane respectively [24]. Fortunately, FTIR spectrums of PANI@GO nanocomposite show the corresponding peaks of both PANI and GO which reveals that the unique chemical bond formation between PANI and GO.
The PANI@GO nanocomposite subjected to the electrochemical impedance spectroscopy analysis was studied to analyze its physical properties. In this study, the charge transfers resistance (Rct) value of PANI@GO/GCE was calculated and compared with bare GCE as shown in the Fig. 2B. In general, high electron transfer between electrode and redox solution is mainly depend upon the low (Rct) value, which can identify from the smaller radius of the semicircle. As shown in the Fig. 2B the
Nyquist plot was drawn between real component (Zʹ) vs imaginary component (Zʺ). The Randles circuit parameters that related to the charge transfer resistance (Rct) and solution resistance (Rs) of the
films. Both PANI@GO/GCE and bare GCE electrodes were performed in 0.1 M KCl solution containing 5mM as the supporting electrolyte. In result, PANI@GO/GCE shows very small radius of the semicircle with respect to the low charger transfer resistance than that of bare GCE is shown in Fig. 2B.
3.2 Electrochemical characterization of PANI@GO/GCE
The electrochemical property of PANI@GO/GCE towards the oxidation of nitrite was evaluated by using CV techniques and compared with other modified electrodes such as GO/GCE, PANI/GCE and bare GCE. In this technique, all these modified electrodes were checked in N2
saturated 0.05 M PBS (pH 5) electrolyte solution at a scan rate of 50 mV s-1 and the corresponding CV curves were recorded as shown in the Fig. 3A. The superior electrochemical oxidation of nitrite (476 µM) was observed for PANI@GO/GCE with highest oxidation current (Ipa) of about 45.7 µA at lowest
over potential (Epa) of 0.83 V. On the other hand, Epa were measured for GO/GCE, PANI/GCE and
bare GCE of about 1.0 V, 0.96 V and 1.04 V respectively. Eventually, PANI@GO/GCE is relatively promising active electrode for electrochemical oxidation of nitrite.
In general, the diffusion process on the surface of modified electrode is controlled by applications of various scan rates. Hence, the PANI@GO/GCE modified electrode was treated in N2
Figure 3. (A) CV profiles of film comparison in 0.05 M PBS (pH 5) at a scan rate of 50 mV s-1. (B) CV profiles obtained at different scan rates: 10 to 100 mV s-1. Insets: plot of anodic oxidation peak current vs. scan rate.
[image:7.596.218.375.69.345.2] [image:7.596.214.380.418.692.2]
For the further development of PANI@GO/GCE towards the sensing of nitrite, the modified electrode was treated in N2 saturated 0.05 M PBS by varying its pH from 3 to 9. The corresponding
[image:8.596.217.377.399.671.2]CV curve is shown in the Fig. 4A. The oxidation current of nitrite (476 µM) slightly increase when the pH was increased from 3 to 5. In result, the maximum oxidation current was observed in pH 5. It implies that the nitrite is more stable at pH 5. On other hand, nitrite is not stable at p ˂ 5 when it quickly breaks down into nitrite. On other hand, the oxidation current rapidly decrea ed at p ˃ 5 due to the lack of proton. Finally, the pH 5 is concluded as optimized condition for achieving the maximum oxidation of nitrite.
Fig. 4B displays the CV curve for varying the concentration of nitrite from 99 to 909 µM in N2
saturated 0.05 M PBS (pH 5) electrolyte solution at a scan rate of 50 mV s-1. The oxidation peak current was increased with increasing the concentration of nitrite. There is no shift in the oxidation peak potential during the further addition of nitrite from low to high concentration. It implies that the higher stability of PANI@GO/GCE and the addition of nitrite do not enhance the solution resistance. The linear calibration plot was drawn and shown in the Fig. 4B (inset) with calculated correlation coefficient of about 0.9901. Hence, the PANI@GO/GCE was identified as the suitable active material for the oxidation of nitrite.
3.3 Amperometric studies at PAN@GO/GCE for electrochemical oxidation of nitrite
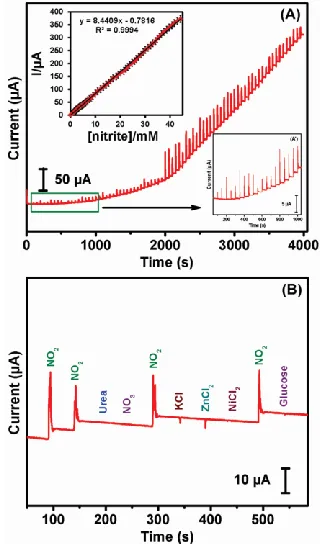
Figure 5. (A) amperometric profiles of PANI@GO-GCE in 0.05 M PBS (pH 5) at containing different concentrations of nitrite (0.002 to 44 mM). (B) Interference studies for PANI@GO-GCE with the addition of 100 µM nitrite and various interferences such as urea, NO3, KCl, ZnCl2, NiCl2
and gluco e In et: (A’) low concentration tudie and the plot of oxidation peak current (Ipa) vs different concentration of nitrite. Electrolyte: N2 saturated 0.05 M PBS (pH 5) solution;
Amperometric (i-t) technique is an auspicious technique to affirm the electrocatalytic property of the proposed active electrode material. From this technique, the major electrochemical parameters such as sensitivity, linear range and limit of detection (LOD) can be calculated. Fig. 5A shows the amperometric curve for PANI@GO/GCE in N2 saturated 0.05 M PBS (pH 5) electrolyte solution with
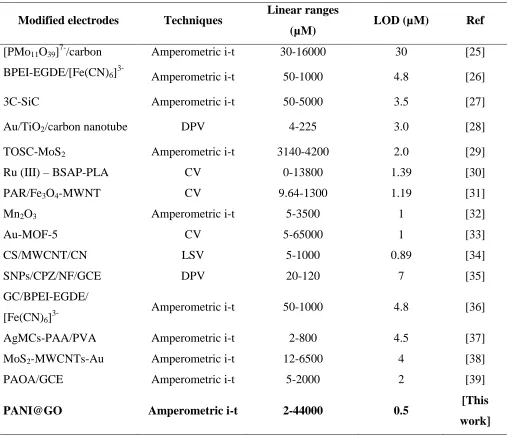
[image:9.596.46.554.331.767.2]linear addition of nitrite from 0.002 to 44 mM, when the electrode potential was fixed to -0.83 V and the rotation speed of the electrode was adjusted to 1200 rpm. In this Fig. 5A, the step wise increasing of oxidation current was observed with respect to the step wise addition of nitrite. The linear calibration plot was drawn for concentration vs current with calculated correlation coefficient of about 0.9994 is shown in Fig. 5A (insert). Finally, the sensitivity and LOD of the proposed sensing were calculated of 117.23 µA mM-1 cm-2 and 0.5 µM respectively. The obtained electrochemical parameters for the performance of PAN@GO/GCE are compared with other modified electrode materials as shown in the Table 1.
Table 1. Comparison of different electrochemical sensors with the as prepared nitrite electrochemical sensor.
Modified electrodes Techniques Linear ranges
(µM) LOD (µM) Ref
[PMo11O39]7-/carbon Amperometric i-t 30-16000 30 [25]
BPEI-EGDE/[Fe(CN)6]3- Amperometric i-t 50-1000 4.8 [26]
3C-SiC Amperometric i-t 50-5000 3.5 [27]
Au/TiO2/carbon nanotube DPV 4-225 3.0 [28]
TOSC-MoS2 Amperometric i-t 3140-4200 2.0 [29]
Ru (III) – BSAP-PLA CV 0-13800 1.39 [30]
PAR/Fe3O4-MWNT CV 9.64-1300 1.19 [31]
Mn2O3 Amperometric i-t 5-3500 1 [32]
Au-MOF-5 CV 5-65000 1 [33]
CS/MWCNT/CN LSV 5-1000 0.89 [34]
SNPs/CPZ/NF/GCE DPV 20-120 7 [35]
GC/BPEI-EGDE/ [Fe(CN)6]
3-Amperometric i-t 50-1000 4.8 [36]
AgMCs-PAA/PVA Amperometric i-t 2-800 4.5 [37]
MoS2-MWCNTs-Au Amperometric i-t 12-6500 4 [38]
PAOA/GCE Amperometric i-t 5-2000 2 [39]
PANI@GO Amperometric i-t 2-44000 0.5 [This
3.4 Selectivity of PANI@GO/GCE
In the field of electrochemical sensor, the selectivity of the materials is relatively important characteristic for identifying the better active electrode material. Hence, the PANI@GO/GCE electrode was subjected to the selectivity test in N2 saturated 0.05 M PBS (pH 5) electrolyte solution
with addition of 100 µM nitrite and various interferences such as urea, NO3, KCl, ZnCl2, NiCl2 and
glucose, which are may coexist with nitrite. The corresponding amperometric curve is shown in the Fig. 5B. The prompt current response was observed only for each addition of nitrite. As expected, the negligible amount of response was observed for the addition of other interferences. It reveals the excellent selectivity of the PANI@GO/GCE electrode towards the sensing of nitrite.
3.5 Stability, repeatability and reproducibility studies
The stability of the PANI@GO/GCE towards nitrite sensing was investigated in N2 saturated
0.05 M PBS (pH 5) using amprometric (i-t) technique. The stability curve was carried out at PANI@GO/GCE with the addition of nitrite. In result, 94.15 % of original oxidation peak current were retained. To evaluate the reproducibility and repeatability, three individually prepared PANI@GO/GCE modified electrodes was chosen and measured the corresponding oxidation peak currents (Ipa) for the addition of nitrite using CV technique. Finally, relative standard deviation (RSD) was measured for reproducibility and repetability test of about 2.2 % and 2.4 % respectively. Hence, the PANI@GO / GCE electrode exhibits high stability, repeatability and reproducibility in nitrite sensing.
3.6 Real sample analysis
[image:10.596.76.519.496.695.2][image:11.596.84.510.166.297.2]
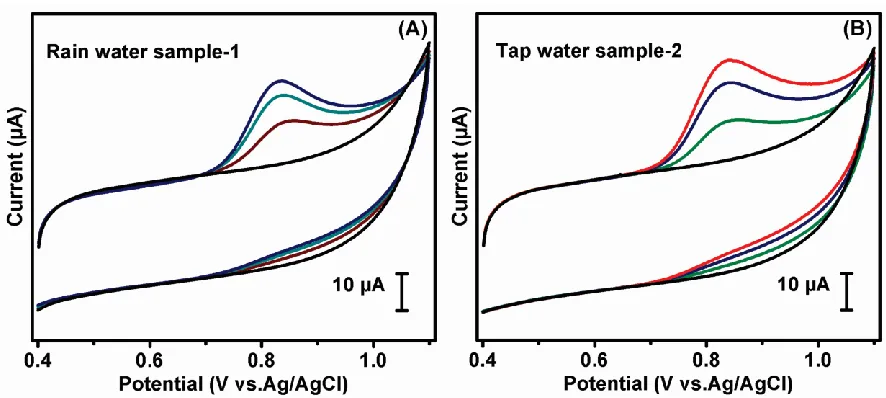
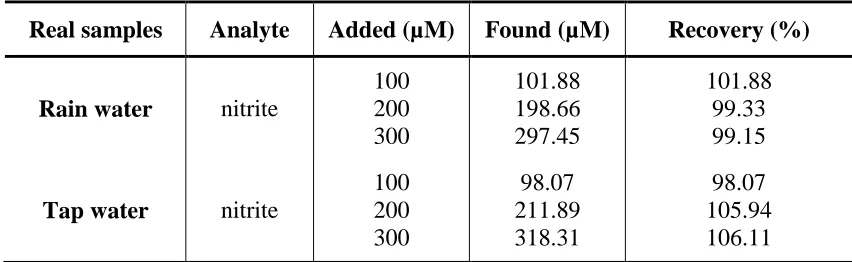
In order to investigate the real time application of PANI@GO/GCE, it was tested in rain and tap water samples using a standard addition method. The CV response was recorded for both standard nitride (10 mg) solutions and real samples mixtures as shown in Fig. 6 (A, B).
Table 2. Determination of nitrite in various rain and tap water samples by using CV.
Real samples Analyte Added (µM) Found (µM) Recovery (%)
Rain water nitrite
100 200 300 101.88 198.66 297.45 101.88 99.33 99.15
Tap water nitrite
100 200 300 98.07 211.89 318.31 98.07 105.94 106.11
In addition, Table 2 reveals that the recovery value of nitrite in the rain and tap water samples were observed, respectively. The PANI@GO/GCE exhibits defined CV responses for the oxidation of nitride in rain and tap water samples, showing this approach is suitable for real-time applications. 4. CONCLUSION
In summary, PANI@GO nanocomposite prepared by using a facile synthesis was characterized by microscopy and spectroscopy techniques. Moreover, PANI@GO modified GCE revealing good electrocatalytic behavior towards the nitrite sensing with considerable electrochemical parameters such as high sensitivity, selectivity, limit of detection (LOD) and linear range. Fortunately, PANI@GO/GCE is found to be so applicable active material for the commercialization due to the tremendous responses in real sample analysis.
ACKNOWLEDGEMENTS
This work was financially supported by the Ministry of Science and Technology, Taiwan (NSC101-2113-M-027-001-MY3 to SMC). The support offered by the National Taipei University of Technology for carrying out this work is gratefully acknowledged.
References
1. N. Amini, M. Shamsipur, M. B. Gholivand, K. Naderi, Microchem J., 131 (2017) 43.
2. K. Ramachandran, D. Kalpana, Y. Sathishkumar, Y. S. Lee, K. Ravichandran, G. G. kumar, J. Ind. Eng. Chem., 35 (2016) 29.
3. R. Hallaj, A. Salimi, B. Kavosi, G. Mansouri, Sens. Actuators B, 233 (2016) 107. 4. S. Menon, A. E. Vikraman, S. Jesny, K. G. Kumar, J. Fluoresc., 26 (2016) 129. 5. Q. Wang, H. Huang, B. Ning, M. Li, L. He, Food Anal. Methods, 9 (2016) 1293.
7. L. A. Ridnour, J. E. Sim, M. A. Hayward, D. A. Wink, S. M. Martin, G. R. Buettner, D. R. Spitz, Anal. Biochem., 281 (2000).
8. A. S. Adekunle, B. B. Mamba, B. O. Agboola, K. I. Ozoemena, Int. J. Electrochem. Sci., 6 (2011) 4388.
9. D. Chen, J. Jiang, X. Du, Talanta, 155 (2016) 329. 10.A. A. Chetty, S. Prasad, Food Chem., 197 (2016) 503.
11.S. Zhang, B. Li, Q. Sheng, J. Zheng, J. Electroanal. Chem., 769 (2016) 118.
12.Y. Zhang, P. Chen, F. Wen, B. Yuan, H. Wang, J. Electroanal. Chem., 761 (2016) 14. 13.J. Zuo, Z. Zhang, J. Jiao, H. Pang, D. Zhang, H. Ma, Sens. Actuators B, 236 (2016) 418.
14.V. H. Nguyen, C. Lamiel, D. Kharismadewi, V. C. Tran, J. J. Shim, J. Electroanal. Chem., 758 (2015) 148.
15.Y. Yang, M. Kang, S. Fang, M. Wang, L. He, J. Zhao, H. Zhang, Z. Zhang, Sens. Actuators B, 214 (2015) 63.
16.S. R. Sivakkumar, W. J. Kim, J. A. Choi, D. R. MacFarlane, M. Forsyth, D. W. Kim, J. Power Sources, 171 (2007) 1062.
17.S. Xiong, F. Yang, H. Jiang, J. Ma, X. Lu, Electrochim. Acta, 85 (2012) 235.
18.H. Wang, Q. Hao, X. Yang, L. Lu, X. Wang, Electrochem. Commun., 11 (2009) 1158. 19.S. Zhang, B. Q. Li, J. B. Zheng, Anal. Methods, 7 (2015) 8366.
20.Z. Yang, X. Zheng, J. Zheng, Synth. Met., 221 (2016) 153.
21.S. Dong, X. Dou, D. Mohan, C. U. Pittman, J. Luo, Chem. Eng., 270 (2015) 205. 22.J. Stejskal, R. G. Gilbert, Pure Appl. Chem., 74 (2002) 857.
23.J. Wang, S. Liang, L. Ma, S. Ding, X. Yu, L. Zhou, Q. Wang, Cryst. Eng. Comm., 16 (2014) 399. 24.M. Parmar, C. Balamurugan, D. W. Lee, Sensors, 13 (2013) 16611.
25.F. Boussema, R. Haddad, Ghandour, M elkhiria, M olzinger, A Maaref, o nier, Electrochim. Acta, DOI: 10.1016/j.electacta.2016.10.192.
26.P. K. Rastogi, V. Ganesan, R. Gupta, P. Singh, P. K. Sonkar, D. K. Yadav, J. Appl. Electrochem., DOI 10.1007/s10800-016-1012-7.
27.H. Dong, Z. Fang, T. Yang, Y. Yu, D. Wang, K. C. Chou, X. Hou, Ionics, 22 (2016) 1493. 28.L. Sun, H. Li, M. Li, P. Li, C. Li, B. Yang, J. Electrochem. Soc., 163 (2016) 567.
29. ang, en, hen, un, Meng, hang, Biosens. Bioelectron., 85 (2016) 692. 30.A. Terbouche, S. Lameche, C. A. R. Terbouche, D. Guerniche, D. Lerari, K. Bachari, D. Hauchard,
Measurement, 92 (2016) 524.
31.J. Qu, Y. Dong, Y. Wang, T. Lou, X. Du, J. Qu, J. Nanosci. Nanotechnol., 16 (2016) 2731. 32.H. Lu, Y. Zhang, P. Liu, J. Appl. Electrochem., 46 (2016) 1059.
33.D. K. Yadav, V. Ganesan, P. K. Sonkar, R. Gupta, P. K. Rastogi, Electrochim. Acta, 200 (2016) 276.
34.S. Li, J. Qu, Y. Wang, J. Qu, H. Wang, Anal. Methods, 8 (2016) 4204.
35.N. Amini, M. Shamsipur, M. B. Gholivand, K. Naderi, Microchem. J., 131 (2017) 43–50.
36.P. K. Rastogi, V. Ganesan, R. Gupta, P. Singh, P. K. Sonkar, D. K. Yadav, J. Appl. Electrochem., 47 (2017) 95–104.
37.K. Promsuwan, P. Thavarungkul, P. Kanatharana, W. Limbut, Electrochem. Acta, DOI:10.1016/j.electacta.2017.02.138.
38.Y. Zhang, F. Wen, J. Tan, C. Jiang, M. Zhu, Y. Chen, H. Wang, J. Electroanal. Chem., 786 (2017) 43–49.
39.L. Liu, H. Cui, H. An, J. Zhai, Y. Pan, Ionics, DOI 10.1007/s11581-017-1972-6.