Int. J. Electrochem. Sci., 12 (2017) 11942 – 11954, doi: 10.20964/2017.12.34
International Journal of
ELECTROCHEMICAL
SCIENCE
www.electrochemsci.org
Electropolymerized Molecular Imprinting & Graphene
Modified Electrode for Detection of Melamine
Zhe Ji1,2,Wen Chen1,2,*, Er Wang,1,2 , and Rongriu Deng1,2
1
College of Materials and Chemistry & Chemical Engineering, Chengdu University of Technology, Chengdu, Sichuan 610059, People’s Republic of China
2
Mineral Resources Chemistry Key Laboratory of Sichuan Higher Education Institution, Chengdu, Sichuan 610059, People’s Republic of China
*
E-mail: [email protected]
Received: 30 July 2017 / Accepted: 19 October 2017 / Published: 12 November 2017
A new method for the determination of melamine (MEL) indirectly by the changes of differential pulse voltammetry (DPV) current of K3[Fe(CN)6] probes after 10 min incubation (∆I) has been established.
It’s based on the inhibitory effect of MEL on occupying the molecular recognition sites of surface of the electropolymerized molecular imprinting & graphene modified glassy carbon electrode (MIPPy/GR/GCE). The MIPPy/GR/GCE was characterized by cyclic voltammetry (CV), electrochemical impedance spectrometry (EIS) and scanning electron microscopy (SEM). The ∆I is linearly proportional to the negative logarithmic concentration of MEL over the range of 3.0×10⁻⁸
~1.0×10⁻⁴ mol•L-1 (R = 0.9948), the detection limit is 1.02×10⁻⁸ mol•L-1 (S/N =3). The recoveries of
samples are from102.65% to 108.02%, the result is satisfactory when it is used to analyze the real samples.
Keywords: Molecularly imprinted polymer; Graphene; Melamine; Sensor
1. INTRODUCTION
This is the root cause of the North American pet food incident in 2007 and the Chinese milk scandal in 2008, and thousands of babies and pets die [4, 5].
The traditional methods to detect MEL mainly include chromatography [6-11], spectrum [12-17],and enzyme-linked immunosorbent assay (ELISA) [18-21], although these methods for routine analysis is reliable and sensitive, but several disadvantages need to be solved, such as expensive equipment, well-trained operators, complex sample preparation and long test time, and will not be able to on-site detection in food analysis. Electrochemical sensors were widely used in the field of medical, biological and environmental analysis. Such as glassy carbon electrode(GCE), gold electrode and Platinum electrode, and so on. However, the sensitivity and selectivity of bare electrodes are not good enough; they must be enhanced by several strategies. Molecular imprinting technology is one of the best tools to achieve the goals [22-27]. Molecularly imprinted polymers (MIPs) are synthetic materials with artificially generated molecular recognition sites, which have specifically binding to target molecule, and showing specific high combining behaviors to the target molecule. In the chromatography in recent years, the molecular imprinting polymer used as solid-phase extraction membrane and received good results [7-10]. MIP has the advantages of simple preparation, low cost, good stability in high temperature, acid base and organic solvent, and can be used repeatedly. The MIP sensor is usually prepared directly by synthesizing the imprinted polymer film on the surface of the electrode using an electropolymerization method.
However, the simple MIP film, as a sensor identification element, usually exhibits a trouble of poor adsorption capacity and low sensitivity. Rarely by improving the adsorption power of the MIP film, shortening the response time and completely removing the template molecules can successfully achieve excellent performance of the molecular imprinting sensor. The use of nanomaterial and MIPs in composite or hybridization as a recognition unit for sensors can increase the surface area of the sensor recognition unit, improve the conductivity and electron transport capacity of the MIP film, and finally realize the molecular imprinting electrochemical sensor significant increase in sensitivity. Graphene has been widely used to improve performance of electrochemical sensors because of the extraordinary electrocatalytic activity, biocompatibility and so on [28-31].
In this study, A new method for the determination of melamine (MEL) indirectly by the changes of differential pulse voltammetry (DPV) current of K3[Fe(CN)6] probes after 10 min
incubation (∆I) has been established. Moreover, the result is satisfactory when it is used to analyze the milk and dairy products of MEL.
2. EXPERIMENTAL DETAILS
2.1 Reagents and materials
from Chengdu Kelong Chemical Reagent Co., Ltd.(China). All solutions were prepared in distilled water and purged with nitrogen for 10 minutes prior to use; all other reagents were of analytical grade.
2.2 Instruments
Electrochemical studies using an Autolab PGSTAT 302N (Metrohm-Autolab,China) electrochemical workstation connection with a conventional three-electrode system. A GCE (Φ=3 mm, Tianjin aida Technology Co., Ltd. China) or GCE modified by different methods was used as working electrode, a saturated calomel electrode (SCE) as the reference electrode, and a platinum electrode as the counter electrode. Scanning electron microscope (SEM) image were obtained with Nova Nano SEM 450 (FEI, America).All experiments were carried out at room temperature.
2.3 Preparation of MIP sensor
The surface of the GCE was polished with 0.3, and 0.05 μm alumina slurry, and thoroughly rinsed ultrasonically with HNO3, ethanol, and double-distilled water for 5 min in turn Finally the
electrode was subjected to cyclic potential sweeps between -0.2 and 0.8V in 5 mM [Fe(CN)6]
3-/[Fe(CN)6]4- containing 0.1 M KCl as the supporting electrolyte until a stable CV was obtained, scan
rate is 100mV/s [33]. Blow dry electrode surfaces with nitrogen. Then the electrode was subjected to cyclic potential sweeps between -0.2 and 1.0 V in 0.5 M H2SO4 to activate until a reproducible
voltammogram was obtained.
Weighing 20.00 mg GO powder into 10 mL deionized water, Dispersed solution was obtained by ultrasonic dispersion uniformity. GR/GCE was prepared by dynamic potential cycling for 18 scans within the range of -1.4~0.6 V at a scan rate of 100 mV•s-1 in the above solution. Blow dry electrode surfaces with nitrogen.
Pyrrole with imprinting of MIP-modified GCE (MIPPy/GCE) was prepared by dynamic potential cycling for 8 scans within the range of −0.2 to 1.0 V at a scan rate of 50 mV•s-1 in a 0.1 mol•L-1
of KCl and 0.05 mol• L-1of PBS, which contained 5 mmol•L-1 of pyyrole, 20 mmol•L-1 of MEL. Blow dry electrode surfaces with nitrogen. The MIPPy/GR/GCE was obtained.
2.4 Experimental determination of MEL
The MIPPy/GR/GCE was dipped into 3 mL ethanol solution containing the desired concentration of MEL for 5 min, eluted with 0.2 M NaH2PO4 by chronoamperometry at 1.30 V for 180
s, washed with double-distilled water carefully to remove the possible adsorptive substances on the electrode surface, the imprinted electrode was dipped into solution containing the desired concentration of MEL for 12 min. And then transferred to the electrochemical cell containing 5 mM [Fe(CN)6]3-/[Fe(CN)6]4- containing 0.1 M KCl as the supporting electrolyte. DPV measurements were
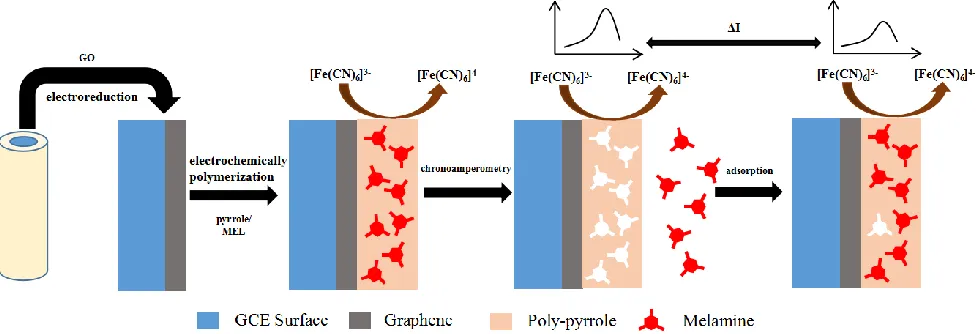
was obtained. The procedure for the preparation of the MIPPy/GR/GCE and detection mechanism for MEL shows in Fig.1.
Figure 1. The procedure for the preparation of the MIPPy/GR/GCE and detection mechanism for MEL
2.5. Real sample preparation
Taking 1.00 mL samples (milk and feed) and add 9.00 mL acetonitrile to fully ultrasonic for 10 min to dissolve fat. Then centrifuged at 10,000 rpm and filtered through a 0.45-μm filter membrane. Because MEL-contaminated milk cannot be purchased from the market anymore, the milk was spiked with appropriate amounts of MEL standard solution directly. We add a certain amount of MEL standard solution. Putting the MIPPy/GR/GCE into electrochemical cell with the filtrate, incubate in sample solution for 12 min. The MIPPy/GR/GCE was then subjected to DPV measurement in electrochemical cell containing 5 mM [Fe(CN)6]3-/[Fe(CN)6]4- containing 0.1 M KCl as the supporting
electrolyte.
3. RESULT AND DISCUSSION
3.1 Selection of experimental conditions
3.1.1 Effect of function monomer to template ratio
[image:4.596.55.543.109.276.2]
2:10 5:10 5:20 10:20 10:10
-1.0 -0.8 -0.6 -0.4 -0.2 0.0 0.2 0.4 0.6 0.8 1.0 1.2 1.4
I
(
10
-7 A
)
Proportion (mmol:mmol)
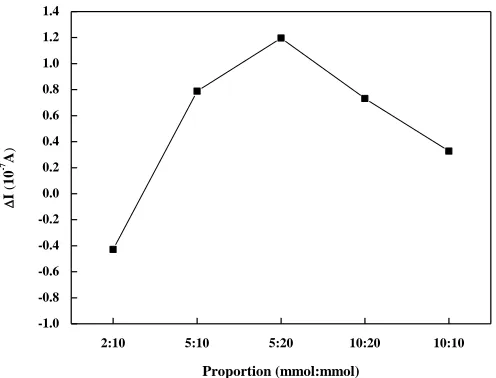
Figure 2. Effect of the ratio of poly-pyrrole (PPy) to template (MEL) on the peak current change
3.1.2 Effect of Buffer solution type
The type of buffer solution has a significant effect on the experimental results, so it is necessary to discuss the selected buffer solution. In the similar literatures, the polymerization of pyrrole is usually carried out under neutral conditions, a more uniform and better film can be obtained in neutral buffer solution [38,39,41,43,44] or without buffer solution [40,42].In this work, acetate buffer system (ABS), phosphate buffer system (PBS) and B-R buffer solution were selected as supporting electrolyte. Experiments were performed under the same conditions but only the types of supporting electrolytes were changed. The results of the composite films show that both B-R buffer system and phosphate buffer system can form corresponding electrochemical response. PBS as the support of the electrolyte conditions, MEL-pyrrole molecular imprinting film modified to the electrode on the best, and the optimal electrochemical response to MEL when using PBS as the Buffer solution. Therefore, this experiment selected PBS buffer solution to support the electrolyte.
3.1.3 Effect of pH
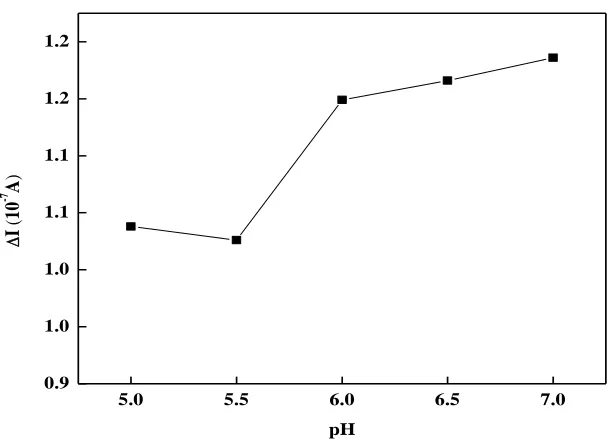
The pH of solution have dramatically influence on the structure and properties of electron transfer rate of MIP. The DPV was investigated in K3[Fe(CN)6] solution in pH of 3.0 ~ 7 , the
[image:5.596.164.412.104.293.2]
5.0 5.5 6.0 6.5 7.0 0.9
1.0 1.0 1.1 1.1 1.2 1.2
I
(
10
-7 A
)
[image:6.596.135.440.94.314.2]pH
Figure 3. The influence of the pH on peak current variation
3.1.4 Effect of scanning cycles
The sensitivity of the imprinted electrochemical sensor is affected by the thickness of the polymer film. If the blotting film is very thin, fewer imprinting sites are formed on the surface of electrode, which may cause sensitivity getting lower. But, if the blotting film is too thick, the template molecules located in the central region of the membrane cannot be completely taken out from the polymer matrix. In addition, it is difficult for the target molecule to enter the imprinting site located at the center since the mass-transfer resistance is high, it will result in the detection sensitivity decrease. By controlling the number of scanning cycles in the electroporation process, the thickness of the polymer film can be easily adjusted [35]. In the previous literature, it can be found that the number of cycles of pyrrole polymerization is usually within 10 cycles, such as 3 [36, 37], 4 [38], 5 [39, 40], 6 [41], 10 or more cycles were reported in only a few literature [42].
It can be seen from Fig. 5(A), the most suitable number of cycles for GO film formation with the best conductivity of catalytic performance is 8. So the electrochemical reduction of graphene oxide can be carried out by CV in the potential range of 1.40 to 0.60 V, with a scanning rate of 100 mV •s-1
for 8 cycles.
3.1.5 Optimization of elution time
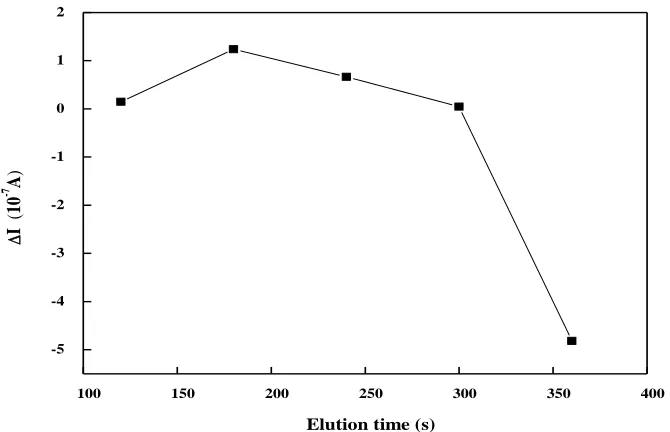
Elution time were different in different experiments, some template molecules can be eluted in few minutes [39, 40], but some literature shows it can be eluted by taking several hours [42]. The elution time for the determination was optimized in this work. In order to accurately measure MEL, it is necessary to elute the template of the electrode surface as much as possible. With the prolongation of incubation time, the DPV response was reduced and a stable response was attained 12 minutes later, indicating that the adsorption equilibrium was reached (Fig. 4). So, 12 minutes was selected as the best elution time.
100 150 200 250 300 350 400
-5 -4 -3 -2 -1 0 1 2 I ( 10 -7 A )
Elution time (s)
Figure 4. The influence of the elution time of poly-pyrrole (PPy) on the peak current change
3.2 Preparation of polymeric film
-1.5 -1.0 -0.5 0.0 0.5 1.0
-1.6x10⁻⁴ -1.4x10⁻⁴ -1.2x10⁻⁴ -1.0x10⁻⁴ -8.0x10⁻⁵ -6.0x10⁻⁵ -4.0x10⁻⁵ -2.0x10⁻⁵ 0.0 2.0x10⁻⁵ P e a k c u r r e n t (A ) Potential (V)
-0.2 0.0 0.2 0.4 0.6 0.8 1.0
-5.0x10⁻⁵ 0.0 5.0x10⁻⁵ 1.0x10⁻⁴ 1.5x10⁻⁴ 2.0x10⁻⁴ P e a k c u r r e n t ( A ) Potential (V)
(A) (B)
[image:7.596.124.459.254.470.2] [image:7.596.86.493.555.723.2]
Fig. 5 is a typical CV recorded during the pyrrole and MEL electropolymerization process. It can be seen that there are two oxidation peaks in the first cycle and the oxidation peak in the potential range of -0.2 to 1.0 V disappeared in the second cycle. The cyclic voltammetry scan of GO and pyrrole/MEL is shown in Fig. 5. The first reduction peak was at about -0.5 V and the second reduction peak was at about -0.9 V, which the peak current increases with the reaction progressed. It is proved that the GO is reduced to GR on the electrode surface [28].
3.3 SEM evaluation of MEL MIP morphology
[image:8.596.112.484.228.380.2]
(A) (B)
Figure 6. SEM image of GR / GCE (A) and GR / PPy / GCE (B).
The morphology of GR/GCE and MIPPy /GR /GCE was characterized by SEM. Their shape of the prepared GR and MIPPy/GRwas seen in Fig 6 (A) and (B). Fig. 6(A) is a SEM of the GR / GCE. It shows that GO was reduced to GR by cyclic voltammetry and dispersed on the surface of the GCE as a typical wrinkle of GR is distributed on the electrode surface. Fig. 6(B) is a SEM of the MIPPy/GR/GCE. It can be seen the surface of GR /GCE was fully covered by MEL-PPy, the morphology of MIPPy /GR /GCE is much more different from that of GR /GCE.
3.4 EIS of the modified electrode
[image:8.596.200.395.558.709.2]
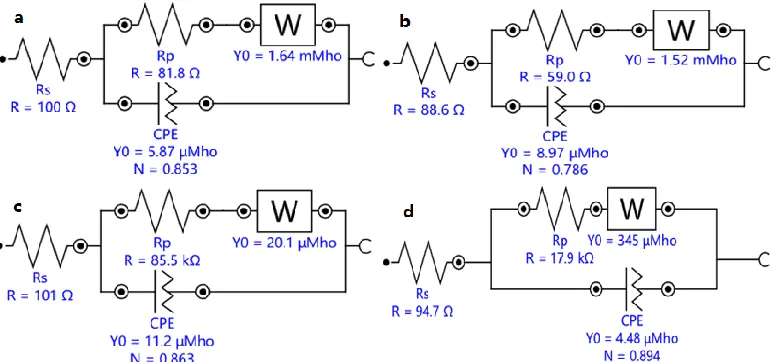
Figure 7. (B) The electrical equivalent circuit of GCE (a), GR/GCE (b), MIPPy/GR/GCE (before elution) (c),MIPPy/GR/GCE(after elution) (d)
The electrochemical impedance spectra (EIS) was carried out in 5.0 m M [Fe(CN)6]3–/4–solution
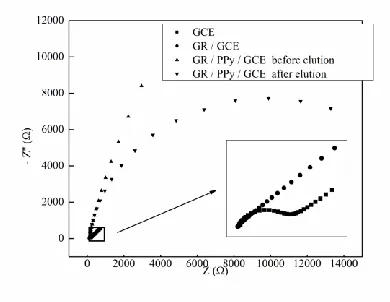
containing 0.1M KCl. The frequency range was from10−2 Hz to 105 Hz, the potential was 0.2 V. The semicircular portion of the Nyquist curve of the electrode corresponds to the electron transfer limiting process. The radius of the semicircular part of the curve corresponding to the electrode after modified GR is smaller than that of the bare electrode as show in Fig. 7(A), indicating that the GR enhances the electrical conductivity of the electrode. After the MIPPy film was modified onto the GR/ GCE electrode by CV, the electron transfer resistance increased sharply, because that the formation of the molecularly imprinted film hindered the electron transport, leading to [Fe (CN) 6] 3-/4- cannot reach the
surface of the electrode redox reaction occurs, it is proved that the prepared MIPPy film has good insulation properties. After elution of MEL template molecules, the imprinted pores were formed on the MIPs film, and the electrochemical probe K3[Fe(CN)6] was more easily transferred through the
film. Then result in electron transfer impedance reduced, thus proving the reasonable existence of molecular imprinted. Each electrodes of electrical equivalent circuit Rp value were obtained from
equivalent circuit fit shows in Fig.7 (B). The equivalent circuit Rp value of the modified electrodes was
as follow: MIPPy/GR/GCE before the template elution (85.5kΩ)>MIPPy/GR/GCE after the template elution (17.9kΩ)>GCE (81.8Ω)>GR/GCE (59.0Ω). Meanwhile, the results demonstrate that the modified electrode is successfully prepared. Fig. 7 (B) is the equivalent circuit of the four electrodes.
3.5 Linearity and detection limit
To determine the linear range and detection limit, a series of different concentrations of MEL solution with the same K3[Fe(CN)6] probe were measured by DPV. On the condition of optimization
(c), the oxidation peak current (Ipa) of K3[Fe(CN)6] probe gradually increases as the increase of the
concentration(c) of MEL( Fig. 8) .The changes of differential pulse voltammetry (DPV) current of K3[Fe(CN)6] probes ∆I is linearly proportional to the negative logarithmic concentration of MEL over
the range of 3.0×10⁻⁸
[image:9.596.107.494.71.252.2]
3.5 4.0 4.5 5.0 5.5 6.0 6.5 7.0 7.5 8.0
0.0 0.5 1.0 1.5 2.0 2.5 3.0
y = -0.6211x + 5.0818 R= 0.9948
D
I
(
10
-7 A
)
log c
Figure 8. The influence of the concentration of MEL on peak current
As seen from Table 1, compared with other modified electrodes, the MIPPy/GR/GCE can be easy to preparation and it does not require any toxic materials of the electrode surface. Seen from the result, the MIPPy/GR/GCE has a wider linear range and a lower detection limit.
Table 1. Comparison between MIPPy / GR / GCE and other sensors on the detection of MEL
Electrodes Linear range(mol•L-1) Detection limit(mol•L-1) References
Imprinted sol–gel
electrochemical sensor 6.3×10
-7
-1.1×10⁻⁴ 6.8×10⁻⁸ 22
copper electrode 5.0×10⁻⁶-9.0×10⁻⁵ 8.5×10⁻⁷ 23
poly(para-aminobenzoic
acid) MIP/GCE 4.0×10
-6
-4.5×10⁻⁴ 3.6×10⁻⁷ 24
MIL-53@XC-72
Nafion/GCE 4.0×10
-8-1.0×10⁻⁵ 5.0×10⁻⁹ 25
AuNPs/rGO/GCE 5.0×10⁻⁹-5.0×10⁻⁸ 1.0×10⁻⁹ 26
p(GA-co-PD)/GCE 5.0×10⁻⁹-1.0×10⁻⁷ 1.4×10⁻⁹ 27
This work 3.0×10⁻⁸-1.0×10⁻⁴ 1.02×10⁻⁸
3.6 Reproducibility, stability and selectivity
[image:10.596.78.535.78.258.2] [image:10.596.66.530.448.647.2]
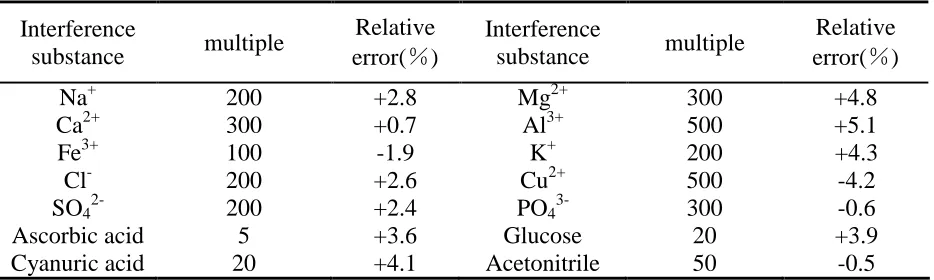
shows that common ions K+, Na+, Mg2+,Ca2+, Al3+, Fe3+, Cu2+, PO43-,SO42-and other measurements of
[image:11.596.66.533.166.306.2]MEL basically no interference. On the glucose and other organic matter also has better anti-interference ability, thus, that the method has a good selectivity.
Table 2 The disturbance situation of coexistent ions
Interference
substance multiple
Relative error(%)
Interference
substance multiple
Relative error(%)
Na+ 200 +2.8 Mg2+ 300 +4.8
Ca2+ 300 +0.7 Al3+ 500 +5.1
Fe3+ 100 -1.9 K+ 200 +4.3
Cl- 200 +2.6 Cu2+ 500 -4.2
SO42- 200 +2.4 PO43- 300 -0.6
Ascorbic acid 5 +3.6 Glucose 20 +3.9
Cyanuric acid 20 +4.1 Acetonitrile 50 -0.5
3.7 Analysis of real samples
[image:11.596.75.526.535.728.2]The analysis of the real samples was performed to assess the analytical performance of the imprinted electrode. Take appropriate sample dissolved in acetonitrile, ultrasonic heating 10min. The solution was centrifuged at 10,000 rpm for 10 min; take the supernatant through 0.45-μm filter membrane. According to the above-mentioned best experimental method, adding different concentrations of MEL solution in 50ml sample solution for recovery experiments. Each sample solution underwent three parallel determinations. The recoveries of samples are from 102.65% to 108.02%, the result is satisfactory when it is used to analyze the real samples.
Table 3. The recovery experiment
Samples Background values Add values Measured value Recovery (n=3, 10-8 mol•L-1) (10-8 mol•L-1) (n=3, 10-8 mol•L-1) (%)
Milk 1 ND
50 54.01 108.02
150 153.97 102.65
250 261.89 104.76
Milk 2 ND
50 52.72 105.44
150 154.96 103.31
250 258.3 103.32
Milk powder ND 50 53.44 106.88
4. CONCLUSION
A new method for the determination of melamine (MEL) indirectly by the changes of DPV current of K3[Fe(CN)6] probes after 10 min incubation (∆I) has been established. It’s based on the
inhibitory effect of MEL on occupying the molecular recognition sites of surface of electropolymerized molecular imprinting & graphene modified glassy carbon electrode ( MIPPy/GR/GCE). The molecularly imprinted polymers prepared with pyrrole monomers specifically recognize MEL, while Graphene has been used to improve the response of the current of MIPPy/GR/GCE because of the extraordinary electrocatalytic activity and conductivity. The structure of the three-dimensional imprinted cavity constructed by MIPPy / GR / GCE is stable and has excellent selectivity for MEL. After the template was removed by NaH2PO4 via chronoamperometry, a
voltammetric sensor for the indirectly detection of MEL using K3[Fe(CN)6] as an electrochemical
probe was obtained, which has a wide detection range from 3.0×10⁻⁸ to 1.0×10⁻⁴ mol•L-1. The detection limit is 1.02×10⁻⁸
mol•L-1 (S/N= 3), R=0.9948. In addition, the reproducibility and stability of MIP sensor are excellent; the detection recovery rate of real samples is over the range of 102.65% to 108.02%. Compared with other reported detection methods of MEL sensor, MIPPy/GR/GCE has wider detection range and lower detection limit.
References
1. H. Y. Liu, M. Xue, J. Wang, J. Qiu, X. F. Wu, Y. H. Zheng, J. G. Li and Y. C. Qin, Comp. Biochem. Physiol., Part C: Toxicol. Pharmacol., 166 (2014) 51.
2. C. B. Stine, R. Reimschuessel, Z. Keltner, C. B. Nochetto, T. Black, N. Olejnik, M. Scott, O. Bandele, S. M. Nemser, A. Tkachenko, E. R. Evans, T. C. Crosby, O. Ceric, M. Ferguson, B. J. Yakes and R. Sprando, Food Chem. Toxicol., 68 (2014) 142.
3. O.J. Bandele, C.B. Stine, M. Ferguson, T. Black, N. Olejnik, Z. Keltner, E.R. Evans,T.C. Crosby, R. Reimschuessel and R.L. Sprando, Food Chem. Toxicol., 74 (2014) 301.
4. R. L. M. Dobson, S. Motlagh, M. Quijano, R. T. Cambron, T. R. Baker, A. M. Pullen, B. T. Regg, A. S. Bigalow-Kern, T. Vennard, A. Fix, R. Reimschuessel, G. Overmann, Y. Shan and G. P. Daston, Toxicol. Sci., 106 (2008) 251.
5. K.Sharma, M. Paradakar, Food Secur., 2 (2010) 97.
6. S. LavriČ, D. KoČar, I. MiheliČ and C. Braybrook, Prog. Org. Coat., 81 (2015) 27.
7. A. Poonia, A. Jha, R. Sharma, H. B. Singh, A. K. Rai and N. Sharma, J. Dairy Technol., 70 (2017) 23.
8. B. Akbari-adergani, G. H. Sadeghian, A. Alimohammadi and Z. Esfandiari, J. Sep. Sci., 40 (2017) 1219.
9. J. Liu, H. Song, J. Liu, Y. Liu, L. Li, H. Tang and Y. C. Li, Talanta, 134 (2015) 761.
10.Y. L. Zhang, L. J. Chen, C. Zhang, S. T. Liu, H. K. Zhu and Y. M. Wang, Talanta, 150 (2016) 375. 11.L. Figueiredo, L. Santos and A. Alves, Adv. Polym. Technol., 34 (2015) 21506.
12.H. Y. Zou, K. L. Xu, Y. Y. Feng and B. Liang, Food Anal. Methods, 8 (2015) 740. 13.N. Altunay, Ö. Demir and R. Gürkan, LWT-Food Sci. Technol., 86 (2017) 352. 14.W. Chansuvarn, S. Panich and A. Imyim, Spectrochim. Acta, Part A, 113 (2013) 154. 15.A. S. Yazdi, S. R. Yazdinezhad and T. Heidari, J. Adv. Res., 6 (2015) 957.
17.J. Cheng, X. O. Su, Y. Yao, C. Q. Han, S. Wang and Y. P. Zhao, Plos One, 11 (2016)
18.J. W. Choi, K. M. Min, S. Hengoju, G. J. Kim, S. I. Chang, A. J. deMello, J. Choo and H. Y. Kim, Biosens. Bioelectron., 80 (2016) 182.
19.Y. F. Gong, M. Z. Zhang, M. Z. Wang, Z. L. Chen and X. Xi, Arab. J. Sci. Eng., 39 (2014) 5315. 20.Y. Zhou, C. Y. Li, Y. S. Li, H. L. Ren, S. Y. Lu, X. L. Tian, Y. M. Hao, Y. Y. Zhang, Q. F. Shen,
Z. S. Liu, X. M. Meng and J. H. Zhang, Food Chem., 135 (2012) 2681.
21.W. W. Yin, J. T. Liu, T. C. Zhang, W. H. Li, W. Liu, M. Meng, F. Y. He, Y. P. Wan, C. W. Feng, S. L. Wang, X. Lu and R. M. Xi, J. Agric. Food Chem., 58 (2010) 8152.
22.G. L. Xu, H. L. Zhang, M. Zhong, T. T. Zhang, X. J. Lu and X. W. Kan, J. Electroanal. Chem., 731 (2014) 112.
23.R. William . de Araujo and T. R.L.C. Paixão, Electrochim. Acta, 117 (2014) 379.
24.Y. T. Liu, J. Deng, X. L. Xiao, L. Ding, Y. L. Yuan, H. Li, X. T. Li, X. N. Yan and L. L. Wang, Electrochim. Acta, 56 (2011) 4595.
25.W. Q. Zhang, G. R. Xu, R. Q. Liu, J. Chen, X. B. Li, Y. D. Zhang and Y. P. Zhang, Electrochim. Acta, 211 (2016) 689.
26.N. N. Chen, Y. X. Cheng, C. Li, C. L. Zhang, K. Zhao and Y. Z. Xian, Microchim. Acta, 182 (2015) 1967.
27.J. Deng, S. Q. Ju, Y. T. Liu, N. Xiao, J. Xie and H. Q. Zhao, Food Anal. Methods, 8 (2015) 2437. 28.X. M. Sun, Z. J, M. X. Xiong and W. Chen, J. Electrochem. Soc., 164 (2017) B107
29.F. Xue, Z. Y. Gao, X. M. Sun, Z. S. Yang, L. F. Yi and W. Chen, J. Electrochem. Soc.,162 (2015) H338
30.V. H. Nguyen, C. Lamiel, D. Kharismadewi, V. C. Tran and J. J. Shim, J. Electroanal. Chem., 758 (2015) 148.
31.A. Öztürk, M. Alanyalıoğlu, Superlattices Microstruct., 95 (2016) 56.
32.D. Y. Pan, S. Wang, B. Zhao, M. H. Wu, H. J. Zhang, Y. Wang and Z. Jiao, Chem. Mater., 21 (2009) 3136.
33.B. W. Wu, Z. H. Wang, D. X. Zhao and X. Q. Lu, Talanta, 101 (2012) 374.
34.H. B. Rao, M. Chen, H. W. Ge, Z. W. Lu, X. Liu, P. Zou, X. X. Wang, H. He, X. Y. Zeng and Y. Y. Wang, Biosens. Bioelectron., 87 (2017) 1029.
35.X. Y. Zhang, Y. Peng, J. L. Bai, B. A. Ning, S. M. Sun, X. D. Hong, Y. Y. Liu, Y. Liu and Z. X. Gao, Sens. Actuators, B, 200 (2014) 69.
36.H. Hrichi, M. R. Louhaichi, L. Monser and N. Adhoum, Sens. Actuators, B, 204 (2014) 42. 37.T. C. Tsai, H. Z. Han, C. C. Cheng, L. C. Chen, H. C. Chang and J. J. Chen, Sens. Actuators, B,
171-172 (2012) 93.
38.L. Özcan and Y. Şahin, Sens. Actuators, B, 127 (2007) 362. 39.Z. O. Uygun and Y. Dilgin, Sens. Actuators, B, 188 (2013) 78.
40.V. K. Gupta, M. L. Yola, N. Özaltın, N. Atar, Z. Üstündağ and L. Uzun, Electrochim. Acta, 112 (2012) 37.
41.F. Wang, L. H. Zhu and J. D. Zhang, Sens. Actuators, B, 192 (2014) 642. 42.B. L. Li, J. H. Luo, H. Q. Luo and N. B. Li, Sens. Actuators, B, 186 (2013) 96.
43.P. Jara-Ulloa, P. Salgado-Figueroa, R. Moscoso and J. A. Squella, J. Electrochem. Soc., 160 (2013) 243.
44.V. Syritski, J. Reut, A. Menaker, R. E. Gyurcsányi and A. Öpik, Electrochim. Acta, 53 (2008) 2729