Int. J. Electrochem. Sci., 14 (2019) 5794 – 5812, doi: 10.20964/2019.06.64
International Journal of
ELECTROCHEMICAL
SCIENCE
www.electrochemsci.orgShort Communication
Effect of Surface Roughness on the Corrosion Behavior of Pure
Iron in Acidic Solutions
Ahmed S. Alshamsi* and Afra AlBlooshi
Department of Chemistry, College of Science, United Arab Emirates University, Al Ain, UAE *E-mail: [email protected]
Received: 28 August 2018 / Accepted: 18 February 2019 / Published: 10 May 2019
The effect of surface roughness on the corrosion behavior of pure iron in acidic solutions (hydrochloric and sulfuric acids) in the absence and presence of molybdate ions was thoroughly investigated. Polarization techniques, electrochemical impedance spectroscopy, and scanning electron microscopy were used for this investigation. The results demonstrated that increasing surface roughness and the presence of molybdate ions have detrimental effects on the corrosion resistance of pure iron in acidic solutions. While general corrosion was observed at the open circuit potential, crystallographic pits were observed under anodic polarization in hydrochloric acid solutions.
Keywords: iron, corrosion, EIS, roughness, molybdate, HCl, H2SO4.
1. INTRODUCTION
Int. J. Electrochem. Sci., Vol. 14, 2019
5795 required in order to improve corrosion resistance in Fe-Mo alloys [3]. Furthermore, relatively low Mo and MoO42- concentrations were reported to have detrimental effects on various metals’ and alloys’ resistance to corrosion [3, 9–13]. Moreover, it was reported that the presence of MoO42- affects both passivity and pit nucleation by deactivating the sites at which pit formation occurs and by reducing the pit size. As a result, it is more difficult for pits to develop into stable ones [14]. Some argue that Mo improves stainless steel corrosion resistance by reducing the active dissolution rates of salt-free surfaces, leading to repassivation and termination of localized corrosion [15]. Others reported that alloyed Mo and MoO42- inhibit metastable pitting [7]. Wang et al. concluded that the growth of stable Fe pits in the absence of sulfide inclusions was due to potential with the nucleation behavior similar to some carbon steels [16]. Burstein and Pistorius reported surface roughness affected pitting corrosion of 304 stainless steels with an increasing nucleation rate of metastable pits corresponding to an increase in surface roughness in solutions containing chloride ions [17].
Surface texture (preferred orientation) and surface roughness influence carbon steels’ corrosion behavior [18]. Wang et al. reported an increase in charge transfer resistance (Rct) values with decreasing roughness for mild steel tested in ammonium chloride (NH4Cl) solution [19]. Viera et al. reported a decrease in pitting corrosion resistance with increasing roughness of the 316L and low carbon austenitic stainless steels tested in physiological solutions [20]. Interestingly, Toloei et al. reported that while the corrosion rate of nickel (Ni) in H2SO4 increased with increasing roughness, the corrosion rate of mild steel in H2SO4 decreased with increasing roughness [21]. Roxanna et al. reported a decrease in the corrosion rate corresponding to an increase in roughness for the AE44 magnesium alloy tested in aerated 3.5% sodium chloride (NaCl) solution [22].
Clearly, surface roughness and MoO42- affect the corrosive behavior of metals and alloys. However, the nature of such effects, such as increasing/decreasing the corrosion rate, depends on the type of material and MoO42- concentration.
While it is generally accepted that relatively high concentrations of Mo and MoO42- inhibit corrosion, there is no widely accepted mechanism on the way in which Mo or MoO42- enhance corrosion resistance. Pure Fe, unlike steel, does not contain sulfide inclusions. Consequently, the effects of inclusions on corrosion mechanisms and rates and on nucleation and pit growth can be excluded. As a result, nucleation and pit growth (when it occurs) can be related to surface roughness. The main objective of this study was to investigate the effects of surface roughness on Fe’s corrosion behavior in two different acids (H2SO4 and HCl), one of them containing chloride. In addition, the role of MoO4 2-as a corrosion inhibitor w2-as investigated 2-as a function of surface roughness.
2. EXPERIMENTS
relatively smooth surface area. The sample was cleaned with distilled water and placed in a 3-electrode cell with platinum (Pt) as a counter-electrode and saturated Ag/AgCl electrode as the reference electrode, +0.197 V versus the standard hydrogen electrode (SHE). Standard corrosion techniques include the open circuit potential versus time (OCP versus t), polarization resistance versus time (Rp versus t), potentiodynamic polarization, potentiostatic polarization, and electrochemical impedance spectroscopy (EIS) measurements. Different potentiodynamic polarization measurements were conducted: (1) one set of potentiodynamic polarization measurements were initiated at –250 mV versus the corrosion potential (Ec.) to +250 mV using a scanning rate of 0.167 mV s-1 and (2) the other polarization measurements were initiated at +250 mV versus an Ec to + 750 mV using a scanning rate of 0.1 mV s-1. The Rp versus t measurements were conducted at a scanning rate of 0.1 mV s-1 with experiments conducted at ± 10 mV versus Ec. Six data points were collected per Rp versus t experiment. Each set of two points were separated by a 5-min time interval. The potentiostatic experiments were conducted in 0.1 M HCl and in 0.1 M HCl + 0.01 M Na2MoO4 at an applied potential of about +1000 mV above Ec. The applied potential is sufficiently high in order to allow for pitting to occur. No potentiostatic experiments were conducted in 0.1 M H2SO4 solution because the solution does not cause pitting. EIS experiments were conducted using an applied alternating current (AC) potential of 10 mV with frequencies ranging from 0.005 to 100,000 Hz. Magnetic stirring at a constant rate was maintained in all experiments. Each experiment started with OCP monitoring for 1 h followed by Rp versus t, EIS, and finally potentiostatic or potentiodynamic polarization measurements. The solution was purged with high purity nitrogen gas throughout the experiment. Data were collected automatically with the aid of a potentiostat/galvanstat (Gamry G750). All data analyses and extrapolations were performed using Gamry corrosion software (Gamry Echem Analyst). On average, three independent experiments were conducted for all specimens. The samples’ surface morphologies were examined using scanning electron microscopy (SEM). The samples were cleaned in an ultrasound bath for a few minutes prior to SEM examination.
3. RESULTS AND DISCUSSIONS
Int. J. Electrochem. Sci., Vol. 14, 2019
5797
Figure 1(a). SEM micrograph of polished Fe surface with smooth finish (P1200).
[image:4.596.151.446.72.328.2] [image:4.596.149.447.364.624.2]
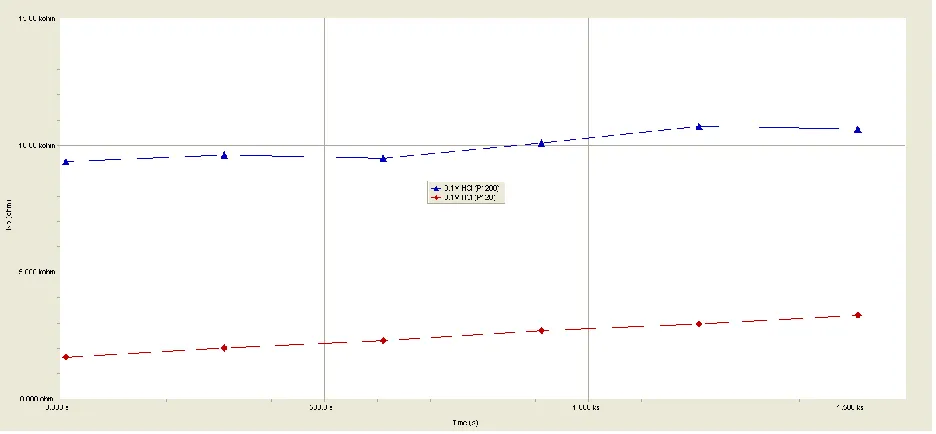
Figure 2a. Rp versus t measurements of Fe tested in 0.1 M HCl as a function of surface roughness.
Figure 2b. Rp versus t measurements of Fe tested in 0.1 M HCl + 0.01 M Na2MoO4 as a function of surface roughness.
[image:5.596.65.534.332.550.2]Int. J. Electrochem. Sci., Vol. 14, 2019
[image:6.596.77.526.72.279.2]5799
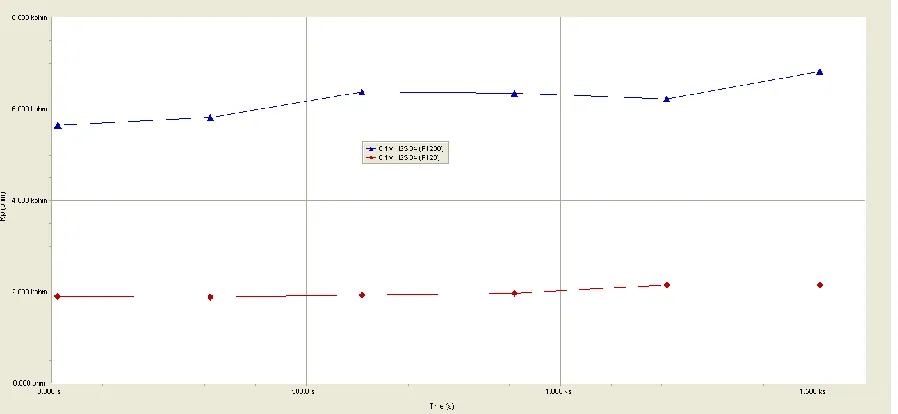
[image:6.596.71.528.335.586.2]Figure 3a. Rp versus t measurements of Fe tested in 0.1 M H2SO4 as a function of surface roughness.
Figure 3b. Rp versus t measurements of Fe tested in 0.1 M H2SO4 + 0.01 M Na2MoO4 as a function of surface roughness.
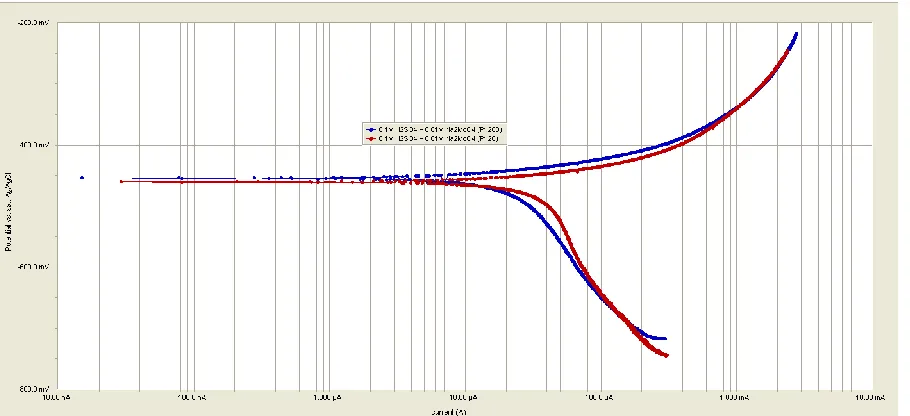
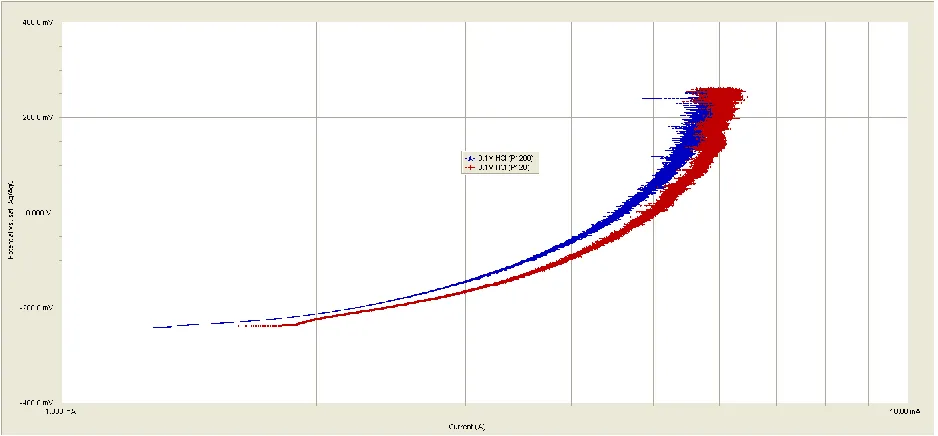
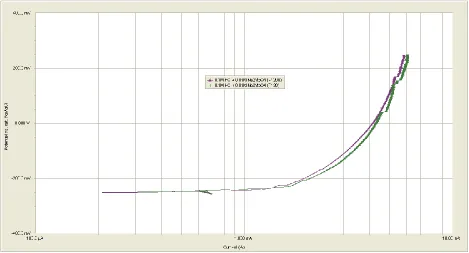
Figure 4 (a, b) shows the potentiodynamic polarization curves for Fe in 0.1 M HCl and in 0.1 M HCl + 0.01 M Na2MoO4 as a function of surface roughness, respectively. Figure 5 (a, b) shows similar potentiodynamic polarization curves for Fe in 0.1 M H2SO4 and Fe in 0.1 M H2SO4 + 0.01M Na2MoO4 as a function of surface roughness, respectively.
measurements. The data correlates well; the higher the Rp, the lower the ic. The %Rp change is calculated using the equation:
[image:7.596.79.517.156.391.2]% Rp change = (Rp[smooth] – Rp[rough])/ Rp [rough]) x 100%
Figure 4a. Potentiodynamic polarization curves of Fe in 0.1M HCl as a function of surface roughness.
[image:7.596.63.535.447.697.2]Int. J. Electrochem. Sci., Vol. 14, 2019
[image:8.596.63.534.71.322.2]5801
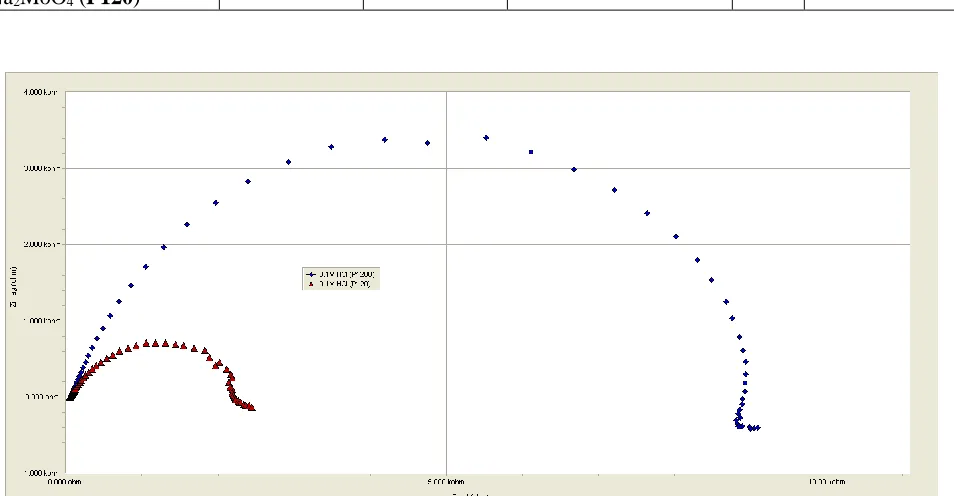
Figure 5a. Potentiodynamic polarization curves of Fe in 0.1 M H2SO4 as a function of surface roughness. In order to further investigate Fe’s corrosion behavior in the two solutions, EIS measurements were conducted. The Nyquist plots of Fe in 0.1 M HCl and in 0.1 M H2SO4 are given in Figures 6 (a, b) and 7 (a, b), respectively. Inspection of Figures 6 and 7 shows the existence of depressed single semicircles with different diameters and degrees of depression. The single semicircle represents a single charge transfer process, while a depressed semicircle depicts surface roughness or inhomogeneity [23, 24]. The Rp value can be estimated from the semicircle’s diameter [23].
[image:8.596.74.529.499.707.2]
Table 1. Electrochemical parameters of Fe in 0.1 M H2SO4 and 0.1 M HCl as a function of surface roughness in the absence and presence of MoO42-.
Solution Ec (mV) Rp (Ω cm2) ic (μA cm2-) % Rp change with
roughness
0.1 M H2SO4 (P1200) -503 ± 3.2
169.9 ± 55.5 44.5 ± 2.3 +178 0.1 M H2SO4 (P120) -502 ±
2.2
61.1 ± 13.6 203.7 ± 37.2 - 0.1 M H2SO4 + 0.01M
Na2MoO4 (P1200)
-475 ± 18.8
34.7 ±5.5 865.2 ± 156.8
+4.8 0.1 M H2SO4 + 0.01M
Na2MoO4 (P120)
-460 ± 9.0
33.1 ± 6.5 1420.4 ± 631
- 0.1 M HCl (P1200) -500 ±
8.72
394.3 ± 81.2 61.9 ± 15.6 +474.8 0.1 M HCl (P120) -482 ±
5.77
68.6 ± 10.6 142.5 ± 41.8 - 0.1 M HCl + 0.01 M Na2MoO4
(P1200)
-467 ± 8.5
138.1 ± 75.2 118.8 ± 25.5 +117.1 0.1 M HCl + 0.01 M Na2MoO4
(P120)
-479 ± 8.5
63.6 ± 18.0 182.6 ± 38.8 -
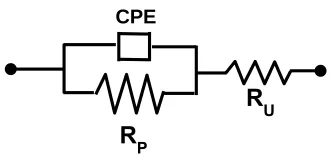
Inspection of Figures 6 and 7 clearly reveals that the smooth surfaces depict larger diameters (larger impedance) and consequently higher Rp values in comparison to the rough surfaces. Table 2 shows the EIS parameters calculated using the constant phase element (CPE) circuit used to fit the Nyquist plots in Figures 6 and 7. The CPE circuit is shown in Figure 8. The Rp data from EIS, reported in Table 2, generally follows the same trend as those from Rp versus t measurements and are reported in Table 1.
CPE is defined by the equation [25]:
Z(CPE) = Y0-1 (jω)-α
[image:9.596.215.383.605.684.2]in which Y0 is the CPE constant, ω is the angular frequency in rad s-1, j2 = –1 is the imaginary number, and α is the CPE exponent.
Figure 8. The equivalent circuit is used to fit the EIS data. (CPE the constant phase element, Rp the polarization resistance, and the Ru the solution resistance).
RU RP
Int. J. Electrochem. Sci., Vol. 14, 2019
5803 The physical interpretation of the CPE depends on the value of α. CPE represents resistance (Z[CPE] = R, α = 0), capacitance (Z[CPE] = C, α = 1), inductance (Z[CPE] = L, α = ‒1), or Warburg impedance for (α = 0.5). The CPE is considered a capacitor when values of α are ≥0.8. In the current study, the α values range from about 0.70 to 0.86. Deviation from an ideal capacitor (α = 1) can be attributed to heterogeneity and roughness. The α values in Table 2 show higher α values for the smooth surface rather than the rough surface and higher α values in H2SO4 solutions rather than in the HCl solutions. The lower α
[image:10.596.49.557.278.467.2]values in the HCl solutions can be attributed to the aggressive nature of the HCl, which is known to cause localized corrosion.
Table 2: Electrochemical impedance parameters of Fe in 0.1 M HCl and 0.1 M H2SO4 as a function of surface roughness in the absence and presence of MoO42-.
Solution Rp (Ω cm2) Ru (Ω cm2) Yo (Ω-1 cm-2 sα) α % Rp change with roughness
0.1 M H2SO4 (P1200) 248.47 ± 1.30 1.69 ± 0.0127 1.67 x 10⁻⁴ ± 3.0 x 10⁻⁶ 0.857 +253.5% 0.1 M H2SO4 (P120) 70.08 ± 0.362 1.65 ± 0.0115 3.86 x 10⁻⁴ ± 8.98 x 10⁻⁶ 0.840 - 0.1 M H2SO4 + 0.01M
Na2MoO4 (P1200)
31.58 ± 0.164 2.103 ± 0.0144 3.18 x 10⁻⁴ ± 1.37 x 10⁻⁵ 0.837 -33.88%
0.1 M H2SO4 + 0.01M Na2MoO4 (P120)
47.76 ± 0.276 2.040 ± 0.0131 1.19 x 10⁻³ ± 2.84 x 10⁻⁵ 0.780 -
0.1 M HCl (P1200) 285.20 ± 1.57 2.032 ± 0.0159 2.64 x 10⁻⁵ ± 4.50 x 10⁻⁶ 0.789 +298.5% 0.1 M HCl (P120) 71.561 ± 0.464 1.761 ± 0.0121 2.40 x 10 -3 ± 4.34 x 10⁻⁵ 0.697 - 0.1 M HCl + 0.01M
Na2MoO4 (P1200)
173.59 ± 1.075 3.319 ± 0.0219 8.38 x 10⁻⁴ ± 1.47 x 10⁻⁵ 0.746 +81.2%
0.1 M HCl + 0.01M Na2MoO4 (P120)
95.80 ± 0.599 3.033 ± 0.0188 1.37 x 10⁻³ ± 2.64 x 10⁻⁵ 0.754 -
[image:10.596.62.539.458.706.2]
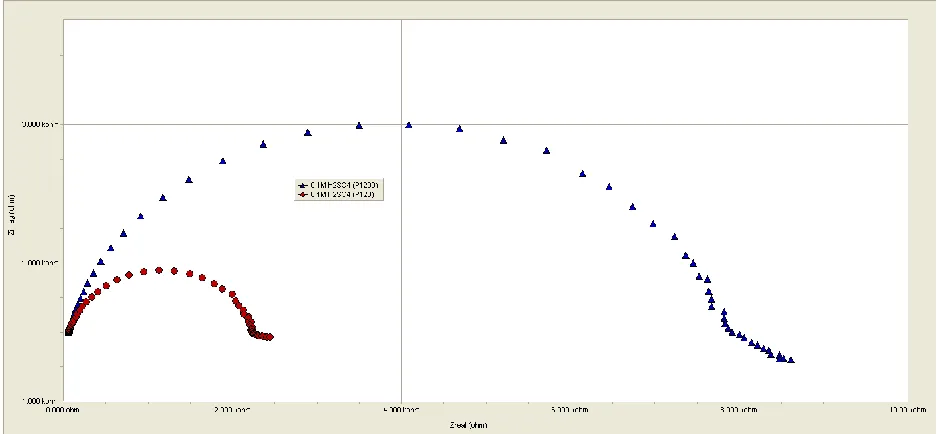
Figure 6b. Nyquist plots of Fe in 0.1 M HCl + 0.01 M Na2MoO4 as a function of surface roughness.
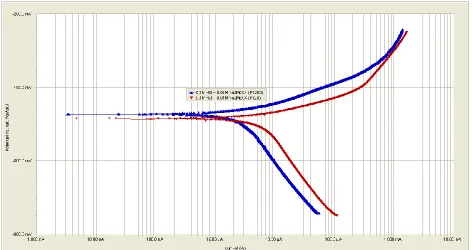
In order to investigate pitting corrosion, the Fe electrode was anodically polarized to 500 mV above the Ec. Figures 9 and 10 are the potentiodynamic anodic polarization curves for Fe in MoO4 2-absence and presence, respectively. Figure 9 shows current transients that increased in frequency and size with increasing potential for both surfaces.
[image:11.596.63.533.463.680.2]Int. J. Electrochem. Sci., Vol. 14, 2019
[image:12.596.64.534.71.289.2]5805
Figure 7b. Nyquist plots of Fe in 0.1 M H2SO4 + 0.01 M Na2MoO4 as a function of surface roughness.
These transients indicate metastable pit nucleation [14]. Moreover, the increase in current with increasing potential indicates the pits grew into stable ones. MoO42- presence clearly caused a
reduction in the current transients as shown in Figure 10. Nevertheless, the current continued to increase with an increase in potential.
[image:12.596.64.533.428.646.2][image:13.596.90.534.516.728.2]
Figure 10. Potentiodynamic anodic polarization curves of Fe in 0.1 M HCl + 0.01 M Na2MoO4 as a function of surface roughness.
Figure 11shows the potentiostatic anodic polarization curves for Fe in 0.1M HCl as a function of surface roughness under applied potential of about 1000 mV above Ec. Figure 12 shows the anodic potentiostatic polarization curves in the presence of MoO42-. The curves in Figure 12 clearly show that the presence of MoO42- caused a decrease in the current and fluctuations when compared to current values in Figure 11 in which MoO42- is absent. More importantly, the curves in Figures 11 and 12 do not show any signs of current decrease over time. Such behavior indicates that once pits form, they do not repassivate.
Int. J. Electrochem. Sci., Vol. 14, 2019
[image:14.596.62.538.86.308.2]5807
Figure 12. Potentiostatic anodic polarization curves of Fe in 0.1 M HCl + 0.1 M Na2MoO4 as a function of surface roughness, Eapplied = +1000 mV.
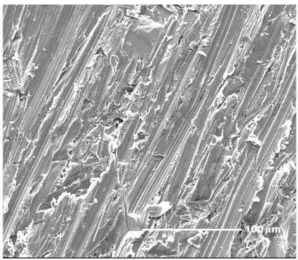
Figure 13 shows the surface morphologies of Fe surfaces in 0.1 M HCl solution under different conditions. Figure 13 (a-d) show Fe surface morphologies in 0.1 M HCl in either MoO42- absence and presence at the OCP. Only general corrosion with no signs of localized (pitting) corrosion was observed. Pits appeared when Fe was anodically polarized to a high potential (1000 mV above Ec) as shown in Figure 13 (e–h). Inspection of the micrographs shows the pits have random distribution. Moreover, the pits are deep and crystallographic.
[image:14.596.156.442.475.729.2]
Figure 13(b): SEM micrograph of Fe (rough, P120) after one hour of immersion in 0.1M HCl at the OCP.
[image:15.596.153.445.69.327.2] [image:15.596.157.439.393.635.2]Int. J. Electrochem. Sci., Vol. 14, 2019
5809
Figure 13(d): SEM micrograph of Fe (rough, P120) after one hour of immersion in 0.1M HCl + 0.01M Na2MoO4 at the OCP.
[image:16.596.150.447.67.326.2] [image:16.596.151.446.393.659.2]
Figure 13(f): SEM micrograph of Fe (rough, P120) after one hour of immersion in 0.1M HCl followed by an applied potential of 1000 mV above Ec for 60 seconds.
Figure 13(g): SEM micrograph of Fe (smooth, P1200) after one hour of immersion in 0.1 M HCl + 0.01 M Na2MoO4 followed by an applied potential of 1000 mV above Ec for 60 seconds.
[image:17.596.152.445.68.324.2] [image:17.596.150.444.392.653.2]Int. J. Electrochem. Sci., Vol. 14, 2019
5811
Figure 13(h): SEM micrograph of Fe (rough, P120) after one hour of immersion in 0.1 M HCl + 0.01 M Na2MoO4 followed by an applied potential of 1000 mV above Ec for 60 seconds.
The arrows in the figure point to some of the crystallographic pits. The presence of MoO42- did not eliminate pitting-related corrosion. The latter could be attributed to the relatively high anodic potential. However, it seems to change the pits’ morphologies, sizes, and number when the pits were covered by corrosion products.
4. CONCLUSIONS
4.1 The corrosion rate of Fe increases with increasing surface roughness in 0.1 M HCl and in 0.1 M H2SO4 in both MoO42- absence and presence.
4.2 The effects of surface roughness on the Fe corrosion rate are more apparent in 0.1 M HCl than 0.1 M H2SO4 solutions.
4.3 The presence of MoO42- increases the corrosion rate of Fe in 0.1 M HCl and 0.1 M H2SO4. 4.4 Stable pits form under high anodic polarization in 0.1 M HCl in both MoO42- absence and presence.
4.5 The pits are randomly distributed and look crystallographic.
4.6 Surface roughness appears to affect the nature of the double layer as indicated by its effect on the value of α.
[image:18.596.152.445.69.324.2]
ACKNOWLEDGMENT
The authors would like to express their sincere appreciation to the Research Affairs at the United Arab Emirates University (UAEU) for their partial support of this project. The authors would also like to express their gratitude to the department of chemistry at the UAEU for providing the facilities to carry out this project.
References
1. V. S. Sastri, Green Corrosion Inhibitors, John Wiley and Sons, New Jersey (2011). 2. A. J. Sedriks, Corrosion of Stainless Steels, 2nd ed., John Wiley and Sons, Inc. (1996). 3. J. R. Ambrose, Corrosion, 34 (1978) 27.
4. T. Kodama and J. R. Ambrose, Corrosion, 33 (1977) 155. 5. K. Sugimoto and Y. Sawada, Corrosion, 32 (1976) 347. 6. C. R. Clayton and Y. C. Lu, Corrosion Science, 29 (1989) 881.
7. S. Virtanen, B. Surber and P.Nylund, Corrosion Science, 43 (2001) 1165.
8. A. Pardo, M. C. Merino, A. E. Coy, F. Viejo, R. Arrabal, and E. Matykina, Corrosion Science, 50 (2008) 780.
9. Ahmed S. Alshamsi, International Journal of Basic and Applied Sciences, 2 (2013) 303. 10. S. A. M. Refaey, Applied Surface Science, 240 (2005) 396.
11. Xianghong Li, Shuduan Deng, and Hui Fu, Corrosion Science, 53 (2011) 2748. 12. M. R. Ali, C. M. Mustafa, and M. Habib, Journal of Scientific Research, 1 (2009) 82. 13. Ahmed S. Alshamsi, Int. J. Electrochem. Sci., 8 (2013) 591.
14. G. O. Ilevbare and G. T. Burstein, Corrosion Science, 45 (2003) 1545. 15. H. S. Isaacs and S.-M. Huang, J. Electrochemical Soc., 143 (1996) L277.
16. H. Wang, J. Xie, K.P. Yan, M. Duan, and Y. Zou, Corrosion Science, 51 (2009) 181. 17. G. T. Burstein and P. C. Pistorius, Corrosion, 51 (1995) 380.
18. Deepak Dwivedi, Katerina Lepkova, and Thomas Becker, RSC Adv., 7 (2017) 4580.
19. Hai-bo Wang, Yun Li, Guang-xu Cheng, Wei Wu, Yao-heng Zhang, and Xin-yun Li, Int. J. Electrochem. Sci., 13 (2018) 5268.
20. Viera Zatkalíková, Monika Oravcová, Peter Palček, and Lenka Markovičová, TRANSACTIONS OF FAMENA, XLI-4 (2017) 25.
21. A. S. Toloei, V. Stoilov, and D. O. Northwood, WIT Transactions on Engineering Sciences, 90 (2015) 355.
22. Roxanna B. Alvarez, Holly J. Martin, M.F. Horstemeyer, Mei.Q. Chandler, Neil Williams, Paul T. Wang, and Augusto Ruiz, Corrosion Science, 52 (2010) 1635.
23. S. Sathiyanarayanan, C. Jeyaprabha, S. Muralidharan, and G.Venkatachari, Applied Surface Science, 252 (2006) 8107.
24. S. Ben Aoun, M. Bouklah, K. F. Khaled, and B. Hammouti, Int. J. Electrochem. Sci., 11 (2016) 7343.
25. Z. Zhang, S. Chen, Y. Li, S. Li, and L. Wang, Corrosion. Science, 51 (2009) 291.