Abstract: Relevance: The paper describes the technology of running cluster analysis with the use of a program module developed by the authors and used as an add-in for the clustering process program in the Microsoft Excel software environment. Currently, the amount of information required for making management and other decisions is growing, and the need for processing large amounts of data becomes relevant. One of the methods of this processing is data clustering the cluster analysis implies. In a general way, cluster analysis is designed for uniting several objects into classes (clusters) in such a way that maximally similar objects get into one class and the objects of different classes maximally differ from each other. Methods: When carrying out the researches, the methods of cluster analysis, system analysis were used. The use of these research methods allowed solving the main scientific and practical problems of the project, obtaining new, theoretically based results. The ground in favor of the chosen research methods is recognized world practice of their usage to solve research and technology problems and the many years' experience of the authors in the use of these methods. Results: Statistical programs, which feature the function of running a cluster analysis, such as Statistica, SPSS, STADIA, etc., belong to knowledge-intensive software and their price is often unaffordable to many enterprises. Running cluster analysis in Microsoft Excel is possible, but this process is very knowledge-intensive and requires a lot of time for its execution. Running a cluster analysis with the use of a developed program doesn’t require special knowledge on the mechanism of running cluster analysis from the user and takes a few seconds to complete it. The results compared to other programs are the same. In comparison to the Microsoft Excel program where cluster analysis was run without add-in, the results were also the same, but the time for completing the analysis was significantly decreased. Discussion: The paper’s authors describe the technology of automation of clustering process in the Microsoft Excel software environment, which makes it possible to run cluster analysis of large amounts of statistical data promptly and with minimal time expenses. Conclusion: The paper’s authors consider that the automation of clustering process in the Microsoft Excel software environment allows decreasing time significantly. The process of cluster analysis in the MS Excel
Revised Manuscript Received on June 10, 2019.
Marina L. Gruzdeva, Department of Service Technologies and Technological Education, Faculty of Management and Social and Technical Services, Minin Nizhny Novgorod State Pedagogical University, Nizhny Novgorod, Russia.
Natalia Ye. Tukenova, Department of information technologies, Faculty of physics and mathematics, Zhetysu State Universite named after I. Zhansugurov, Taldykorgan, Republic of Kazakhstan.
Zhanna. V. Smirnov, Department of Service Technologies and Technological Education, Faculty of Management and Social and Technical Services, Minin Nizhny Novgorod State Pedagogical University, Nizhny Novgorod, Russia.
Sergey Е. Revunov, Department of vocational education and management of educational systems, Faculty of Management and Social and Technical Services, Minin Nizhny Novgorod State Pedagogical University, Nizhny Novgorod, Russia.
Nikolay А. Barkhatov, Department of Service Technologies and Technological Education, Faculty of Management and Social and Technical Services, Minin Nizhny Novgorod State Pedagogical University, Nizhny Novgorod, Russia.
program without the use of add-on is very labor-intensive and requires a lot of time to complete it. Also, in case of very large number of items, the time for running cluster analysis significantly increases and when the number of items is estimated in hundreds and thousands, the time of effective cluster analysis running can be estimated in days, which is very ineffective. The use of add-in doesn’t require special knowledge on the mechanism of running cluster analysis from the user and takes a few seconds to complete it.
Index Terms: Automation of information statistical processing, cluster analysis.
I. INTRODUCTION
Today, there are a lot of universal programs for processing and analyzing statistical information. Among software of this type, the highly specialized packages can be distinguished: Statistica, SPSS, STADIA, STATGRAPHICS, which have a large set of statistical functions: factor analysis, regressive analysis, cluster analysis, multivariate analysis, tests, of fit, etc [1]. These software products also usually contain means for visual interpretation of findings: different charts, diagrams, data representation on the geographical map [2], [3].
Statistical programs belong to knowledge-intensive software, their price is often unaffordable to many enterprises. The Microsoft Excel table processor included in the Microsoft Office office application package is quite a different story. Microsoft Office software package fits for the organization of work in any structure whether it is a major company or a small private enterprise, it combines the best means for management, documentation management, finances, accounting.
Running cluster analysis in Microsoft Excel is a very labor-intensive process requiring a lot of time to complete it [4]–[6]. That's why the "Promyshlennaya Ekologiya" company tasked us with automating the process of cluster analysis in the Microsoft Excel environment and to this end, an add-in was developed to run cluster analysis in Microsoft Excel.
A. Research theoretical framework
The research objective is creating a module for solving cluster analysis problems in the Microsoft Excel environment.
Having analyzed the existing algorithms of cluster analysis, let’s create the module operation algorithm. In our work, we used the algorithm of
hierarchical clustering (Fig. 1.).
The Technology of Clustering Process in
Microsoft Excel
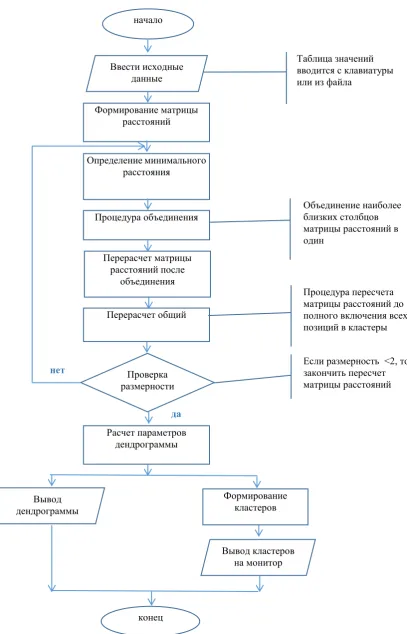
Figure 1:The algorithm of hierarchical clustering 1. First, the user enters start values in the Excel sheet in the
form of a table. The table of values is entered from the keyboard or from a file on the hard drive.
2. The program forms a distance matrix.
3. The next step is defining the minimal distance between objects.
4. Then, the procedure of unification takes place. At this stage, the program unites the closest matrix distance objects into one.
5. Review calculation of the distance matrix after начало
конец Ввести исходные
данные
Вывод дендрограммы
Вывод кластеров на монитор Проверка
размерности Формирование матрицы
расстояний
Определение минимального расстояния
Процедура объединения
Перерасчет матрицы расстояний после
объединения
Перерасчет общий
Расчет параметров дендрограммы
Формирование кластеров
Таблица значений вводится с клавиатуры или из файла
Объединение наиболее близких столбцов матрицы расстояний в один
Процедура пересчета матрицы расстояний до полного включения всех позиций в кластеры
Если размерность <2, то закончить пересчет матрицы расстояний нет
unification. Cluster coordinates and its minimal distance are calculated.
6. General re-calculation. The distance matrix re-calculation procedure until the full inclusion of all objects in clusters takes place.
7. The check of dimension. If the dimension is less than 2, the program finishes the matrix re-calculation and shifts to the next step. If the dimension is more than or equal to 2, the program performs step #3.
8. Calculation of dendrogram parameters.
9. Displaying results. At this stage, clusters are formed and displayed, the dendrogram is also displayed.
The algorithm of cluster transfer consists of 6 points (Fig. 2.):
1. The search of two objects in a cluster with a minimal distance from each other;
2. A row and a column corresponding to the second object from these objects are stricken out from the matrix.
3. The calculation of a distance from a new cluster to all the remaining clusters (objects) takes place: average distances from the objects of the first cluster to the remaining ones are calculated.
4. The obtained values are entered to a row and a column of the distance matrix corresponding to the first object from the first cluster.
5. Check: if the number of rows is more than 2, you need to go to point 2, otherwise – to point 6;
6. The dislocation of the current object against the previous position and dislocation of the remaining objects of the cluster are defined. The parameters of dislocated objects change, and the cross-point is taken for original coordinates. Then, the cyclical transition to point 1 takes place.
[image:3.595.131.422.233.700.2]
Figure 2: The algorithm of cluster transfer The program module is created with the use of the Visual
Basic Object-Oriented language and can be used as an add-in for the Microsoft Excel program. This software product
allows running cluster analysis in the Microsoft Excel program.
We consider the following methods of cluster analysis:
1. Hierarchical methods: да
да
нет нет
нет Начало
Рассматриваемый объект заносится в кластер
Конец
да Счѐтчик строк кластера count=1
i=0, count
Параметры i-ой строки изменены
Занесение номера строки в кластер inc(count)
j=0, N , где N – количество строк
j-ая строка связана с i-ой
j-ая строка занесена в кластер
PGMA (pair-group method using arithmetic mean) Ward’s method.
2. Iterative grouping method: McQueen’s k-means.
Both parameters and objects can be classifiable, that’s why in the course of the narration where the question is the classification of objects, it's possible to talk about the classification of parameters, and vice versa. This opportunity is provided in this software.
The measures of cluster analysis can be the next:
The measure of similarity of distance type (distance function), also called the disparity measure. In this case, objects are considered the more similar, the less distance between them, that’s why some authors call the measures of similarity of distance type disparity measures. Under certain conditions, this measure would be a metric.
The measure of similarity of correlation type called linkage defining the similarity of objects. In this case, objects are considered the more similar, the stronger linkage between them. These measures with the use of elementary manipulations can be reduced to the measures of similarity of distance type, which is done in this software for the purpose of uniformity.
In this software the next measures of disparity are implemented:
Euclidean distance, Manhattan distance, Uniform norm, Mahalanobis distance, Pearson's distance.
Formally using a method not corresponding to the data type, the user risks obtaining meaningless results.
The results of cluster analysis can be illustrative if they’re represented in the form of charts.
Following the results of the calculation by hierarchical methods, we can plot a special chart called dendrogram (Fig.
[image:4.595.319.534.134.334.2]3.). Let’s suppose, after using one of hierarchical methods, the results of classification in the form of linkage values for object pairs are obtained. The idea of plotting a dendrogram is that the pairs of objects singled out along the abscissa axis are united in accordance with the level of linkage singled out along the ordinate axis.
Figure 3:Dendrogram
Based on the calculation results, it’s possible to plot space ellipsoids (only for the number of classes not more than 3, for the greater number of classes two-dimensional cuts of space are used) containing classified objects.
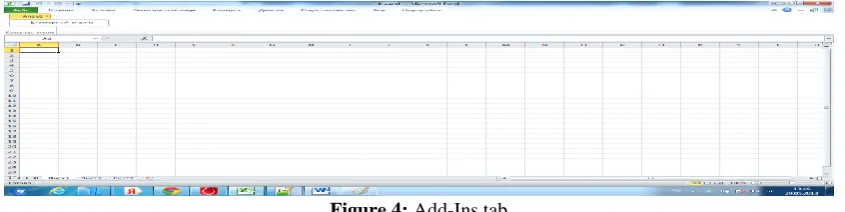
For the convenience of work with the program module we developed, we connected it as an add-in in Microsoft Excel. As soon as the process of installation is finished, the Add-ins new tab will be formed (Fig. 4). Besides, the Analysis button will be displayed in the adjustable toolbar.
Figure 4: Add-Ins tab II. RESEARCH METHODOLOGY
When carrying out the researches, the methods of cluster analysis, system analysis were used. The use of these research methods allowed solving the main scientific and practical problems of the project, obtaining new, theoretically based results. The ground in favor of the chosen research methods is recognized world practice of their usage to solve research and technology problems and the many years' experience of the authors in the use of these methods.
III. THE ANALYSIS OF RESEARCH RESULTS To check the operation of the program module we developed for running a cluster analysis we solved the problem of breakdown of cars into classes, each of them corresponds to a certain group of impact on environmental pollution. Observations gotten in one group are characterized by the same environmental impact.
The original data file represented in Figure 5 contains the following information:
[image:4.595.88.511.515.621.2] carbon oxide % – the second variable; carbohydrate % – the third variable; carbon dioxide % – the fourth variable; oxygen % – the fifth variable;
Figure 5: Original data table
The use of cluster analysis to solve this problem is most efficient. In a general case, cluster analysis is designed for uniting some objects into classes (clusters) in such a way that maximally similar objects get into one class and the objects of different classes maximally differ from each other. The quantity index of similarity is calculated in a prescribed manner based on data characterizing objects.
To start running cluster analysis in the Microsoft Excel software environment with the use of add-in, we go to the
Add-Ins tab and select Analysis – Cluster analysis (Fig. 6).
We select data for analysis in the Cluster analysis dialog window in the Data Interval point(Fig. 7).
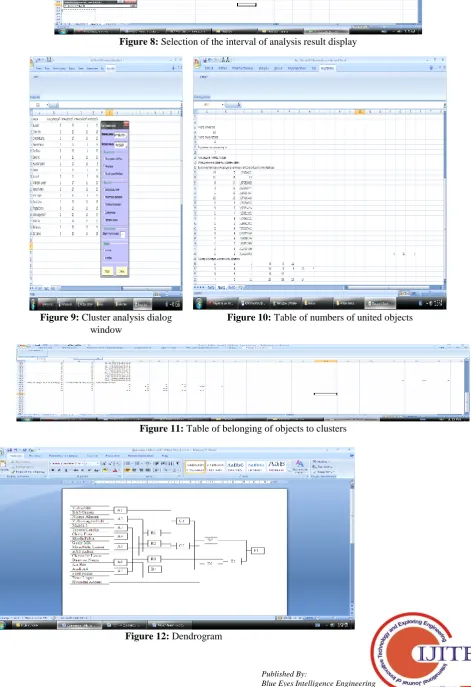
The next step is to select the interval of analysis result display, it’s sufficient to specify one cell for display in the
Display interval point (Fig. 8).
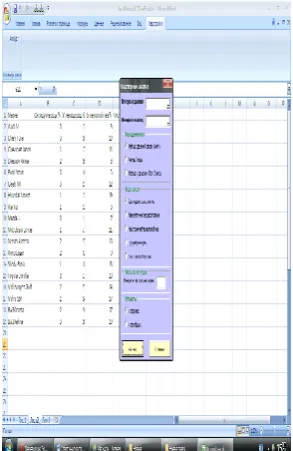
Then, in the Linkage measure group in the Quantitative
characters point, we select Euclidean distance. We select
Ward’s method in the Analysis method group, only Euclidean
distance is used as a disparity measure for Ward’s method. We enter the number 4 in the Cluster number group. We can also define how classifiable objects are located in the Objects group. This option except for convenience for the classification of objects located either in rows or columns also allow selecting, according to the user’s choice, what to classify – objects or parameters. Objects in rows are selected by default and in our case, there's no need to change them (Fig. 9).
After pressing the Calculation button, there will be analysis results in Cluster analysis dialog window. Except for general information (number of objects, number of parameters), the program provides the table of numbers of united objects and levels of corresponding linkages. After uniting a pair of objects, the second object of each pair is excluded from
consideration and renumbering of the remaining objects is done (Fig. 10).
The program also provides the table of belonging of objects to clusters (Fig. 11). The calculation results can be used for plotting a dendrogram (Fig. 12).
[image:5.595.353.500.149.375.2]To check the obtained results, the same problem was solved in Statistica and SPSS.
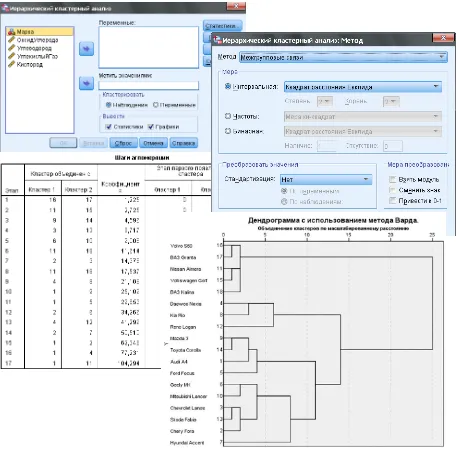
Figure 6: Cluster analysis dialog window
[image:5.595.305.549.417.602.2]Figure 8: Selection of the interval of analysis result display
Figure 11:Table of belonging of objects to clusters
Figure 12: Dendrogram Figure 9:Cluster analysis dialog
[image:6.595.59.531.134.822.2]window
[image:6.595.87.507.185.545.2]A. Cluster analysis in the STATISTICA system
Figure 13:Solution in the Statistica program
[image:7.595.69.539.54.528.2]Based on the visual representation of results, it can be concluded that cars compose four natural clusters. Obtained results are given in Table 1.
Table 1:Results of distribution of cars after running cluster analysis in the Statistica program Cluster # The number of
objects of a cluster
Objects composing a cluster
1 4 Audi А4, Ford Focus, Mazda 3, Toyota Corolla
2 6 Chery Fora, Chevrolet Lanos, Geely MK, Hyundai Accent, Mitsubishi Lancer,
Skoda Fabia
3 3 Daewoo Nexia, Kia Rio, Reno Logan
4 5 Nissan Almera, Volkswagen Golf, Volvo S60, ВАЗ Granta, VAZ Kalina
Figure 14:Solution in the SPSS program
Based on the results given in the Belonging to clusters window, conclusions represented in Table 2 can be made.
Both as a result of the operation of the add-in we developed to the Microsoft Excel program and as a result of the operation of Statistica and SPSS statistical programs, objects were distributed into four clusters and distribution results are statistically comparable.
Table 2: Results of distribution of cars after running cluster analysis in the SPSS program Cluster
#
The number of objects of a cluster
Objects composing a cluster
1 4 Audi А4, Ford Focus, Mazda 3, Toyota Corolla
2 6 Chery Fora, Chevrolet Lanos, Geely MK, Hyundai Accent, Mitsubishi Lancer, Skoda Fabia
3 3 Daewoo Nexia, Kia Rio, Reno Logan
IV. CONCLUSION
The process of cluster analysis in the Microsoft Excel program without the use of add-in is very labor-intensive and
requires a lot of time to complete it. Also, in case of very large number of items, the time for running a cluster analysis significantly increases and when the number of items is estimated in hundreds and thousands, the time of effective cluster analysis running can be estimated in days, which is very ineffective. That's why the paper's authors made a decision to automate the process of cluster analysis in the Microsoft Excel software environment and to this end, an add-in for cluster analysis was written. The use of add-in doesn’t require special knowledge on the mechanism of running cluster analysis from the user and takes a few seconds to complete it. Results in comparison to other programs are the same. In comparison to the Microsoft Excel program, where cluster analysis was run without add-in, the results were also the same, but the time for completing the analysis was significantly decreased.
REFERENCES
1. M. L. Gruzdeva, “Automation of educational activities of students of economic specialties using the Mathcad and Excel programs,” In Innovations in the system of continuous professional education: materials of the X International Scientific and Methodological Conference of University Teachers, Scientists and Specialists. Nizhny Novgorod, 2009, pp. 39-45.
2. E. Reynders, “System Identification Methods for (Operational) Modal Analysis: Review and Comparison” Archives of Computational Methods in Engineering, Vol. 19, No. 1, 2012, pp. 51-124.
3. E. Reynders, J. Houbrechts, G. De Roeck, “Fully automated (operational) modal analysis,” Mechanical Systems and Signal Processing, Vol. 29, 2012, pp. 228-250.
4. S. S. Shishulin, “Methodology сomparative statistical analysis of Russian industry based on cluster analysis,” Statistics and Economics, Vol. 14, No. 3, 2017, pp. 21-30.
5. V. V. Mukhin, “Theoretical features of the application of cluster analysis in the analysis of economic relations,” Modern business space: current problems and prospects, Vol. 1, No. 4, 2015, pp. 131-133. 6. P. G. Bakir, “Automation of the stabilization diagrams for subspace