International Journal of Innovative Technology and Exploring Engineering (IJITEE) ISSN: 2278-3075, Volume-9 Issue-1, November 2019
Performance and Emission Characteristics of
Chlorella Algae Methyl Ester Fuelled Diesel
Engine with Varying Injection Pressure
Sanjay Singh,M Prabhahar,R Venkatesh,
Abstract — In the present scenario when the world is facing severe problem related to continuous decrease in the level of fossil fuels and increasing level of green house gases due to their uses in industries and automobiles, there is a high demand from all technologists and environmentalists to find and develop some alternative fuel especially manufactured from biomass like chlorella algae due to its presence in abundance. The mentioned algae is readily available and is being used as a dietary source in many countries especially in Japan due to its rich protein lipids and starch content and highly suitable for extraction of oil that can be used as an alternative to the existing fossil fuel diesel. The blend of B20 chlorella algae methyl ester or biodiesel is tested for its suitability with respect to its combustion performance and emissions characteristics in a variable compression ratio engine at 180 bar, 200 bar and 220 bar injection pressures. The performance data obtained are compared and analyzed for optimum performance with reference to mechanical, combustion properties and emissions of exhaust gases and a comparison is made with the properties obtained for pure diesel in similar conditions.
Key words — Chlorella, Biodiesel, Brake Power, Emissions, Fuel, Green House Gas, Injection Pressure, Mechanical Efficiency, Methyl Ester, Microalgae etc.
I. INTRODUCTION
The Scientific communities in the world along with automobile engineers are struggling hard to develop alternative fuels especially manufactured from biomass and can lower the level of air pollution with less emission in comparison to fossil fuels like diesel and petrol [2][3][5][7][8][9]. Increasing level of pollution has become a major concern for all due to continuous increase in earth’s temperature leading to global warming and further melting of glaciers and increase in water level of sea and ocean. The green house gas Carbon dioxide which is mostly emitted from automobiles and industries and its increasing concentration has made technologists to search for some alternative fuel, incorporate modification and design new engines with lower levels of emissions and are suitable for running the engine with several types of biodiesels [1][4][6][10][11][14]. A chlorella microalga is one of the biomass available in abundance and the oil extracted from it have some matching properties with fossil fuel diesel. The methyl ester or oil extracted from microalgae and blend B20 (20% algae oil and 80% diesel) is tested for its performance and compared with the properties of fossil fuel diesel to ascertain its usability as an alternative fuel [18][19][20][22][23].
The methyl ester extracted from the microalgae can be used in an engine by using additives for modification of desirable properties making it suitable for further use and produce similar power requirements by an engine as is produced by using pure diesel which is a fossil fuel. The bio diesel is tested for its suitability as an alternate fuel at different injection pressures (180, 200 and 220 bars) and characteristics related to combustion performance and emissions are obtained for comparison and further analysis [12][13][15][16][17][21][24].
II. ABOUT CHLORELLA MICROALGAE
Germany, Taiwan and Japan are the countries in which Chlorella microalgae can be found in abundance. Being a great source of biomass and rich in lipids, starch and proteins content and if grown in favorable conditions with different techniques, its lipids and protein content can be increased to considerably high level. Harvesting of this biomass is done by centrifugation process. The biomass obtained from these microalgae is a good source of bio energy due to its high productivity and less competitive with the food production in comparison to other sources of biodiesels. Starch present in the microalgae is a good source of bio ethanol and the lipids present is a good source of biodiesel. Its less use in food products is due to its dark color and pungent smell like fish.
III. PROPERTIES OF CHLORELLA
MICROALGAE OIL
[image:1.595.331.520.550.711.2]The chemical properties of biodiesel as shown in figure are tested under standard laboratory conditions. The properties tested in lab are given in table 1.
Table 1. Properties of Biodiesel Produced from Chlorella microalgae.
IV. EXPERIMENTAL SET UP
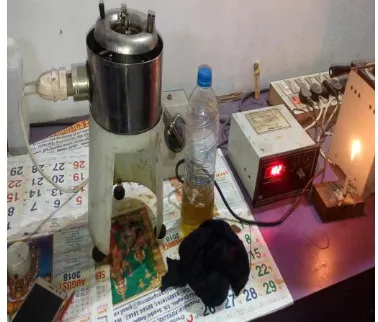
[image:2.595.314.540.159.643.2]Kirloskar TV1 Variable Compression Ratio (VCR) Engine as shown in Figure 2 is utilized to obtain test results. The Kirloskar engine is a Single cylinder Four stroke, Constant Speed and Water Cooled Diesel Engine. Details of the engine specifications and other parameters are as shown in table 2.
Figure 2: Kirloskar Engine Variable Compression Ratio Engine.
Figure 3: Kirloskar VCR Engine Test Set up.
Sl. No.
Description Values
1. Cylinder Bore in mm 87.50
2. Stroke Length in mm 110.00
3. Connecting Rod length in mm 234.00
4. Swept volume (cubic centimeter) 661.45
5. Compression Ratio 17.50
6. Power in kW @ 1500 RPM 5.20
Table 2: Details of the Kirloskar Engine used for the test.
V. DISCUSSIONS ON PERFORMANCE OF B20
BLEND OF BIO DIESEL AND PURE DIESEL AT DIFFERENT LOADING CONDITIONS
AND VARYING INJECTION PRESSURE
B20 (20% algae oil and 80% fossil fuel diesel) blend of biodiesel is tested for its performance under standard laboratory conditions and a comparative analysis is done to find out the injection pressure at which the chosen blend
Engine Load
AT 180 BAR AT 200 BAR AT 220 BAR B20 DIESEL B20 DIESEL B20 DIESEL
0 0.02 0.03 0.02 0.02 0.03 0.02
25 1.29 1.3 1.30 1.32 1.34 1.32
50 2.56 2.6 2.57 2.58 3.59 2.58
75 3.75 3.76 3.76 3.76 3.95 3.73
[image:2.595.308.545.174.417.2]100 4.93 4.97 4.94 4.96 4.99 4.94
[image:2.595.48.288.289.635.2]Table 3: Brake Power values obtained at different injection pressure.
Figure 4: Graph - Engine Load vs Brake Power in kW at 180 Bar Injection Pressure.
[image:2.595.318.536.427.622.2]International Journal of Innovative Technology and Exploring Engineering (IJITEE) ISSN: 2278-3075, Volume-9 Issue-1, November 2019
Figure 6: Graph - Engine Load vs Brake Power in kW at 220 Bar Injection Pressure.
Discussion: Bio diesel B20 at 220 bar injection pressure has proved even better than pure diesel. The brake power values obtained on all engine loading conditions are higher than pure diesel. The reason for higher performance of B20 is due to higher atomization and high rate of combustion.
B. Brake Mean Effective Pressure (BMEP) Brake Mean effective pressure is the actual pressure experienced by the piston for useful work. The difference of indicated and friction mean effective pressure is called as brake mean effective pressure. The BMEP values obtained at 180 bar, 200 bar and 220 bar injection pressure are given in table 4 and the graphs plotted are shown in Figures 7, 8 and 9 respectively.
Engine Load
AT 180 BAR AT 200 BAR AT 220 BAR B20 DIESEL B20 DIESEL B20 DIESEL
0 0.02 0.04 0.02 0.03 0.03 0.02
25 1.56 1.59 1.58 1.59 1.81 1.58
50 3.12 3.14 3.12 3.14 3.65 3.15
75 4.67 4.68 4.67 4.69 4.75 4.66
[image:3.595.59.284.45.228.2]100 6.26 6.29 6.27 6.30 6.65 6.28
Table 4: Brake Mean Effective Pressure values obtained at different injection pressure.
Figure 7: Graph - Engine Load vs Brake Mean Effective Pressure in Bar at 180 Bar Injection
Pressure.
Figure 8: Graph - Engine Load vs Brake Mean Effective Pressure in Bar at 200 Bar Injection
[image:3.595.320.537.49.435.2]Pressure.
Figure 9: Graph - Engine Load vs Brake Mean Effective Pressure in Bar at 220 Bar Injection
Pressure.
Discussion: On analysis of the values obtained for Brake Mean Effective Pressure (BMEP), B20 injected at 220 bar gives better performance than pure diesel at almost all ranges of load. The increase in performance is due to better atomization at high pressure and combustion in the engine cylinder.
C. Brake Thermal Efficiency
The efficiency of conversion of heat energy of fuel to useful work is called as brake thermal efficiency and is related to brake power. The efficiency related to indicated power is called indicated thermal efficiency. The difference in efficiency values between indicated and brake thermal efficiency is the loss which should be reduced. The values obtained at 180 bar, 200 bar and 220 bar injection pressure are given in table 5 and the graphs plotted are shown in Figures 10, 11 and 12 respectively.
Engine Load
AT 180 BAR AT 200 BAR AT 220 BAR
B20 DIESEL B20 DIESEL B20 DIESEL
0 0.37 0.77 0.63 0.58 0.45 0.42
25 18.3 18.44 18.67 18.73 20.4 18.93
50 25.64 26 25.7 27.39 27.74 25.67
75 29.1 30.48 29.03 30.49 31.73 30.54
100 32.6 32.5 31.09 32.46 32.35 32.32
[image:3.595.54.285.438.728.2]Figure 10: Graph - Engine Load vs Brake Thermal Efficiency in % at 180 Bar Injection
[image:4.595.74.265.53.225.2]Pressure.
Figure 11: Graph - Engine Load vs Brake Thermal Efficiency in % at 200 Bar Injection
Pressure.
Figure 12: Graph - Engine Load vs Brake Thermal Efficiency in % at 220 Bar Injection
Pressure.
Discussion: On analysis of the test data obtained, biodiesel B20 at 220 bar injection pressure has higher values of brake thermal efficiency than pure diesel at all ranges of engine loading conditions. The reason for higher brake thermal efficiency is due to good atomization at high pressure leading to proper and complete combustion.
Load B20 DIESEL B20 DIESEL B20 DIESEL
0 22.99 11 13.7 14.68 20.19 19.32
25 0.47 0.46 0.46 0.45 0.45 0.44
50 0.34 0.33 0.33 0.31 0.33 0.32
75 0.3 0.28 0.3 0.28 0.28 0.27
[image:4.595.77.538.59.719.2]100 0.26 0.26 0.28 0.26 0.27 0.26
Table 6: Specific Fuel Consumption in kg/kWh obtained at different injection pressure.
Figure 13: Graph - Engine Load vs Specific Fuel Consumption in kg/kWh at 180 Bar
[image:4.595.305.540.103.622.2]Injection Pressure.
Figure 14: Graph - Engine Load vs Specific Fuel Consumption in kg/kWh at 200 Bar
[image:4.595.67.269.412.663.2]International Journal of Innovative Technology and Exploring Engineering (IJITEE) ISSN: 2278-3075, Volume-9 Issue-1, November 2019
Figure 15: Graph - Engine Load vs Specific Fuel Consumption in kg/kWh at 220 Bar
Injection Pressure.
Discussion: On analysis of the data obtained, it is found that Specific Fuel Consumption (SFC) has decreased with an increase in injection pressure at all engine loading conditions. The decrease in SFC is considerably low at 220 bar injection pressure in comparison to 180 and 200 bar injection pressure. It is also found that SFCs in case of B20 at 220 bar injection pressure have a nominal increase in comparison to the values obtained for pure diesel. This may be due to high viscosity of bio oil than diesel and the same can be improved by using additives like diethyl ether or ethanol in proportion.
E. Mechanical Efficiency
When all components and parts are working together to produce power, the effectiveness of whole system is expressed in terms of mechanical efficiency and overall efficiency. The engine converts input heat energy to mechanical energy which is further converted into useful work. The values obtained for mechanical efficiencies at 180 bar, 200 bar and 220 bar injection pressure are given in table 7 and the graphs plotted are shown in Figures 16, 17 and 18 respectively.
Engine Load
AT 180 BAR AT 200 BAR AT 220 BAR
B20 DIESEL B20 DIESEL B20 DIESEL
0 0.77 1.49 0.81 1.04 0.87 0.76
25 36.78 37.05 34.51 35.52 40.51 40.49
50 56.79 56.91 52.55 52.49 57.38 57.04
75 67.44 67.61 62.41 62.93 69.58 68.61
[image:5.595.68.271.49.215.2]100 74.23 75.39 71.02 71.78 76.37 75.5
[image:5.595.322.530.51.188.2]Table 7: Mechanical Efficiency in % obtained at different injection pressure.
Figure 16: Graph - Engine Load vs Mechanical Efficiency in % at 180 Bar Injection Pressure.
Figure 17: Graph - Engine Load vs Mechanical Efficiency in % at 200 Bar Injection Pressure.
Figure 18: Graph - Engine Load vs Mechanical Efficiency in % at 220 Bar Injection Pressure.
Discussion: The data obtained through the test are analyzed and it is found that at 220 bar injection pressure, mechanical efficiency of B20 are higher than pure diesel at 220 bar. The reason for higher efficiency is complete combustion of fuel injected due to higher atomization and extra content of oxygen in algae biomass.
VI. DISCUSSIONS ON EXHAUST GAS
EMISSIONS OF B20 BIODIESEL AND PURE DIESEL AT 180, 200 AND 220 BAR
INJECTION PRESSURE
Biodiesel blend B20 and Pure Diesel are tested for their emission characteristics at 180, 200 and 220 bar injection pressure. The analysis of emissions of Carbon Monoxide (CO) in %, Carbon Dioxide (CO2) in %, Oxygen (O2) in %,
Hydro Carbon (HC) in ppm and Nitrogen Oxides (NOX) in
ppm is done at different engine loading conditions i.e. 0%, 25%, 50%, 75% and 100%.
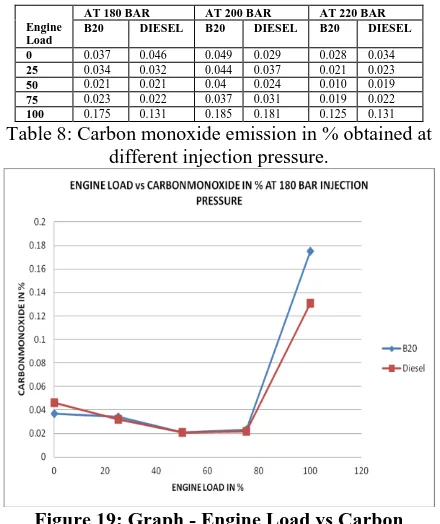
A. EMISSION OF CARBON MONOXIDE (CO)
[image:5.595.56.282.490.748.2]Figure 19: Graph - Engine Load vs Carbon Monoxide Emission in % at 180 Bar Injection
[image:6.595.59.279.48.310.2]Pressure.
Figure 20: Graph - Engine Load vs Carbon Monoxide Emission % at 200 Bar Injection
Pressure.
Figure 21: Graph - Engine Load vs Carbon Monoxide Emission in % at 220 Bar Injection
Pressure.
B. EMISSION OF CARBON DIOXIDE (CO2)
The emission of Carbon Dioxide (CO2) in % from a heat
engine is also due to incomplete combustion of fuel and excess of oxygen content in fuel. The values obtained for emissions of carbon dioxide at 180 bar, 200 bar and 220 bar injection pressure are given in table 9 and the graphs plotted are shown in Figures 22, 23 and 24 respectively.
Engine Load
AT 180 BAR AT 200 BAR AT 220 BAR B20 DIESEL B20 DIESEL B20 DIESEL
0 1.8 1.9 1.81 1.78 1.74 1.77
25 4 4.13 3.99 3.91 3.79 3.82
50 5.99 5.91 5.92 5.89 5.44 5.75
75 7.71 7.69 7.76 7.42 7.29 7.37
[image:6.595.311.541.256.746.2]100 9.94 9.92 9.62 9.52 9.42 9.8
Table 9: Carbon monoxide emission in % obtained at different injection pressure.
Figure 22: Graph - Engine Load vs Carbon dioxide Emission in % at 180 Bar Injection
Pressure.
Figure 23: Graph - Engine Load vs Carbon dioxide Emission % at 200 Bar Injection
[image:6.595.58.280.318.744.2]International Journal of Innovative Technology and Exploring Engineering (IJITEE) ISSN: 2278-3075, Volume-9 Issue-1, November 2019
Figure 24: Graph - Engine Load vs Carbon dioxide Emission in % at 220 Bar Injection
Pressure.
Discussion: The emissions of Carbon Dioxide (CO2) in
% are slightly higher for B20 at 180 bar and 200 bar than pure diesel. The increase in emission is due to incomplete combustion of fuel and additional oxygen content in the biomass chlorella microalgae which combines with carbon monoxide to form carbon dioxide. Performance of B20 blend at 220 bar is better due to reduced Carbon Dioxide (CO2) emissions and may be considered suitable as an
alternate fuel in comparison with diesel. The emission of this green house gas has to be lowered further in order to lessen the problems arising due to global warming. Though methane and nitrous oxides are also responsible for global warming but carbon dioxide contributes much and is produced due to burning of fossil fuels like coal and petroleum.
C. Emission of oxygen (O2)
The emission of Oxygen (O2) in % from a heat engine is
also due to incomplete combustion of fuel and excess of oxygen content in fuel. The values obtained for emissions of carbon dioxide at 180 bar, 200 bar and 220 bar injection pressure are given in table 10 and the graphs plotted are shown in Figures 25, 26 and 27 respectively.
Engine Load
AT 180 BAR AT 200 BAR AT 220 BAR
B20 DIESEL B20 DIESEL B20 DIESEL
0 18.15 18.31 18.31 18.36 18.12 18.14
25 15.09 15.18 15.18 15.33 15.13 15.19
50 12.52 12.55 12.55 12.64 12.56 12.65
75 9.89 10.04 9.89 9.96 10.02 10.36
100 6.81 6.89 6.89 6.94 6.62 7.09
Table 10: Oxygen emission in % obtained at different injection pressure.
Figure 25: Graph - Engine Load vs Oxygen Emission in % at 180 Bar Injection Pressure.
Figure 26: Graph - Engine Load vs Oxygen Emission in % at 200 Bar Injection Pressure.
Figure 27: Graph - Engine Load vs Oxygen Emission in % at 220 Bar Injection Pressure.
Discussion: The emissions of Oxygen in % have reduced in case of B20 at all pressures i.e. 180 bar, 200 bar and 220 bar in comparison to pure diesel and has to be reduced further by achieving complete combustion of carbon containing fuel. There is a need to reduce emission of oxygen as it combines with nitrogen present in air to produce nitrogen oxides which is also responsible for acid rain.
D. Emission of Hydrocarbons (HC)
The emission of Hydrocarbons (HC) in ppm from a heat engine is actually unburned fuel. They contribute photochemical smog in certain climatic conditions. The values obtained for emissions of Hydrocarbons (HC) in ppm at 180 bar, 200 bar and 220 bar injection pressure are given in table 11 and the graphs plotted are shown in Figures 28, 29 and 30 respectively.
Engine Load
AT 180 BAR AT 200 BAR AT 220 BAR
B20 DIESEL B20 DIESEL B20 DIESEL
0 8 6 12 6 9 8
25 15 12 22 17 12 14
50 22 19 28 25 19 18
75 24 23 34 30 22 21
[image:7.595.64.276.50.220.2]100 32 26 54 50 31 25
[image:7.595.60.278.530.724.2] [image:7.595.308.548.606.689.2]Figure 28: Graph - Engine Load vs Hydrocarbons (HC) emission in ppm at 180
[image:8.595.75.265.54.209.2]Bar Injection Pressure.
Figure 29: Graph - Engine Load vs Hydrocarbons (HC) emission in ppm at 200
Bar Injection Pressure.
Figure 30: Graph - Engine Load vs Hydrocarbons (HC) emission in ppm at 220
Bar Injection Pressure.
Discussion: The emissions of Hydrocarbon (HC) emissions in ppm are slightly higher for B20 at 180 bar, 200 bar and 220 bar than pure diesel. This is due to incomplete combustion of bio diesel which can be improved further by using additives. Performance of B20 blend at 220 bar is better due to reduced Hydrocarbon (HC) emissions in comparison to the emissions at 180 bar and 200 bar injection pressure.
E. EMISSION OF OXIDES OF NITROGEN (NOX)
The emission of Oxides of Nitrogen (NOX) in ppm from a
heat engine is due to heating of air which is mainly consisting of nitrogen and oxygen gases and small fraction
25 385 375 458 462 433 481
50 810 804 833 849 811 884
75 1120 1119 1184 1203 1126 1255
[image:8.595.319.539.132.645.2]100 1358 1357 1394 1421 1313 1465
Table 12: Emission of Oxides of Nitrogen in ppm obtained at different injection pressure.
Figure 31: Graph - Engine Load vs Emission of Oxides of Nitrogen in ppm at 180 Bar
Injection Pressure.
Figure 32: Graph - Engine Load vs Emission of Oxides of Nitrogen in ppm at 200 Bar
International Journal of Innovative Technology and Exploring Engineering (IJITEE) ISSN: 2278-3075, Volume-9 Issue-1, November 2019
Figure 33: Graph - Engine Load vs Emission of Oxides of Nitrogen in ppm at 220 Bar
Injection Pressure.
Discussion: The emissions of Oxides of Nitrogen (NOX) in ppm are slightly higher for B20 at 180 bar but it is lesser at 200 bar and 220 bar injection pressures than pure diesel. Performance of B20 blend at 220 bar is found to be more better due to very less difference in the values obtained for B20 and pure diesel. This can be further improved by pre-heating of the fuel and burning it at low temperature which can be achieved with exhaust gas recirculation for pre-mixed burning of fuel.
VII. CONCLUSION AND FUTURE SCOPE
The methyl ester B20 of Chlorella microalgae fuel are tested for performance characteristics with respect to mechanical properties like Brake Power, Mean Effective Pressure, Specific Fuel Consumption, Brake Thermal Efficiency and Mechanical Efficiency at 0%, 25%, 50%, 75% and 100% engine loading conditions in a Kirloskar Variable Compression Ratio Diesel engine. The values obtained for the blend B20 at 180 bar, 200 bar and 220 bar injection pressures are compared with the values obtained for pure diesel in similar conditions and injection pressures. The methyl ester B20 of chlorella species is also tested for their emission characteristics at 180 bar, 200 bar and 220 bar injection pressures for Carbon Monoxide (CO), Carbon Dioxide (CO2), Oxygen (O2), Hydrocarbons (HC) and
Oxides of Nitrogen (NOx) using 5 gas analyzer and compared with the values obtained for pure diesel. It is found that the performance and emission characteristics for B20 at 220 bar injection pressures are more or less matching with the values obtained for pure diesel and can be considered as an alternate fuel in future by improving its combustion properties using suitable additives. The present requirement is to search and develop an alternate to fossil fuels to reduce high emissions of green house gas i.e. carbon dioxide gas for which burning of fossil fuels has become the major source of emissions. In future, the properties of the oil extracted from this biomass can be improved further by reducing its viscosity by adding additives and can become a major source of biodiesel.
AUTHOR PROFILE
Mr. Sanjay Singh is currently working as a teaching faculty and research scholar in the Department of Mechanical Engineering of Vinayaka Mission’s
Kirupananda Variyar Engineering College,
Periyaseeragapadi, Salem, A constituent college of Vinayaka Mission’s Research Foundation, Deemed to be University, Salem, Tamil Nadu. He has completed his AMIE in Mechanical Engineering from The Instituion of Engineers (India), Kolkata and M.E. in Automation and Robotics from University College of Engineering, Osmania University, Hyderabad. His areas of interest is Jet Propulsion and is doing his research work on alternate fuel particularly in the methyl ester produced from the Chlorella microalgae and its suitability for use in aviation and automobiles. He has already published four papers in International Journals.
Dr. M. Prabhahar obtained his Under Graduation in BE Mechanical Engineering at Jayamatha Engineering College, Nagercoil. He completed his his Post Graduation from Mepco Schlenk Engineering College, Sivakasi. He completed his Research work and got his Ph.D. Degree from St. Peters University, Chennai. At the time of submission of his thesis, he had fifteen publications to his credit. He acquired his Ph.D. for his research work in the area of IC Engines performance and Emission Control using alternate fuels. His assiduous and prolific research work has earned him very good reputation in the field of bio alternate fuels. He has 85 citations in the International Journals including Springer, Taylor and Francis and IEEE proceedings. He is a member of several technical executive committees on National and International conferences and potential reviewer of several journals which in turn reviewing minimum four papers per month. His research paper “Modeling and construction of bio diesel processor”, has been selected for the cover note article for the Global Journal of Research in Engineering, USA. He has to his credit, more than 40 publications in reputed journals and has h-index as 5. He is also extending his meritorious service of being referee of many reputed journals. He is currently working as Professor in Department of Mechanical Engineering, Aarupadai Veedu Institute of Technology, Paiyanoor, Chennai.
Mr. R Venkatesh is currently working as a teaching faculty and research scholar in the Department of Mechanical Engineering of Vinayaka Mission’s Kirupananda Variyar Engineering College, Periyaseeragapadi, Salem, A constituent college of Vinayaka Mission’s Research Foundation, Deemed to be University, Salem, Tamil Nadu. He has completed his B.E. in Mechanical Engineering from Kongu Engineering College, Perundurai, Erode and M.E in Computer Aided Design from Govt. College of Engineering Salem, Anna University, Chennai. His area of interest is low heat rejection in automotive engines and alternate fuel. He has already published 05 papers in international journals.
REFERENCES
1. Saravanakumar M, Prabhahar M, Krishnamoorthi S, Sendilvelan S, Emission characteristics of biodiesel derived from used cooking oil blended with diesel in the presence of potassium hydroxide (KOH) catalyst as alternative fuel for diesel engines , Rasayan Journal of Chemistry, 11 (2018).
2. V Naresh and S Prabhakar, Performance and Emission Characteristics of Algae Oil on VCR Diesel Engine, Journal of Chemical and Pharmaceutical Research, 2018, 10(4).
3. A. S. Sarpal, C. R. Ingrid et al., Investigation of Biodiesel Potential of Biomass of Microalgaes Chlorella, Spirulina and Tetraselmis by NMR and GC-MS Techniques, J. Biotechnol., 6, 1 (2016).
4. Krishnamoorthi S, Prabhahar M, Saravanakumar M, Sendilvelan S, Yield characteristic of biodiesel derived from used vegetable oil methyl ester (UVOME) blended with diesel, in the presence of sodium hydroxide (NAOH) and potassium hydroxide (KOH) catalyst, as alternative fuel for diesel engines, International Journal of Mechanical and Production Engineering Research and Development (IJMPERD), 2018.
(2013).
10. Prakash S, Prabhahar M, Sendilvelan S, Singh S, Bhaskar K, Experimental studies on the performance and emission characteristics of an automobile engine fueled with fish oil methyl ester to reduce environmental pollution, Energy Procedia, 2019.
11. S. P. Anne, E. Harman-Wave et al., Micro Algae as a Renewable Fuel Source-Fast Pyrolysis of Scenedesmes, Renew. Energy, 60, 625-632 (2013).
12. R. Velappan, S. Sivaprakasam and M. Kannan, Study the Performance of Algae Oil in Diesel Engine with Various Injection Pressure, IRJET, 2(5) (2015).
13. Mata, T. M., A. A. Martins, and N. S. Caetano. 2010. “Microalgae for biodiesel production and other applications: a review.” Renewable and Sustainable Energy Reviews 14 (1): 217–32.
14. J. Kuberan and N. Alagumurthi: Performance and Emission Characteristics of Algae Bio-fuelled Diesel Engine, Int. J. Chem. Sci.: 14(4), 2016.
15. Ramachandra, T.V., M. Durga Madhab, S. Shilpi, N.V. Joshi. 2013. “Algal biofuel from urban wastewater in India: scope and challenges.” Renew. Sustain. Energy Review; 21: 767–77.
16. R. Velappan et al., Investigation of Single Cylinder Diesel Engine using Biodiesel from Marine Algae, IJISTE, 1(4) (2014).
17. Prabhahar M, Sendilvelan S, Sassykova L.R, Studies on pongamia oil methyl ester fueled direct injection diesel engine to reduce harmful emissions .
18. Ponnusamy, S., H. K. Reddy, T. Muppaneni, C. M. Downes, and S. Deng. 2014. “Life cycle assessment of biodiesel production from algal bio-crude oils extracted under subcritical water conditions.” Bioresource Technology170: 454–61.
19. T. Varghese, J. Raj, E. Raja and C. Thamotharan, Performance and Emission Testing on Algae Bio-fuel using Additives, IJEAT, 4(5) (2015).
20. G. Nagane and C. Choudhari, Emission Characteristics of Diesel Engine Fueled with Algae Biodiesel –Diesel Blends, IRJET, 2(4) (2015).
21. Kumar M.S, Prabhahar M, Sendilvelan S, Venkatesh R, Bhaskar K, Combustion, performance and emission analysis of a diesel engine fueled with methyl esters of Jatropha and fish oil with exhaust gas recirculation, Energy Procedia, 2019.
22. J. Jayaprabakar, A. Karthikeyan, Aashwin Josiah and Anushajan, Experimental Investigation on the Performance and Emission Characteristics of a CI Engine with Rice Bran and Micro Algae Biodiesel Blends, JCHPS Special Issue, 7 (2015).
23. R. Velappan, S. Sivaprakasam and M. Kannan, Study the Performance of Algae Oil in Diesel Engine with Various Injection Pressure, IRJET, 2 (5) (2015).