Towards a Scientific Impact Measuring Framework for
Large Computing Facilities - a Case Study on XSEDE
Fugang Wang
Indiana University 2719 10th Street Bloomington, Indiana, U.S.A.
Gregor von Laszewski
∗Indiana University 2719 10th Street Bloomington, Indiana, U.S.A.
[email protected]
Geoffrey C. Fox
Indiana University 2719 10th Street Bloomington, Indiana, U.S.A.
Thomas R. Furlani
Center for Computational Research
University at Buffalo, SUNY 701 Ellicott Street Buffalo, New York, 14203
Robert L. DeLeon
Center for Computational Research
University at Buffalo, SUNY 701 Ellicott Street Buffalo, New York, 14203
Steven M. Gallo
Center for Computational Research
University at Buffalo, SUNY 701 Ellicott Street Buffalo, New York, 14203
ABSTRACT
In this paper we present a framework that (a) integrates pub-lication and citation data retrieval, (b) allows scientific im-pact metrics generation at different aggregation levels, and (c) provides correlation analysis of impact metrics based on publication and citation data with resource allocation for a computing facility. Furthermore, we use this framework to conduct a scientific impact metrics evaluation of XSEDE, and to carry out extensive statistical analysis correlating XSEDE allocation size to the impact metrics aggregated by project and Field of Science. This analysis not only helps to provide an indication of XSEDE’S scientific impact, but also provides insight regarding maximizing the return on invest-ment in terms of allocation by taking into account Field of Science or project based impact metrics. The findings from this analysis can be utilized by the XSEDE resource allo-cation committee to help assess and identify projects with higher scientific impact. It can also help provide metrics re-garding the return on investment for XSEDE resources, or campus based HPC centers.
Categories and Subject Descriptors
H.4 [Information Systems Applications]: Miscellaneous;
D.2.8 [Software Engineering]: Metrics—complexity
mea-sures, performance measures
General Terms
Theory
∗Corresponding Author.
Keywords
Scientific impact, bibliometric, h-index, Technology Audit Service, XDMoD, XSEDE
1.
INTRODUCTION
It is a well-known fact that many science and engineering innovations and discoveries are increasingly dependent on access to high performance computing resources. For many researchers, this demand is met by large-scale compute re-sources that cannot typically be supported by any single research group. Accordingly, dedicated large-scale comput-ing facilities, in which resources are shared among groups of researchers, while the facilities themselves are managed by dedicated staff, play an important role in scientific re-search. Indeed, the National Science Foundation and the De-partment of Energy have supported such facilities for many years. One such facility is the Extreme Science and Discov-ery Environment (XSEDE). XSEDE is an evolution from the TeraGrid [1] and provides large scale resources to researchers from the US and their international collaborators with access to large scale computational resources. Researchers must submit first a proposal that is peer reviewed before they can gain access. Upon approval of the proposal, the researcher is granted a predefined amount of resources, e.g., comput-ing core-hours (typically measured in service units), storage space, and technical support. Because the resources repre-sent a substantial investment by NSF, justification for their use is warranted and questions regarding the scientific im-pact of these resources naturally arise, including:
1. Is there a way to measure the impact that such facili-ties provide to scientific research?
2. Is there a correlation between the size of a given allo-cation and the scientific impact of an individual user, a given project, or a field of science?
To answer these questions, first we need a process to quan-tify the scientific outcome for the individual researchers. Secondly we need to define and generate metrics to measure the scientific impact for individual researchers and higher level aggregated entities. Finally we correlate the impact metrics to the consumed resources, to provide insight on how the computing facility benefits and impacts the science conducted utilizing its resources. In this paper, we present a framework that addresses these questions and processes. It is important to point out that measuring scientific impact can be quite controversial and that the presented results do not necessarily represent an absolute measure of the impact of a scientific project, but rather the results we present rep-resent one of many factors that together define the scientific impact.
Furthermore, while we have restricted our analysis of sci-entific impact as it relates to XSEDE, the work presented here has general applicability to other HPC resources, in-cluding importantly campus based HPC centers.
In particular we focus our effort to identify impact based on scientific publications as the base unit of the research pro-ductivity, and obtain data as well as derive various metrics based on publication data to measure the impact of indi-vidual users, projects, Field of Science (FOS), and XSEDE itself as a whole.
In the following sections we will first briefly discuss the re-lated work (Section 2), then present our designed framework (Section 3) and implementation details (Section 4). The re-sults and discussions then follow (Section 5). Finally, we outline the ongoing activities and our future plans (Section 6) and provide a summary (Section 7).
2.
RELATED WORK
Our choice of using publication as the basic unit to mea-sure the scientific impact is supported by the fact that bib-liometrics based criteria is one of the de-facto standards to measure the impact of research. For example, publication derived metrics are broadly used in faculty recruit/promotion, and institutional rankings [2].
While usage based metrics are proposed by some [3, 4, 5], citation based metrics are probably still the standard, most widely accepted measure. For instance, nanoHub uses pub-lication and citation derived metrics to measure the impact of their project [6].
In addition to the intuitive measures like number of pub-lications and number of citations, h-index [7] and g-index [8] are two other popular metrics. The publication count is often related to a measure of the productivity, while ci-tation counts are often related to the quality, or impact of the work published. As h-index and g-index calculate the metric by combining this data, they measure both the pro-ductivity and the quality, thus providing a general measure for impact.
There are existing tools to measure the metrics for individ-ual users, e.g. Scholarometer [9] and Publish or Perish [10]. These could be potentially leveraged to analyze a relatively small group of users, e.g., the work [11] showing TeraGrid’s impact based on limited data from one resource allocation meeting consisting of only 112 selected PIs. However, nei-ther of the tools provides a scalable solution to the large community we are concerned with here, namely the 20,000 users who have utilized TeraGrid/XSEDE resources.
While more formal publication based metrics, either based
on citation or usage, are still the most widely employed criteria, there are other proposals to include other
mea-sures. E.g., altmetrics [12] proposes to include measures
for dataset, code; as well as mentioning of a snippet of work via social networking; among others. We acknowledge these efforts as the trend of big data and social networking might suggest, however at this time there still lacks a standard and a well-established way to objectively derive scientific impact from these data sources.
3.
SYSTEM DESIGN
NSF AWD pub data for XD
people
XD Entities Views NSF
AWDsearch - source XDcDB mirror
(Portal Publicatiions and Accounts)
TAS pubs mashup db XDMOD Data
Warehouse
NSF AWDSearch DB Pub mining
TAS Pub mashup TAS Pub RESTful Services Query 3rd party services
RESTful API
3rd party data/services
Microsoft Academic Search
Mendeley Google Scholar (General search and user
profile) ISI Web
of Science
CiteSeerX, PUBMed, ACM, IEEE ……
_ _ _ _ _ _ _ _ _ _ _ _ _ _ _ _ _ _ _ _ _ _ _ _ __ _ _ _ _ _ _ _ _ _ _ _ _ _ _ _ _ _ _ _ _ _ _ _ _ _ _ _ _ _ _ _
_ _ _ _ _ _ _ _ _ _ _ _ _ _ _ _ _ _ _ _ _ _ _ _ _ _ _ _ _ _ _ _ _ _ _ _ _ _ _ _ _ _ _ _ _ _ _ _ _ _ _ _ _ _ _ _ _
_ _ _ _ _ _ _ _ _ _ _ _ _ _ _ _ _ _ _ _ _ _ _ _ _ _ _ _ _ _ _ _ _ _ _ _ _ _ _ _ _ _ _ _ _ _ _ _ _ _ _ _ _ _ _ _ _ Service / GUI
App
Data
External Resource/
Service
IU
UB
external
POPS (Proposal
data)
NCSA
[image:2.612.319.551.175.451.2]Portal Presentation
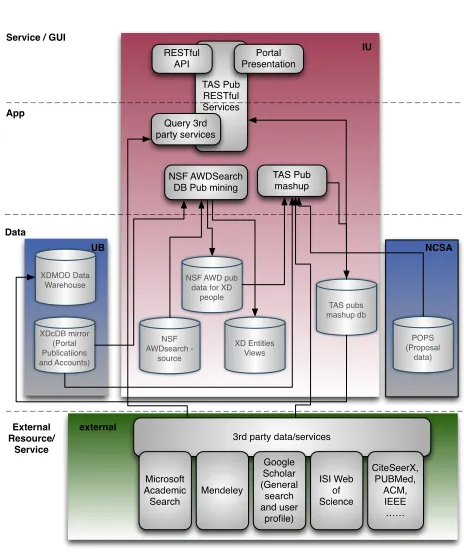
Figure 1: The Architecture of the Framework
API.
Fig 1 shows the layered system architecture, with an em-phasis on the relationships between related components
es-pecially those integrating with databases. On the coreApp
layer we have the database mining and publication mashup components. The database mining component queries the NSF award database for each XSEDE user from the XDcDB mirror. It generates the XSEDE user specific publication data as well as user, project, and Field of Science (FOS) views. The publication mashup component aggregates the publication data mined from the previous component, as well as those from XDcDB, and from other available exter-nal services. It also retrieves citation data for each publi-cation from external services, e.g. Google Scholar and ISI Web of Science. Another essential task of this component is to generate metrics for users, projects, and FOS in which the POPS db is involved to get proposal and project data. These data will be then stored into the mashup db which can be integrated into the XDMoD [13, 14, 15, 16, 17] sys-tem at our partner site UB. We also expose some data and analysis results via RESTful API and a portal as denoted
on theService/GUI layer. TheData layer illustrates the
databases involved, which include XDcDB mirror and XD-MoD data warehouse at UB, the POPS db at NCSA, and
the rest at IU. TheExternal Resource/Serviceslayer lists
the third party resource and services that we are currently using or have experimented or plan to investigate.
For this study, the general workflow is that we obtain the publication data for each XSEDE user, and then retrieve the citation data for each publication. The data is originally collected per user and per publication basis, but can also be aggregated based on organization, XSEDE project/account, FOS, and other categories while providing the input for the metrics generation and analysis. When correlating the data with the input (for example the Service Units awarded by XSEDE) the analysis may reveal patterns and trends of how XSEDE can impact the sciences and possibly helps to achieve a better measure of return on investment (ROI) for NSF.
While we are using the system to analyze the scientific impact of XSEDE, the framework itself is flexible enough that could be easily adapted to other similar systems for impact measure and analyses.
4.
IMPLEMENTATION
We have implemented the system following best practices
and leveraging popular tools and frameworks. The core
system is developed in python using the python libraries
MySQLdb,SQLAlchemy,psycopg2 to interact with the
var-ious data sources. Python library requests and
Beautiful-Soup are leveraged for scraping citation data and properly
parsing them. TheFlask framework is used for the service
interface and Web GUI. Various JavaScript libraries such as
highcharts are utilized in the Web tier.
Publication and citation data retrieval was a complex but essential part of our study, so we provide details of the pro-cess next.
4.1
Publication Data Acquisition
Given the size of the TeraGrid/XSEDE user database, which as of Jan 2014 was over 20,000 users, we hoped to employ an automated approach to obtain publication data for each of the users. Publication citation data are available
1990 1995 2000 2005 2010
1
10
100
1000
10000
year
# pubs
(a) Number of Publications Retrieved by Year
●
0
1
2
3
4
by project
log10(# pubs)
● ● ●
●
−2
−1
0
1
2
3
per user avg by project
log10(# pubs)
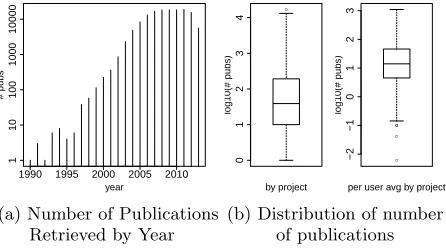
(b) Distribution of number of publications
Figure 2: Distribution of the Publication Data
via subscribed resources such as ISI Web of Science [18] or open access such as Google Scholar [19], Microsoft Academic Search [20], and Mendeley [21], however they unfortunately usually do not provide unlimited access, making automated publication retrieval impractical.
Another approach is to obtain the publication data di-rectly from the users. This is desirable since user curated data tends to be more accurate in comparison to automated publication mining. Additionally, it can provide extra infor-mation regarding a publication’s association with the sys-tem, e.g., to which project a given publication is associated with. For example FutureGrid has implemented such a user-based system leveraging the drupal biblio module [22] with some customization to support easy publication reporting and mass publication imports directly by the users. This upload is correlated with the project the publication(s) is (are) most closely related to [23]. XSEDE followed similar approach and now provides it via their XSEDE portal [24] using a different portal framework. The nanoHub citation analysis [6] as we have mentioned is also based on publica-tion data submitted by users via a web form.
The framework reported on in this paper supports plug-gable data sources that allow for the mining of databases and/or accessing 3rd party service APIs for publication data. We have experimented with various data sources includ-ing Microsoft Academic Search, Google Scholar includinclud-ing user profiles, and mining the extensive NSF award database that is available upon request from NSF. The extracted data records are then stored into our Mashup database that pro-vides a common interface to other components in the system as well as collaborating systems like XDMoD.
In this study we focus only on two of these data sources -the user submitted publication data via -the XSEDE portal, and the extensive NSF award database for automated min-ing. The former source has user curated data with project affiliation information, and thus in principal it gives a
mea-sure ofdirect impact of XSEDE. However, since this system
pro-vide a measure on a general orindirect impact of XSEDE. As a given XSEDE user is affiliated with accounts/projects, and the projects are part of one or more FOS, we can thus tag a publication as being related to the projects and a FOS based on these indirect correlations. Although not ideal, it
provides a means to analyze theindirect impact.
Based on this technique, we have been able to obtain over 142,000 publication entries for over 20,000 XSEDE users as of Jan 2014. This by itself is a substantial accomplishment and as we know of no other database that has this level of detail that can be correlated to researcher’s participating in XSEDE. To provide a quick overview of the data analyzed we refer to Figure 2 showing the yearly distribution of the publications (histogram in (a)), and the distribution of num-ber of the publications by project (left boxplot in (b)) and by per user for each project (right boxplot in (b)).
4.2
Citation Data Retrieval
While for the publication data from the user curated data might be more ideal, we need to conduct an automated search to identify the subsequent citations of the publication recovered from the NSF award database to help provide an indication of the quality of the research.
Due to the size of this publication data (over 142,000 pub-lications), the only realistic way to accomplish this is with an automated process. Google Scholar and ISI Web of Sci-ence provide such data but with some noticeable limitations. In case of Google Scholar the API is not provided, nor does it allow unlimited access within a bounded time period from one request source. ISI data does not impose a rate limiting while you have subscribed access, however it does also not provide an easy access API. Thus we were forced to emulate such an API while submitting queries via the web UI and then parse the data from the tabulated results list.
In order to compare the two methods of obtaining cita-tions, we explored Google Scholar and ISI data for a subset of the publication data, and did a comparison of the results. While a similar comparison has been attempted [25], it was restricted to a very small sample size - 2 people and about 100 publications. In comparison, our study included 33,861 publications and 1,462 users, moreover they are related to XSEDE.
1 5 50 500
1
5
50
500
Citation count from ISI
Citation count from GS
gs=7.02+1.14isi(linear fit)
r: 0.8411
y=x (Reference line) Citation data from GS vs ISI
(a) Citation counts comparison for a subset of
our publication data
● ● ● ● ● ● ●● ● ● ● ● ● ● ● ● ● ● ● ● ● ● ● ● ● ● ● ● ●● ● ● ● ● ● ● ● ● ● ● ● ● ● ● ● ● ● ● ● ● ● ● ● ● ●● ● ● ● ● ●● ● ● ● ● ● ● ● ● ● ● ● ● ● ● ● ● ● ● ● ● ● ● ● ● ● ● ●● ● ● ● ● ● ● ● ●● ● ● ● ● ● ● ● ● ● ● ● ● ● ● ● ● ● ● ● ● ● ● ● ● ● ● ● ● ● ● ● ● ● ●● ● ● ● ● ● ● ● ● ● ● ● ● ● ● ● ● ● ● ● ● ● ● ● ● ● ● ● ● ● ● ● ● ● ● ● ● ● ● ●● ● ●● ● ● ● ● ● ●● ● ● ● ● ● ● ● ● ● ● ● ● ● ● ● ● ● ● ● ● ● ● ● ● ● ● ● ● ● ● ● ● ● ● ● ● ● ● ● ● ● ● ● ●● ● ● ● ● ● ● ● ● ● ● ● ● ●● ● ● ● ● ● ● ● ● ● ● ● ● ● ● ● ● ● ● ● ● ● ●● ● ●● ● ● ● ● ● ● ● ● ● ● ● ● ● ● ● ● ● ● ● ● ● ● ● ● ● ● ● ● ● ● ● ● ● ● ● ● ● ● ● ● ● ● ● ● ● ● ● ● ● ● ● ● ● ● ● ● ● ● ● ● ● ● ● ● ● ● ● ● ● ● ●● ● ● ● ● ● ● ● ● ● ● ● ● ● ● ● ● ● ●● ● ● ● ●● ● ● ● ● ● ● ● ● ● ● ● ● ● ● ● ● ● ● ● ● ● ● ● ● ● ● ● ● ● ● ● ● ● ● ● ●● ● ● ●● ● ● ● ● ● ● ● ●● ● ● ● ● ● ● ● ● ● ● ● ● ● ● ● ● ● ●● ● ● ● ● ●● ● ● ● ● ● ● ● ● ● ● ● ● ● ● ●● ● ● ● ●● ● ● ● ● ● ● ● ●● ● ● ● ● ● ● ● ● ● ● ● ● ● ● ● ● ● ● ● ● ● ● ● ● ● ● ● ● ● ● ● ● ● ● ● ● ● ● ● ● ● ● ● ● ● ● ● ● ● ● ● ● ● ● ● ● ● ● ● ● ● ● ● ● ● ● ● ● ● ● ● ● ● ● ● ● ● ● ● ● ● ● ● ● ● ● ● ● ● ● ● ● ● ● ● ● ● ● ● ● ● ●● ● ● ● ● ●●● ● ● ● ● ● ● ● ● ● ● ● ● ● ● ● ● ● ● ● ● ● ● ● ● ● ● ● ● ● ● ● ● ● ● ● ● ● ● ● ● ● ● ● ● ● ● ● ● ● ● ● ● ● ● ● ● ● ● ● ●● ● ● ● ● ● ● ● ● ● ● ● ●● ● ● ● ● ●● ● ● ● ● ● ● ● ● ● ● ● ● ● ● ● ● ● ● ● ● ● ● ● ●● ● ● ● ● ● ● ● ● ●● ● ● ● ● ● ● ● ● ● ● ● ● ● ● ● ● ● ● ● ● ● ● ● ● ● ● ● ● ● ● ● ●● ● ● ● ● ● ● ● ● ● ● ● ●● ● ● ● ● ● ● ● ● ● ● ● ● ● ● ●● ● ●● ● ● ● ● ● ● ● ● ● ● ● ● ● ● ● ● ● ● ● ● ● ● ● ● ● ● ● ● ● ● ● ● ● ● ● ● ● ● ● ●● ● ● ● ● ● ● ● ● ● ● ● ● ● ● ● ● ● ● ● ● ● ● ● ● ● ● ● ● ● ● ● ● ● ● ● ● ● ● ● ● ● ● ● ● ● ● ● ● ● ● ● ● ● ● ● ● ● ● ● ● ● ● ● ● ● ● ● ● ● ● ● ● ● ● ● ● ● ● ● ● ● ● ● ●● ● ● ● ● ● ● ● ● ● ● ● ●● ● ● ● ● ● ●● ● ● ● ●●● ● ● ● ● ●● ● ● ● ● ● ● ● ● ● ● ● ● ● ● ● ● ● ● ● ● ● ● ● ● ● ● ●●● ● ● ● ● ● ● ● ● ● ● ● ● ● ● ● ● ● ● ● ● ● ● ● ● ● ● ● ● ● ● ● ●● ● ● ● ● ● ● ● ● ● ● ● ●● ● ● ● ● ● ● ● ● ● ● ● ● ● ● ● ● ● ● ● ● ● ● ● ● ● ● ● ● ● ● ● ● ● ● ● ● ● ● ● ● ● ● ● ● ● ● ● ● ● ● ● ● ● ● ● ● ● ● ● ●● ● ●● ● ● ● ● ●● ● ● ● ● ● ● ● ● ● ● ● ● ● ● ● ● ●●●●● ● ● ● ● ● ● ●● ● ● ● ● ● ● ● ● ● ● ● ● ●● ● ● ● ● ● ● ● ● ● ● ● ●● ● ●● ● ●● ● ● ● ● ● ● ● ● ● ● ● ● ● ● ● ● ● ● ●● ● ● ● ●● ● ● ● ● ● ● ● ● ● ● ● ● ● ● ● ● ● ● ● ● ● ● ● ● ● ● ● ● ● ● ● ● ● ● ● ● ● ● ● ● ● ● ● ● ● ●● ● ● ● ● ●● ● ● ● ● ● ● ●● ● ● ● ● ● ● ● ● ● ●●● ● ●● ● ●● ● ● ● ● ● ● ● ● ● ● ● ● ●● ● ● ● ● ● ● ● ● ● ● ● ● ● ● ● ● ● ● ● ● ● ● ● ●● ● ● ● ● ● ● ● ● ● ● ● ●● ● ● ● ● ● ● ● ● ● ● ● ● ● ● ● ● ● ● ● ● ● ● ● ● ● ● ● ● ● ● ● ● ● ● ● ●● ● ● ● ● ● ● ● ● ● ● ● ● ● ● ● ● ● ● ●● ● ● ● ● ● ● ● ● ● ● ●● ● ●● ● ● ● ● ● ● ● ● ● ● ● ● ● ● ● ● ● ● ● ● ● ● ● ● ● ● ● ● ● ● ● ● ● ● ● ●●●● ● ● ● ● ● ● ● ● ● ● ● ● ●● ● ● ● ● ● ● ● ● ● ● ● ● ● ● ● ● ● ● ● ● ● ●●● ● ● ● ● ● ● ● ● ● ●● ● ● ● ● ● ● ● ● ● ● ● ● ● ● ● ● ● ● ● ● ●
0 10 20 30 40 50 60
0
20
40
60
h−index based on ISI
h−inde
x based on GS
gs=0.09+1.14isi (Linear fit)r: 0.9669
y=x (Reference line) H−index based on GS vs ISI
[image:4.612.55.277.508.649.2](b) H-index comparison for a subset of XSEDE PIs
Figure 3: Comparison of metrics derived from GS vs ISI
The result of this activity is depicted in part (a) of Figure 3 which correlates the citation data from Google Scholar (GS) with the ISI Web of Science (ISI). Out of the 33,861 data
points (one for each publication), 20,793 of them (61.4%) have larger values in GS, 10,315 (30.5%) are the same, while 2,753 (8.1%) have larger values in ISI. 5,287 (15.6%) publi-cations have zero citation found in ISI but non-zero in GS, 1,253 (3.7%) pubs have zero citation in GS but non-zero in ISI. Thus we conclude that in general Google Scholar tends to have a higher citation number.
Figure 3 part (b) shows h-index derived from Google Scholar citation data correlating to that calculated from ISI citation data. Out of the 1,462 data points (one for each PI), 663 of them (45.3%) have larger value in GS, 677 (46.3%) are the same, while 122 (8.3%) have larger value in ISI. 52 (3.6%) PIs have zero h-index computed from ISI data but are non-zero in GS, 39 (2.7%) for the reverse side. Thus we conclude that in general the h-index calculated from Google Scholar data tends to be a bit higher.
In either case a high positive correlation is observed. The Pearson correlation coefficients (r) are 0.84 and 0.97 respec-tively. The very strong correlation of the h-index values are mostly due to the fact that one of the two factors determin-ing the h-index, the number of publications, stay the same for a particular user.
Based on our study while being aware of the limitations, we were able to use the ISI citation data to get very similar measures for most of the data especially for the h-index met-ric. This is especially useful if we consider that we do have issues to retrieve a complete citation data set from Google scholar for each of our relevant users and publications.
Thus the following analyses are only using citations from ISI to further derive other metrics.
5.
RESULTS AND ANALYSES
The previous section described the method used to ex-tract publication and citation data for XSEDE users. With this data now in hand, we discuss the metrics derived from this data with the goal of providing a measure of scientific impact. We will also conduct analyses to determine if a cor-relation exists between the data and various categories such as field of science.
5.1
Direct impact of XSEDE
By using the user vetted submitted publications only, we
were able to show thedirectscientific impact of XSEDE. As
of Jan 27, 2014, there are currently registered 837 publica-tions involving 882 XSEDE users as authors, 220 organiza-tions, 331 XSEDE projects, and a total of 11,258 citations to date. Please note that these values are based on incomplete and continuously growing publication data as not all users have contributed their publications to XSEDE projects, or they have not uploaded them to the portal yet. This will change however, as the XSEDE’s revised allocation request process will now dramatically improve the ease at which users can upload their publication information. We there-fore expect the quality and quantity of user publication data residing in the XSEDE database to improve significantly in the future.
Based on this data, we calculated a series of metrics ag-gregated by user, organization, project, and FOS. Figure 4 shows the results of this analysis for FOS, listing the FOS’s with the highest h-index values. For each FOS, we include
the number of publications (as header# of Pubs), number of
citations (as headerCited by), h-index and g-index. We also
Figure 4: Impact metrics for top FOS sorted by h-index (based on currently available data as of Jan 2014)
the h-index over the years spaned by the publications. This could be used to compare the efficiency between peers if they have the same h-index. Another metric we compute is i10-index [26] which was first introduced in Google Scholar that simply measure the publication count of those received
over 10 citations each. For all the metrics excluding them
factor for h-index, we also compute arecent version which
was computed using only the publications published from the last 5 years. This helps to compare the peers based on recent work by eliminating effects from old publications.
5.2
Project metrics vs SUs allocation
2 4 6 8
1
2
3
4
log10(SUs allocation)
log10(# pubs)
2 4 6 8
0
1
2
3
4
5
log10(SUs allocation)
log10(# cited)
2 4 6 8
0.0
0.5
1.0
1.5
2.0
log10(SUs allocation)
log10(h−inde
x)
2 4 6 8
0.0
0.5
1.0
1.5
2.0
2.5
log10(SUs allocation)
log10(g−inde
[image:5.612.315.550.239.452.2]x)
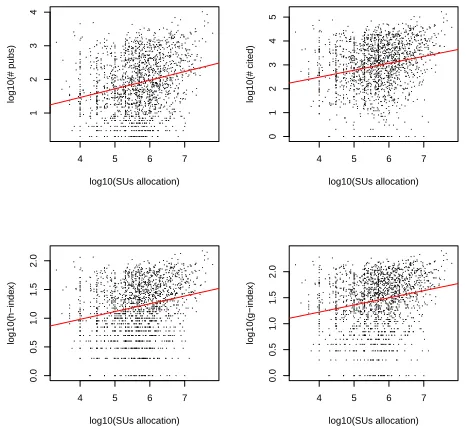
[image:5.612.51.286.371.587.2]Figure 5: Impact Metrics (number of publications, number of citations, h-index, g-index) vs SUs for all projects
Figure 5 shows the correlation analysis of impact met-rics (number of publications, number of citations, h-index, and g-index) versus XSEDE resource allocation (number of SU’s) for an individual project (research, start-up, cam-pus champion, etc). Previous work showed a stronger cor-relation between the citation and SUs [11] using a much smaller sample size taken from a specific XSEDE resource
4 5 6 7
1
2
3
4
log10(SUs allocation)
log10(# pubs)
4 5 6 7
0
1
2
3
4
5
log10(SUs allocation)
log10(# cited)
4 5 6 7
0.0
0.5
1.0
1.5
2.0
log10(SUs allocation)
log10(h−inde
x)
4 5 6 7
0.0
0.5
1.0
1.5
2.0
log10(SUs allocation)
log10(g−inde
x)
Figure 6: Impact Metrics (number of publications, number of citations, h-index, g-index) vs SUs for research projects
Correlation with SUs allocation r (Pearson's) df p-‐value
# pubs 0.242 < 2.2e-‐16
# cites 0.243 < 2.2e-‐16
h-‐index 0.228 < 2.2e-‐16
g-‐index 0.220 < 2.2e-‐16
# pubs 0.381 < 2.2e-‐16
# cites 0.377 < 2.2e-‐16
h-‐index 0.319 < 2.2e-‐16
g-‐index 0.305 < 2.2e-‐16
# pubs 0.335 0.001
# cites 0.315 0.003
h-‐index 0.344 0.001
g-‐index 0.325 0.002
# pubs 0.025 0.118
# cites 0.027 0.091
h-‐index 0.031 0.048
g-‐index 0.035 0.029
All Projects
Research Projects
Campus Champion
Projects
Startup Projects
6278
1677
86
3944
Table 1: Correlation between SUs allocated vs the impact metrics for each project
[image:5.612.317.556.516.652.2]corre-lation, if any. When categorizing the projects based on the types (research, startup, campus champion, etc.), it shows a slightly stronger correlation, although still not as strong in correlation to each category other than for the startup
projects/allocations. Figure 6 shows the analysis for
re-search projects only. Table 1 lists the correlation coefficient values as well as the p-values showing the significance of the test. Please note in Figure 5 and 6 we included a regression line showing the upper trends of the correlation, i.e., higher SUs allocation correlating to higher impact metrics, but not suggesting a linear relationship. This correlation analysis does not show causality especially since the funding and im-pact are expected to be related in a feedback loop.
5.3
Metrics vs SUs allocation on FOS level
● ●● ● ● ● ● ● ● ● ● ● ● ● ● ● ● ● ● ● ● ● ● ● ● ● ● ● ● ● ● ● ● ● ● ● ● ● ● ● ● ● ● ● ● ● ● ● ● ● ● ● ● ● ● ● ● ● ● ●● ● ● ● ● ● ● ● ● ● ● ● ● ● ● ● ● ● ● ● ● ● ● ● ● ● ● ● ● ● ● ● ● ● ● ● ● ● ● ● ● ● ● ● ● ● ● ● ● ● ● ● ● ● ● ● ● ● ● ● ● ● ● ● ● ● ● ● ● ● ● ● ● ●
1e+03 1e+05 1e+07
5 50 500 5000 50000 SUs allocation # pubs ● ● ● ● ● ● ● ● ● ● ● ● ● ● ● ● ● ● ● ● ● ● ● ● ● ● ● ● ● ● ● ● ● ● ● ● ● ● ● ● ● ● ● ● ● ●● ● ● ● ● ● ● ● ● ● ● ● ●● ● ● ● ● ● ● ● ● ● ● ● ● ● ● ● ● ● ● ● ● ● ● ● ● ● ● ● ● ● ● ● ● ● ● ● ● ● ● ● ● ● ● ● ● ● ● ● ● ● ● ● ● ● ● ● ● ● ● ● ● ● ● ● ● ● ● ● ● ● ● ● ● ●
1e+03 1e+05 1e+07
1e+02 1e+04 1e+06 SUs allocation # cites ● ●● ● ● ● ● ● ● ● ● ● ● ● ● ● ● ● ● ● ● ● ● ● ● ● ● ● ● ● ● ● ● ● ● ● ● ● ● ● ● ● ● ● ● ●● ● ● ● ● ● ● ● ● ● ● ● ●● ● ● ● ● ● ● ● ● ● ● ● ● ● ● ● ● ● ● ● ● ● ● ● ● ● ● ● ● ● ● ● ● ● ● ● ● ● ● ● ● ● ● ● ● ● ● ● ● ● ● ● ● ● ● ● ● ● ● ● ● ● ● ● ● ● ● ● ● ● ● ● ● ●
1e+03 1e+05 1e+07
5 10 20 50 200 SUs allocation h−inde x ● ● ● ● ● ● ● ● ● ● ● ● ● ● ● ● ● ● ● ● ● ● ● ● ● ● ● ● ● ● ● ● ● ● ● ● ● ● ● ● ● ● ● ● ● ●● ● ● ● ● ● ● ● ● ● ● ● ●● ● ● ● ● ● ● ● ● ● ● ● ● ● ● ● ● ● ● ● ● ● ● ● ● ● ● ● ● ● ● ● ● ● ● ● ● ● ● ● ● ● ● ● ● ● ● ● ● ● ● ● ● ● ● ● ● ● ● ● ● ● ● ● ● ● ● ● ● ● ● ● ● ●
1e+03 1e+05 1e+07
[image:6.612.316.544.77.288.2]10 20 50 100 500 SUs allocation g−inde x
Figure 7: Impact Metrics (number of publications, number of citations, h-index, g-index) vs SUs for FOS’s
While on an individual project level we do not observe strong correlations between impact metrics and the resource allocations, Figure 7 shows stronger positive correlation on the FOS level. The Pearson correlation coefficients (r) are 0.704, 0.712, 0.651, 0.648 respectively for the four impact metrics - number of publications, number of citations, h-index and g-h-index. With a degree of freedom at 132 and p-values less than 2.2e-16 from the test, it shows very high statistical significance.
However as Figure 8 suggests, the stronger correlations are mostly caused by the effect of different size of the FOS’s, judging by number of projects each FOS has. However, this does not diminish the conclusion of the analysis that shows how XSEDE impacts science from different disciplines, e.g., by approving more projects and granting more allocations for certain FOS’s.
Figure 9 shows the SUs allocated (transformed in logarith-mic scale) vs the h-index produced for each FOS, while the circle size is proportional to the size (number of projects) of the FOS. It also shows that after removing the fitted trend,
● ● ● ● ● ● ● ● ● ● ● ● ● ● ● ● ● ● ● ● ● ● ● ● ● ● ● ● ● ● ● ● ● ● ● ● ● ● ● ● ● ● ● ● ● ● ● ● ● ● ● ● ● ● ● ● ● ● ● ● ● ● ● ● ● ● ● ● ● ● ● ● ● ● ● ● ● ● ● ● ● ● ● ● ● ● ● ● ● ● ● ● ● ● ● ● ● ● ● ● ● ● ● ● ● ● ● ● ● ● ● ● ● ● ● ● ● ● ● ● ● ● ● ● ● ● ● ● ● ● ● ● ● ●
0.0 0.5 1.0 1.5 2.0 2.5
0
100
200
log10(# projects in FOS)
h−inde x ● ● ● ● ● ● ● ● ● ● ● ● ● ● ● ● ● ● ● ● ● ● ● ● ● ● ● ● ● ● ● ● ● ● ● ● ● ● ● ● ● ● ● ● ● ● ● ● ● ● ● ● ● ● ● ● ● ● ● ● ● ● ● ● ● ● ● ● ● ● ● ● ● ● ● ● ● ● ● ● ● ● ● ● ● ● ● ● ● ● ● ● ● ● ● ● ●● ● ● ● ● ● ● ● ● ● ● ● ● ● ● ● ● ● ● ● ● ● ● ● ● ● ● ● ● ● ● ● ● ● ● ● ●
0.0 0.5 1.0 1.5 2.0 2.5
3 4 5 6 7 8
log10(# projects in FOS)
log(alloc)
Figure 8: Effects of sizes of FOS’s
● ● ● ● ● ● ● ● ● ● ● ● ● ● ● ● ● ● ● ● ● ● ● ● ● ● ● ● ● ● ● ● ● ● ● ● ● ● ● ● ● ● ● ● ● ●● ● ● ● ● ● ● ● ● ● ● ● ● ● ● ● ● ● ● ● ● ● ● ● ● ● ● ● ● ● ● ● ● ● ● ● ● ● ● ● ● ● ● ● ● ● ● ● ● ● ● ● ● ● ● ● ● ● ● ● ● ● ● ● ● ● ● ● ● ● ● ● ● ● ● ● ● ● ● ● ● ● ● ● ● ● ● ●
0 50 100 150 200 250
3 4 5 6 7 8 h−index log10(SUs) ● ● ● ● ● ● ● ● ● ● ● ● ● ● ● ● ● ● ● ● ● ● ● ● ● ● ● ● ● ● ● ● ● ● ● ● ● ● ● ● ● ● ● ● ● ●● ● ● ● ● ● ● ● ● ● ● ● ● ● ● ● ● ● ● ● ● ● ● ● ● ● ● ● ● ● ● ● ● ● ● ● ● ● ● ● ● ● ● ● ● ● ● ● ● ● ● ● ● ● ● ● ● ● ● ● ● ● ● ● ● ● ● ● ● ● ● ● ●● ● ● ● ● ● ● ● ● ● ● ● ● ● ●
0 50 100 150 200 250
−2
−1
0
1
h−index
residule of log10(SUs) after remo
[image:6.612.54.286.233.453.2]ving fit
Figure 9: SUs vs h-index for each FOS with trend (above) and residual analysis (bottom)
we can see a divergence of the SUs received, from the ex-pected SUs trend to produce the given impact judging by h-index. This could imply that certain FOS’s are more effi-ciently (requiring less than expected resources) to produce a given impact while some others require more than expected SUs to produce the same impact. To further facilitate this analysis, we provided an interactive version of the plot in our web portal [27] and depict a screenshot in Figure 10.
[image:6.612.316.544.332.561.2]im-Figure 10: Interactive SUs vs h-index on FOS level showing in our development portal
● ●● ● ● ● ● ● ● ● ● ● ● ● ● ● ● ● ● ● ●● ● ● ● ● ● ●● ● ● ● ● ● ●● ● ● ● ● ● ● ● ● ● ●● ● ● ● ● ● ● ● ● ● ● ● ● ● ● ● ● ● ● ● ● ● ● ● ● ● ● ● ● ● ● ● ● ● ● ● ● ● ● ● ● ● ● ● ● ● ● ● ● ● ● ● ● ● ● ● ● ● ● ● ● ● ● ● ● ● ● ● ● ● ● ● ● ● ● ● ● ● ● ● ● ●● ● ● ● ● ●
3 4 5 6
0.5 1.0 1.5 2.0 2.5 3.0
Average (per project) npubs vs SUs for each FOS
log(avg of SUs per project)
log(a
vg of npubs per project)
● ●● ● ● ● ● ● ● ● ● ● ● ● ● ● ● ● ● ● ●● ● ● ● ● ● ●● ● ● ● ● ● ●● ● ● ● ● ● ● ● ●● ●● ● ● ● ● ● ● ● ● ● ● ● ● ● ● ● ● ● ● ● ● ● ● ● ● ● ●●● ● ● ● ● ● ● ● ● ● ● ● ● ● ● ● ● ● ● ● ● ● ● ● ●● ● ● ● ● ● ● ● ● ● ● ● ● ● ● ● ● ● ● ●● ● ● ● ● ● ● ● ● ● ● ● ● ● ●
3 4 5 6
0
1
2
3
4
Average (per project) ncites vs SUs for each FOS
log(avg of SUs per project)
log(a
vg of ncites per project)
● ●● ● ● ● ● ● ●●● ● ● ● ● ● ● ● ● ● ● ● ● ● ● ● ● ● ● ●● ● ● ● ● ● ● ● ● ● ● ● ● ● ● ●● ● ● ● ● ● ● ● ● ● ● ● ● ● ● ● ● ● ● ● ● ● ● ● ● ● ● ● ● ● ● ● ● ● ● ● ● ● ● ● ● ● ● ● ● ● ● ● ● ● ● ● ● ● ● ● ● ● ● ● ● ● ● ● ● ● ● ● ● ● ● ● ● ● ●● ● ● ● ● ● ● ●● ● ● ● ●
3 4 5 6
0 10 20 30 40 50
Average (by project) h−index vs SUs for each FOS
log(avg of SUs per project)
log(a
vg of h−inde
x b y project) ● ●● ● ● ● ● ● ●●● ● ● ● ● ● ● ● ● ● ● ● ● ● ● ●● ● ● ●● ● ● ● ● ● ● ● ● ● ● ● ● ● ● ●● ● ● ● ● ● ● ● ● ● ● ● ● ● ● ● ● ● ● ● ● ● ● ● ● ● ● ● ● ● ● ● ● ● ● ● ● ● ● ● ● ● ● ● ● ● ● ● ● ● ● ● ● ● ● ● ● ● ● ● ● ● ● ● ● ● ● ● ● ● ● ● ● ● ● ● ● ● ● ● ● ● ● ● ● ● ● ●
3 4 5 6
0
20
40
60
80
Average (per project) gindex vs SUs for each FOS
log(avg of SUs per project)
log(a
vg of ginde
[image:7.612.54.291.54.165.2]x per project)
Figure 11: Impact Metrics (number of publications, number of citations, h-index, g-index) vs SUs for FOS (avg by project)
Correlation with average
SUs allocation r (Pearson's) df p-‐value
# pubs 0.221 0.010
# cites 0.222 0.010 h-‐index -‐0.043 0.620 g-‐index -‐0.035 0.688 Average per
project for each FOS
132
Table 2: Correlation between average SUs allocated vs the average impact metrics (by projects) for each FOS
pact as well as the allocations (for h-index as in Figure 8). We can eliminate this effect by comparing the average val-ues within each FOS by dividing the number of projects, as shown in Figure 11, while Table 2 has the values. It shows the weak correlation of per project based metrics vs SUs for the number of publications and citations, which is ac-tually not significantly different than the result from Table 1. We didn’t observe any correlation between allocation and h-index or g-index. This is probably caused by the fact that
these two metrics do not work well when being averaged as they are not cumulative or additive values.
● ●●●● ●● ● ● ● ● ● ● ● ● ● ● ● ● ●●● ● ● ● ● ● ● ● ● ●● ● ● ● ● ● ● ● ● ● ● ● ●● ● ● ● ● ● ● ● ● ● ● ● ● ● ● ● ●● ● ● ● ● ● ● ● ● ● ● ● ● ● ● ● ● ● ● ● ● ● ● ● ● ● ● ● ● ● ● ● ● ● ● ● ● ● ● ● ● ● ● ● ● ● ● ● ● ● ● ● ● ●● ● ● ●●●
0 20 40 60 80 100 120
−1.0
−0.5
0.0
0.5
1.0
correlation of project npubs vs SUs within each fos
fos sorted by No. of projects in decreasing order
corr
.coef (npubs~SUs) n>=100<−−−− n>=50 <−−−− n>=10 <−−−− ● ●●● ● ●● ● ● ● ● ● ● ● ● ● ● ● ● ●● ● ● ● ● ● ● ● ● ● ●● ● ● ● ● ● ●● ● ● ● ● ● ● ● ● ●● ● ● ● ● ● ● ● ● ● ● ● ●● ● ● ● ● ● ● ● ● ● ● ●● ● ● ● ● ● ● ● ● ● ●● ● ● ● ● ● ● ● ● ● ● ● ● ● ● ● ● ● ● ● ● ● ● ● ● ● ● ● ● ● ●●● ● ● ●●●
0 20 40 60 80 100 120
−1.0
−0.5
0.0
0.5
1.0
correlation of project ncites vs SUs within each fos
fos sorted by No. of projects in decreasing order
corr
.coef (ncites~SUs) n>=100<−−−− n>=50 <−−−− n>=10 <−−−− ●● ●●● ● ● ● ● ● ● ●● ● ● ● ● ● ● ● ●● ● ● ● ● ● ● ● ● ● ● ● ● ● ● ● ● ● ● ● ● ● ● ● ● ● ● ● ● ● ●● ● ● ● ● ● ● ● ●● ● ● ● ● ● ● ● ● ● ● ●● ● ● ● ● ● ● ● ● ● ● ● ● ● ● ● ● ● ● ● ● ● ● ● ● ● ● ● ● ● ● ● ● ● ● ● ● ● ● ● ● ●●● ● ● ●●●
0 20 40 60 80 100 120
−1.0
−0.5
0.0
0.5
1.0
correlation of project h−index vs SUs within each fos
fos sorted by No. of projects in decreasing order
corr .coef (h−inde x~SUs) n>=100 <−−−− n>=50 <−−−− n>=10 <−−−− ●● ●●● ●● ● ● ● ● ●● ● ● ● ● ● ● ● ●● ● ● ● ● ● ● ● ● ● ● ● ● ● ● ● ●● ● ● ● ● ● ● ● ● ● ● ● ● ●●● ● ● ● ● ● ● ●● ● ● ● ● ● ● ● ● ● ● ● ● ● ● ● ● ● ● ● ● ● ● ● ● ● ● ● ● ● ● ● ● ● ● ● ● ● ● ● ● ● ● ● ● ● ● ● ● ● ● ● ● ●●● ● ● ●●●
0 20 40 60 80 100 120
−1.0
−0.5
0.0
0.5
1.0
correlation of project g−index vs SUs within each fos
fos sorted by No. of projects in decreasing order
[image:7.612.316.552.92.321.2]corr .coef (g−inde x~SUs) n>=100 <−−−− n>=50 <−−−− n>=10 <−−−−
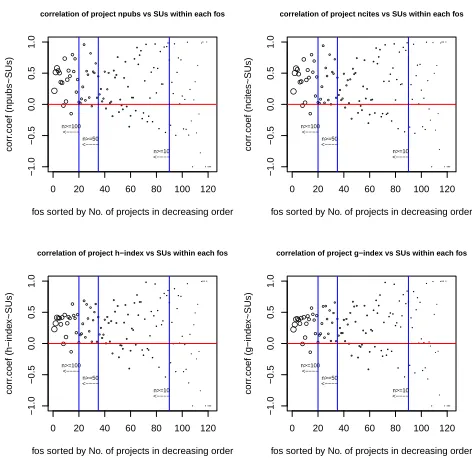
Figure 12: Correlation coefficient (r) of impact met-rics vs SUs on project level for each FOS
[image:7.612.53.285.217.445.2]nprojs<10 r −1 −0.6 −0.2 0 0.2 0.4 0.6 0.8 1 10<=nprojs<50 r −1 −0.6 −0.2 0 0.2 0.4 0.6 0.8 1 50<=nprojs<100 r −1 −0.6 −0.2 0 0.2 0.4 0.6 0.8 1 nprojs>=100 r −1 −0.6 −0.2 0 0.2 0.4 0.6 0.8 1
Figure 13: Distribution of r grouped by size of FOS
[image:7.612.317.551.396.516.2] [image:7.612.54.294.508.563.2]correlation appears much stronger, and in which others they are weak. This could be potentially used during resource al-location to help determine to support which projects when resources are limited but demands are high.
5.4
Scientific Impact Produced per SU
Allo-cation Unit
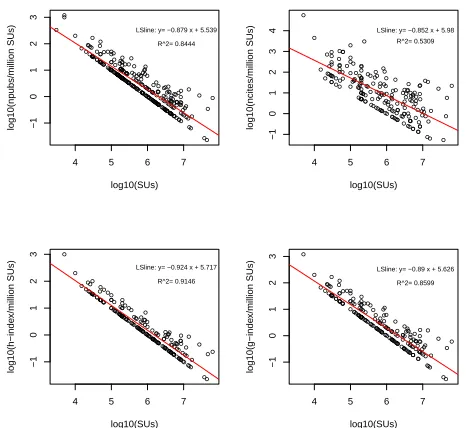
● ● ● ●● ● ● ● ● ● ● ● ● ● ● ● ● ● ● ● ● ● ● ● ● ● ● ● ● ● ● ● ● ● ● ● ● ● ● ● ● ● ● ● ● ● ● ● ● ● ● ● ● ● ● ● ●● ● ●● ● ● ● ● ● ● ●● ● ● ● ● ● ● ● ● ● ● ● ● ● ● ● ● ● ● ● ●● ● ● ● ● ● ● ● ● ● ● ● ● ● ● ● ● ● ● ● ● ● ● ● ● ● ● ● ● ● ● ● ● ● ● ● ● ● ● ● ● ● ● ● ● ● ● ● ● ● ● ● ● ● ● ● ● ● ● ● ● ● ● ● ● ● ● ●● ● ● ● ● ● ● ● ● ● ● ● ● ●● ● ● ● ● ● ● ● ● ● ● ● ● ● ● ● ● ● ● ● ● ● ● ● ● ● ● ● ● ● ● ● ● ● ● ● ● ● ● ●● ● ● ●● ● ● ● ● ● ● ● ● ● ● ● ● ● ● ● ● ● ● ● ● ● ● ● ● ● ● ● ● ● ● ● ● ● ● ● ● ● ● ● ● ● ● ● ● ● ● ● ● ● ● ● ● ● ● ● ● ● ● ● ● ● ● ● ● ● ● ● ● ● ● ● ● ● ● ● ● ● ● ● ● ● ● ● ●4 5 6 7
−1 0 1 2 3 log10(SUs) log10(npubs/million SUs)
LSline: y= −0.879 x + 5.539 R^2= 0.8444 ● ● ● ● ● ● ● ● ● ● ● ● ● ● ● ● ● ● ● ● ● ● ● ● ● ● ● ● ● ● ● ● ● ● ● ● ● ● ● ● ● ●● ● ● ● ● ● ● ● ● ● ● ● ● ● ● ● ● ● ● ● ● ● ● ● ● ● ● ● ● ● ● ● ● ● ● ● ● ● ● ● ● ● ● ●● ● ● ● ● ● ● ● ● ● ● ● ● ● ● ● ● ● ●● ● ● ● ● ● ● ● ● ● ● ● ● ● ● ● ● ● ● ● ● ● ● ● ● ● ● ● ● ● ● ● ● ● ● ● ● ● ● ● ● ● ● ● ● ● ● ● ● ● ● ● ●● ● ● ● ● ● ● ● ● ● ● ● ● ● ● ● ● ● ● ● ● ● ● ● ● ● ● ● ● ● ● ● ● ● ● ●
4 5 6 7
−1 0 1 2 3 4 log10(SUs) log10(ncites/million SUs)
LSline: y= −0.852 x + 5.98 R^2= 0.5309 ● ● ● ● ● ● ● ● ● ● ● ● ● ● ● ● ● ● ● ● ● ● ● ● ● ● ● ● ● ● ● ● ● ● ● ● ● ● ● ● ● ●● ● ● ● ● ● ● ● ● ● ● ● ● ● ● ● ● ●● ● ● ● ● ● ● ● ● ● ● ● ● ● ● ● ● ● ● ● ● ● ● ● ● ● ● ● ● ● ● ● ● ● ● ● ● ● ●● ● ● ● ● ● ● ● ● ● ● ● ● ● ● ● ● ● ● ● ● ● ● ● ● ● ● ● ●● ●● ● ● ● ● ● ●● ● ● ● ● ● ● ● ● ● ● ● ● ● ● ● ● ● ● ● ●● ● ● ● ● ● ● ● ● ● ● ● ● ● ●● ● ● ● ● ● ● ● ● ● ● ● ● ● ● ● ● ● ● ● ●
4 5 6 7
−1 0 1 2 3 log10(SUs) log10(h−inde x/million SUs)
LSline: y= −0.924 x + 5.717 R^2= 0.9146 ● ● ● ● ● ● ● ● ● ● ● ● ● ● ● ● ● ● ● ● ● ● ● ● ● ● ● ● ● ● ● ● ● ● ● ● ● ● ● ● ● ●● ● ● ● ● ● ● ● ● ● ● ● ● ● ● ● ● ● ● ● ● ● ● ● ● ● ● ● ● ● ● ● ● ● ● ● ● ● ● ● ● ● ● ●● ● ● ● ● ● ● ● ● ● ● ● ●● ● ● ● ● ● ● ● ● ● ● ● ● ● ● ● ● ● ● ● ● ● ● ● ● ● ● ● ●● ●● ● ● ● ● ● ● ● ● ● ● ● ● ● ● ● ● ● ● ● ● ● ● ● ● ● ● ●● ● ● ● ● ● ● ● ● ● ● ● ● ● ● ● ● ● ● ● ● ● ● ● ● ● ● ● ● ● ● ● ● ● ● ●
4 5 6 7
−1 0 1 2 3 log10(SUs) log10(g−inde x/million SUs)
[image:8.612.52.285.160.374.2]LSline: y= −0.89 x + 5.626 R^2= 0.8599
Figure 14: Four different measures of scientific im-pact per SU allocated. Note that the Y-axis gives scientific impact scaled by SU allocation. Therefore these plots indicate that as the allocation size grows there is a diminishing scientific impact per SU allo-cated
The publications database acquired from the NSF awards database includes all publications from XSEDE users rather than just those relevant to XSEDE. As such, these pub-lications present only an indirect measure of the scientific impact of XSEDE diluted by the presence of many publica-tions that are not related to the XSEDE resources. A more ideal, and direct measurement of XSEDE’s scientific impact is obtained from the user curated publication database. We have shown in the previous section that these scientific im-pact metrics can be used to measure the scientific imim-pact of XSEDE in general, as well as comparing individual users, projects, and FOS with their peers. As these metrics are obtained from the publications that are tagged as results from an XSEDE project, we also can do an analysis of the scientific impact produced per SU allocation unit.
We have calculated the scientific impact for those involved projects (302 out of more than 6,000 in total) based on the direct metrics obtained earlier and SUs allocated to them (in million SUs). Figure 14 shows a series of four log-log plots in which four different scientific impact metrics for each project are scaled by the SU allocation then plotted against total allocation. Previously we have demonstrated the posi-tive correlation of scientific impact metrics and the resource allocation of projects within each FOS. Figure 14 suggests
that based on these metrics of scientific impact, that is num-ber of papers, citations, h-index, and g-index scaled by SU’s, sponsoring a larger number of smaller scale projects could actually produce a higher scientific impact than a smaller number of very large projects. In other words, we cannot expect a project that received double the amount of SUs of what another project did to produce double the impact, as measured by number of publications, citation counts, h-index, and g-index.
Unfortunately, to date, the number of user curated pub-lications is a very small sample of the total output of the complete XSEDE user community. With more such data available in the future, we anticipate that we will be able to do a much more comprehensive analysis of the scientific im-pact of XSEDE and demonstrate the relationship between XSEDE funded allocations and a variety of scientific impact metrics.
6.
ONGOING AND FUTURE WORK
This paper does not yet address the name ambiguity is-sue, which deserves dedicated research and in fact extensive research has been carried out on this issue. The root cause of this issue is that the metadata of the publications ply does not include enough information to distinguish sim-ilar names that can be uniquely associated to XSEDE user names. This is not a problem specific to our study but for the automated bibliometrics analysis in general, e.g., Google Scholar also include false positive publications in user profile but leave it to the user to curate the results to make it more accurate. In the future we will try to tackle the problem based on other available data - field of science, organization, funding data, co-author relationship etc. while conducting unsupervised machine learning techniques like k-means clus-tering as well as the introduction of a social network graph that analyses the authorship for ambiguity and identifies a likelihood.
As the ultimate approach is to let users curate their pub-lication list, we would try to include such assisting processes into the workflow of vetting the papers. One pathway we are currently pursuing is to work with the XSEDE portal team while providing the publication data we have collected as a suggestion service, in the hope to provide more convenient way for users to quickly populate the vetted publications library.
We have also started another similar activity, in which we are attemping to extract and parse the publication data from past TeraGrid/XSEDE quarterly reports. This data, while not curated on per user basis, do have project level association information and thus could serve quite well for most of our analyses.
As for the resource allocation, we currently only consid-ered the SUs, or cpu-hours, as this is the dominant factor thus far to measure resource allocation in XSEDE. With the increasingly importance and bigger needs of storage alloca-tions from big-data applicaalloca-tions, and Virtual Machine (VM) based allocations for those interested into cloud computing, we will need to put these also into the equation to cover more forms of resources in addition to SUs.
the publication-based scientific impact studies.
7.
CONCLUSION
This paper presented a framework to facilitate the mea-suring of scientific impact and evaluation of ROI for large computing facilities. We have used this framework to con-duct an evaluation of scientific impact of XSEDE by deriving various metrics and carrying out extensive statistical analy-ses. The major accomplishments include:
1. We have devised a process to obtain and manage pub-lication and citation data from various sources for a given group of people. We have followed this work-flow to obtain over 142,000 publications as well as the citation count data for over 20,000 XSEDE users.
2. Based on the consolidated relevant bibliometrics data various scientific impact metrics are derived for users and other aggregated levels such as projects and field of science.
3. The results are presented via a lightweight portal, and are also exposed via database integration or RESTful services to other portals, including the XDMoD por-tal and the XSEDE porpor-tal. For example, we expose the publication data via RESTful service API to the XSEDE portal team as a publication suggestion
ser-vice. This will help facilitate the identification and
curation of XSEDE enabled publications by XSEDE users.
4. Statistical analyses were carried out correlating the im-pact metrics with projects/proposals, field of science, and allocation data to help provide metrics that can be used to quantify the impact of XSEDE resources on scientific research. These analyses do show a pos-itive correlation between XSEDE funded allocations and various scientific impact metrics. With the new modifications to POPS, the allocation process and the XSEDE User Portal a much larger, more representa-tive number of such user curated publications will be-come available and analyses of this larger database of publications directly related to XSEDE will provide much more insight into the scientific impact of the XSEDE program.
5. We have conducted preliminary analyses on scientific impact produced per SU allocation unit based on user curated publication data with a limited sample size. This may provide a way to measure the ROI of XSEDE. We will conduct similar analyses when having more user curated publications to further solidify the results.
It is obvious that continious work is important to conduct longitudinal tracking of the data and deal with the issues that XSEDE has so far provided limited amount of data that will however improve over time. Important is to note that this work has pioneered the workflow and the analysis capability on how to achieve the data gathering and can be integrated with various groups offering different services as part of XSEDE including XSEDE portal and auditing teams. Moreover, this faremwork and its service oriented model makes it possible to expand its usage beyond those targeting XSEDE resources, and could be employed within other organizations such as Department of Energy (DOE) or
even a department of a university. Those that like to consult with us on such specializations, can contuct use for further deatils.
Acknowledgement
This work is part of the Technology Auditing Service (TAS) project sponsored by NSF under grant number OCI 1025159. Lessons learned from FutureGrid have significantly influ-enced this work. We like to thank Barbara O’Leary for her help in reviewing this paper.
8.
REFERENCES
[1] “XSEDE,” Web Page. [Online]. Available: https://www.xsede.org/
[2] P. Thomas and D. Watkins, “Institutional research rankings via bibliometric analysis and direct peer review: A comparative case study with policy
implications,”Scientometrics, vol. 41, no. 3, pp.
335–355, 1998.
[3] J. Bollen, M. A. Rodriguez, and H. Van de Sompel, “MESUR: Usage-based Metrics of Scholarly Impact,”
inProceedings of the 7th ACM/IEEE-CS Joint
Conference on Digital Libraries, ser. JCDL ’07. New
York, NY, USA: ACM, 2007, pp. 474–474. [Online]. Available:
http://doi.acm.org/10.1145/1255175.1255273 [4] J. Bollen, H. Van de Sompel, and M. A. Rodriguez,
“Towards Usage-based Impact Metrics: First Results
from the Mesur Project.” inProceedings of the 8th
ACM/IEEE-CS Joint Conference on Digital Libraries,
ser. JCDL ’08. New York, NY, USA: ACM, 2008, pp.
231–240. [Online]. Available:
http://doi.acm.org/10.1145/1378889.1378928 [5] J. Bollen, H. Van de Sompel, A. Hagberg, and
R. Chute, “A principal component analysis of 39
scientific impact measures,”PloS one, vol. 4, no. 6, p.
e6022, 2009.
[6] “nanoHUB.org - Citations,” Web Page. [Online]. Available: https://nanohub.org/citations
[7] J. E. Hirsch, “An index to quantify an individual’s
scientific research output,”Proceedings of the National
academy of Sciences of the United States of America,
vol. 102, no. 46, pp. 16 569–16 572, 2005. [8] L. Egghe, “Theory and practise of the g-index,”
Scientometrics, vol. 69, no. 1, pp. 131–152, 2006.
[9] J. Kaur, D. T. Hoang, X. Sun, L. Possamai, M. JafariAsbagh, S. Patil, and F. Menczer, “Scholarometer: A social framework for analyzing
impact across disciplines,”PloS one, vol. 7, no. 9, p.
e43235, 2012.
[10] “Publish or Perish,” Web Page. [Online]. Available: http://www.harzing.com/pop.htm
[11] J. Bollen, G. Fox, and P. R. Singhal, “How and where the TeraGrid supercomputing infrastructure benefits
science,”Journal of Informetrics, vol. 5, no. 1, pp.
114–121, 2011.
[12] “altmetrics,” Web Page. [Online]. Available: http://altmetrics.org/manifesto/
A. Zimmerman, “Performance metrics and auditing framework using application kernels for
high-performance computer systems,”Concurrency
and Computation: Practice and Experience, vol. 25,
no. 7, pp. 918–931, 2013. [Online]. Available: http://dx.doi.org/10.1002/cpe.2871
[14] J. C. Browne, R. L. DeLeon, C.-D. Lu, M. D. Jones, S. M. Gallo, A. Ghadersohi, A. K. Patra, W. L. Barth, J. Hammond, T. R. Furlani, and R. T. McLay, “Enabling comprehensive data-driven system
management for large computational facilities,” in
Proceedings of SC13: International Conference for High Performance Computing, Networking, Storage
and Analysis, ser. SC ’13. New York, NY, USA:
ACM, 2013, pp. 86:1–86:11. [Online]. Available: http://doi.acm.org/10.1145/2503210.2503230 [15] J. C. Browne, R. L. DeLeon, A. K. Patra, W. L.
Barth, J. Hammond, M. D. Jones, T. R. Furlani, B. I.
Schneider, S. M. Gallo, A. Ghadersohiet al.,
“Comprehensive, open-source resource usage measurement and analysis for hpc systems,”
Concurrency and Computation: Practice and
Experience, 2014.
[16] T. R. Furlani, B. L. Schneider, M. D. Jones, J. Towns, D. L. Hart, S. M. Gallo, R. L. DeLeon, C.-D. Lu, A. Ghadersohi, R. J. Gentner, A. K. Patra, G. von Laszewski, F. Wang, J. T. Palmer, and N. Simakov, “Using xdmod to facilitate xsede operations, planning
and analysis,” inProceedings of the Conference on
Extreme Science and Engineering Discovery
Environment: Gateway to Discovery, ser. XSEDE ’13.
New York, NY, USA: ACM, 2013, pp. 46:1–46:8. [Online]. Available:
http://doi.acm.org/10.1145/2484762.2484763 [17] C.-D. Lu, J. Browne, R. L. DeLeon, J. Hammond,
W. Barth, T. R. Furlani, S. M. Gallo, M. D. Jones, and A. K. Patra, “Comprehensive job level resource usage measurement and analysis for xsede hpc
systems,” inProceedings of the Conference on Extreme
Science and Engineering Discovery Environment:
Gateway to Discovery, ser. XSEDE ’13. New York,
NY, USA: ACM, 2013, pp. 50:1–50:8. [Online]. Available:
http://doi.acm.org/10.1145/2484762.2484781 [18] “ISI Web of Science,” Web Page. [Online]. Available:
http://wokinfo.com/
[19] “Google Scholar,” Web Page. [Online]. Available: http://scholar.google.com/
[20] “Microsoft Academic Search,” Web Page. [Online]. Available: http://academic.research.microsoft.com/ [21] “Mendeley,” Web Page. [Online]. Available:
http://www.mendeley.com/
[22] “Drupal Bibliography Module,” Web Page. [Online]. Available: https://drupal.org/project/biblio [23] “FutureGrid Biblio,” Web Page. [Online]. Available:
https://portal.futuregrid.org/biblio
[24] “XSEDE User Portal|Publications,” Web Page.
[Online]. Available:
https://portal.xsede.org/publications
[25] K. Yang and L. I. Meho, “Citation analysis: a comparison of Google Scholar, Scopus, and Web of
Science,”Proceedings of the American Society for
Information Science and Technology, vol. 43, no. 1,
pp. 1–15, 2006.
[26] “i-10 index|google scholar citations open to all.”
[Online]. Available:
http://googlescholar.blogspot.com/2011/11/ google-scholar-citations-open-to-all.html
[27] “Tas scientific impact metrics and analysis dev/testing portal.” [Online]. Available: