Rochester Institute of Technology
RIT Scholar Works
Theses
Thesis/Dissertation Collections
1997
Colorimetric characterization of flexographic
process utilizing analytical models
Arturo Aguirre
Follow this and additional works at:
http://scholarworks.rit.edu/theses
This Thesis is brought to you for free and open access by the Thesis/Dissertation Collections at RIT Scholar Works. It has been accepted for inclusion
in Theses by an authorized administrator of RIT Scholar Works. For more information, please contact
ritscholarworks@rit.edu
.
Recommended Citation
Colorimetric Characterization of Flexographic Process
utilizing Analytical Models
Arturo Aguirre
B.Sc. Chemical Engineering
Colorimetric Characterization of Flexographic Process
utilizing Analytical Models
Arturo Aguirre
B.Sc. Chemical Engineering,
Institute of Technology and Superior Studies of Monterrey, Mexico (1997)
A thesis submitted in partial fulfillment of the
requirements for the degree of
Master in Science in Color Science
in the Center ofImaging Science
Rochester Institute of Technology
September 2002
Signature of the Author
Accepted by
CENTER FOR IMAGING SCIENCE
ROCHESTER INSTITUTE OF TECHNOLOGY
ROCHESTER, NEW YORK
CERTIFICATE OF APPROVAL
M.S. DEGREE THESIS
The M.S. Degree Thesis of Arturo Aguirre
has been examined and approved
by two members of the color science faculty
and one member of the school of printing
as satisfactory for the thesis requirement for the
Master of Science degree
Prof. J.A.S. Viggiano, Thesis Advisor
THESIS RELEASE PERMISSION FORM
Rochester Institute of Technology
Center For Imaging Science
Title of Thesis
Colorimetric Characterization of Flexographic Process utilizing Analytical Models
I,
Arturo Aguirre, hereby grant permission to the Wallace Memorial Library ofR.I.T. to
reproduce my thesis in whole or part. Any reproduction will not be for commercial use or
profit.
Signature of the Author
ACKNOWLEDGEMENTS
"Always
giving
thanks
to
God the Father
for
everything,
in
the
nameof
ourLord Jesus Christ.
"Ephesians 5:20
I'd like
to thank
first
ofallmy
Lord
andSavior Jesus
Christ
to
whomis
the
glory forever
and ever.
My
family
whoalways supportedmein every decision I've
madein
wisdomandunderstanding.
My
beloved
fiance,
Veronica,
for her
love
and patienceto
overcome ourseparation.My
relatives and closestfriends
in Mexico
and alsomy
christianfamily
from Anchor
Christian Church
andBASIC for
their
love
and support.CYDSA
andCONACYT,
specially Raul
Arambula,
Dr. Federico
Rodriguez,
Jaime
Parada,
Enrique
Hernandez,
andJoel
Gutierrez
for giving
methe
opportunity
andfinancial
supportto
enrollin
this
program.Dr.
Roy
Berns,
Dr. Mark
Fairchild,
andDr. Ethan
Montag
from
the
Color Science
department for
their
wisdomandteachings.
Prof.
J.A.S.
Viggiano,
Prof.
Barry
Lee,
andDave Dembroski from
the
School
ofPrinting
for
helping
mein
the
experiment andthe
development
ofmy
thesis.
And
to
everybody
whoneedsto
be
here
anddeserves
recognition.Table
of
Contents
Table
of
Contents
i
Table
of
Tables
in
Table
of
Figures
iv
Table
of
Equations
vi
Chapter
1: Introduction
1
Chapter
2: Statement
of the
Problem
and
Hypotheses
4
Chapter
3: Flexographic Process
7
3.1
What
is
Flexography?
7
3.2
Process Description
8
3.3
Printing Variables
11
3.4
Simplification
of the
Process
15
Chapter 4: Press Run
17
Chapter 5: Dot-Gain Models
22
5.1
Dot
Gain
22
5.2
Murray-Davies
vs.
Yule-Nielsen Modified Dot Area
Calculation
23
5.3
Dot-Gain Models
25
5.3.1
FOGRA Model
25
5.3.2
GRL Model
27
5.4
Proposed Model
29
Chapter 6: Color-Mixing Models
32
6.1
Color-Mixing Models
32
6.2
Description
of the
Models
33
6.2.1
Murray-Davies Model
34
6.2.2
Neugebauer
Equations
35
6.3
Variants
of the
Neugebauer
Equations
37
6.3.1
Broadband Neugebauer
andYule-Nielsen
Modification
38
6.3.2
VHM-1
orSpectral
Yule-Nielsen
modifiedNeugebauer
39
6.3.3
Cellular Neugebauer
40
6.3
.4Other Variations
42
6.4
Discussion
and selection of color-mixing models
43
Chapter
7:
Methodology
and
Calculations
45
7.1
Target Images
45
7.2
Utilization
of
Dot-Gain
and
Color-Mixing Models
49
7.2.1
Estimation
ofParameters
ofDot-Gain Mode
Is
50
7.2.1.1
FOGRA Model
50
7.2.1.2
GRL Model
52
7.2.1.3
Fitting
Equation
53
7.2.2
Estimation
of parameters ofColor-Mixing
models54
7.2.2.1
Murray-Davies Model
54
7.2.2.2 Yule-Nielsen Model
55
7.2.2.3 VMH-1 (Spectral Yule-Nielsen Modified
Neugebauer
Model
55
7.3
Additional Consideration
56
Chapter 8: Results
andDiscussion
57
8.1
Selection
of
Characterization
andEvaluation
Targets
57
8.2
Variation Between Samples
61
8.3
Analysis
of
Dot
Gain
in
Theoretical
Dot
Areas
above90%
63
8.4
Dot
Gain Analysis
69
8.4.1
FOGRA
model70
8.4.2
GRL
model74
8.4.3
Fitting
Equation
78
8.4.4
Comparison Between Statistical
andDensitometric Dot Gain
81
8.4.5
Comparison Between
the
Models
andStatistical Dot Gain
83
8.4.6
GRL
based
onstatistical effectiveareas85
8.4.7
Discussion
aboutDot-Gain Models
87
8.5
Color-mixing
analysis89
8.5.1
Murray-Davies
model90
8.5.2
Yule-Nielsen Model
98
8.5.3
Comparison Between Murray-Davies
andYule-Nielsen Modified Models
1 04
8.5.4
VHM-1 (Spectral Yule-Nielsen Modified Neugebauer
)
106
8.6
Analysis
on the
Performance
of
Dot-Gain
andColor-Mixing Models
123
8.7
Performance
of the
Models
for the
Evaluation Target
127
8.8
Summary
of the
Performance
of the
Models
131
8.9
Source
of
Variations
of
Flexographic Process
132
Chapter 9: Conclusions
and
Further Research
134
9.1
Conclusions
134
9.2
Future Research
140
Table
of
Tables
Table
4.1: Image
andFilm-Making Specifications
17
Table 4.2: Optimized Plate-Making Specifications
19
Table 4.3: Press
Run
Specifications
20
Table
8.
^Evaluation
of differentpairsof samples based on densities58
Table 8.2: Color
difference between therampsof char-4 and eval-3 inAE*ab
60
Table 8.3
:Color
difference between the ramps of char-7 and eval-7 inAE*^
61
Table
8.4:
Color
difference values between the reference prints and all the others62
Table
8.5: Principal
Status
T
densities of theCMYK
ramps on the characterization target69
Table 8.6:
Transformation
of densities toERA
's
based onMurray-Davies equation
70
Table 8.7: Estimated
A50%
for each color and their correspondingR272
Table 8. 8: Dot
areas withYule-Nielsen
modified and n=1.375
Table 8.9: Estimation
ofAd
andAp
forGRL
model76
Table 8. 10: Estimated
parameters for theFitting
equation79
Table 8.1 1
:Estimated
parameters for theGRL
utilizingstatistical dot gain data85
Table
8.12:
Average,
maximum,
and minimum color difference forFOGRA
model90
Table 8. 13:
Average,
maximum,
andminimum color difference forGRL
model92
Table 8.
14:
Average,
maximum,
andminimum color difference forFitting
equation93
Table
8.
15:
Average,
maximum,
and minimum color differencestatistically95
Table 8.16:
Summarized
overall color differences for all models95
Table 8.17:
Average,
maximum,
and minimum color difference statistically estimated98
Table 8. 18:
Average,
maximum,
andminimum color difference forFOGRA
model99
Table
8.19:
Average,
maximum,
andminimum color difference forGRL
model100
Table 8.20:
Average,
maximum,
andminimum color difference forFitting
equation102
Table 8.21:
Summarized
overall color differences for all models104
Table 8.22: Average
color differences usingFOGRA
model for two-color overprints107
Table
8.23:
Average
color differences usingFOGRA
model forthree-andfour-color overprints. ..107Table 8.24: Average
color differencesusingGRL
modelfor two-color overprints110
Table
8.25:
Average
color differences usingGRL
model forthree-and four-color overprintsIll
Table 8.26: Average
color differences usingFitting Eq.
model for two-color overprints115
Table
8.27:
Average
color differences usingFitting Eq.
forthree-and four-color overprints115
Table 8.28: Average
color differencesusingStatistical
approachfor two-color overprints119
Table 8.29: Average
color differencesusingStatistical
approachforthree-andfour-coloroverprints
119
Table 8.30: Performance
of the model for theCMYK
ramps of evaluation target127
Table 8.3 1
:Average
color differences of the evaluation target based on each dot-gain model128
Table 8.32: Summary
of the results131
Table
of
Figures
[image:10.540.57.502.119.666.2]Figure 3.1: Main
steps in theflexographicprocess8
Figure 3.2: Printing
configurationfor a flexographic press using doctor blade or two rolls.Left:
Enclosed
chamber.Right: Two-roller
system10
Figure 3.3: Dot
gainversusfilm dot area for a flexographic press12
Figure 3.4: Simplification
of the process used in this research16
Figure
5.1:
Standard
shape of dot gain curve from theFOGRA
modelvARYnsfGAa50%
(from Reference
17)
26
Figure 5.2: Standard
shape of dot gain curve from theGRL
model varyingAa50%^ou Reference 7).
.28
Figures
5.3
and5.4: Dot
gaincurve separated by the dotareawith largest dot gaem29
Figures 5.5
and5.6:
Goodness
of fit using equation5.6
for the dot gain curve30
Figure
7.1
Characterization
Target
47
Figure
7.2:
Evaluation
Target
48
Figure 7.3: Dataflow
of dot-gain and color-mixing models49
Figure8.1: Spectral
reflectance factors for100%
patches of char-sample#4
and eval-sample#3
59
Figure 8.2:
AE*94
versus n value between1
and20
65
Figure 8.3:
AE*94
versusn-value between1
and2
66
Figures 8.4
and8.5: Spectral Reflectance
curves of cyan and magenta withn=1.3
66
Figures 8.6
and8.7: Spectral
Reflectance
curvesof yellow and black withn=1.3
67
Figure
8.8: Optimized
spectral lvalues statistically estimated68
Figure 8.9: Dot
change usestgMurray-Davies
equation71
Figures 8. 10-8. 13: FOGRA
predictionsof effecttve areas73
Figure 8.
14:
Delta ERA
curves fromFOGRA
model74
Figure 8. 15: Dot
gain withYule-Nielsen
modified equation andn=1.3
75
Figures 8.
16-8.
19:
GRL
model predictions of effective areas77
Figure
8.20:
Dot
gain curves fromGRL
model78
Figures 8.21-8.24: Fitting
equation predictions of effective areas80
Figure 8.25: Dot
gain curves forCMYK
colorsbased on theFitting
equation81
Figures 8.26-8.29: Statistical
anddensitometricdot gain curves ofCMYK
withn=1.3
82
Figures 8.30-8.33: Dot
gain curves of the four models84
Figures 8.34-8.37:
GRL
andGRL-Stat
dot gain curves86
Figure 8.38: Different
combinationsevaluated emthis research89
Figures 8.42-8.44: CIELAB
plots ofGRL
predictions93
Figures 8.45-8.47: CIELAB
plots ofFitting
equationpredictions94
Figures 8.48-8.51: Predicted
andmeasuredspectralreflectancecurves withMurray-Davies
model..97
Figures 8.52-8.54: CIELAB
plotsforFOGRA
predictions100
Figures 8.55-8.57: CIELAB
plots forGRL
predictions101
Figures 8.58-8.60: CIELAB
plots forFitting
equationpredictions103
Figure 8.62: Histogram
ofAE*94
yielded byFOGRA
model107
Figures
8.63-8.65:
CIELAB
plots yielded byFOGRA
for two-color overprint108
Figures 8.66-8.68: CIELAB
plots yielded byFOGRA
forthree-andfour-coloroverprint110
Figure 8.69:
Histogram
ofAE*94
yielded byGRL
model1 1 1
Figures 8.70-8.72: CIELAB
plotsyielded byGRL
for two-color overprint113
Figures
8.73-8.75: CIELAB
plots yielded byGRL
forthree-andfour-color overprint114
Figure
8.76:
Histogram
ofAE*94
yielded byFitting
equation1
16
Figures 8.77-8.79:
CIELAB
plots yielded byFitting
Eq.
fortwo-color overppjnt117
Figures 8.80-8.82:
CIELAB
plots yielded byFitting Eq.
forthree-and four-color overprint118
Figure
8.83:
Histogram
ofAE*94
yielded by statistical approach120
Figures 8. 84-8. 87: Dot
GAnv curves estimated for two-color overprints124
Figures 8.88-8.91
:Histograms
ofAE*94
for all models using the evaluation target129
Table
of
Equations
Equation
5.1:
Definition
of dot gain22
Equation
5.2:
Murray-Davies
dot areaequation23
Equation
5.3:
Yule-Nielsen
modification24
Equation 5.4:
FOGRA
dotgain model25
Equation 5.5: GRL
model27
Equation 5.6:
Dot
gainmodelsimilar toCRT
characterization30
Equation
6.1:
Murray-Davies
model34
Equation
6.2:
Yule-Nielsen
modificationto theMurray-Davies
equation34
Equation 6.3:
Neugebauer
basic equations36
Equation
6.4: Demichel
equations for4
colorants36
Equation 6.5: Yule-Nielsen
modifiedNeugebauer
equations38
Equation
6.6:
Spectral
Neugebauer
39
Equation 6.7: VHM-1
40
Equation
6.8:
Cellular
Neugebauer
equations41
Equation
6.9:
Spectral Neugebauer
with wavelength-dependent dot areas42
Equation 6.
10: Determenjation
of wavelength-dependent dot areas42
Equation 6.11: Neugebauer
equation with wavelength-dependentatfactor43
Equation
7.1: Murray-Davies
equation to calculateERA's
includemg the effect of paper51
Equation 7.2: Transfer
model fromfilm to plate52
Equation 7.3: Transfer
model from plate to PRnvT52
Equation 7.4: Addition
of dot GAnv to the theoretical dot areas53
Equation
8.1:
Difference
metric to evaluate pair of samples60
Chapter
1
:
Introduction
Colorimetric
characterizationis
anecessary
partin
the
setting up
ofany
color managementsystems
for
consistent color-datatransfer.
Characterization
allowsthe
prediction or simulation ofthe
colorimetric performance of adevice
by
way
of an spectrum oftechniques,
such asmathematical models or
look-up
tables.
The
utilization of analytical models such asMurray-Davies
andthe
Neugebauer
equationsto
representthe
colorimetricbehavior
ofprinting
devices
has
the
advantage ofrequiring less
input data
and abetter
understanding
ofthe
physicallimitations
ofthe
system.These
techniques
have
been
well-usedfor
desktop
printers.However,
there
are othertypes
ofdevices
whichare usedto
printondifferent
substratesthan
paper andin
muchlarger
quantities.The
principlesbehind
these
processes also usehalftone
printing
to
yield multicolorimages,
thus
enabling
them to
utilizeanalytical models.Flexography
is
one ofthese
large-production printing
processes andit
is
subjectto
different
variables
that
drastically
affectits
colorimetric performance.One
ofthese
variablesis dot
gain,
which
has
the
effect ofincreasing
density,
particularly in
the
highlight
region, causing
image
quality
limitations
andincreasing
variability
from
runto
runand pressto
press.This
causesthe
process
to
be less
predictive comparedto
other processes wherethe
dot
gainhas
a moreconsistent
behavior
and a smoother shape curve.The
phenomenon ofdot
gainhas been
studiedexhaustedly
through
the
years.As
aresult,
analytical models
have been
proposedto
predictthe
size ofthe
dot
onthe
substrate,
also calledeffective
dot
areas.Two
ofthese
models arethe
FOGRA
andthe
GRL
dot
gainmodels,
whichare
theoretically
andempirically derived
with predefineddot-gain
curvesaccording to
their
mathematical equations.
The
best
dot-gain
modelaccurately
representsthe
flexographic
dot
gaincurve.
Therefore,
based
on previousstudies,
a new equationis
proposedin
this
researchcalledthe
Fitting
Equation,
whichfits
better
the
characteristics ofthe
flexographic
dot
gaincurve.The
purpose ofthis
research projectis
to
analyzethe
colorimetricperformance ofdifferent
dot-gain models and
color-mixing
modelsin
the
characterizationofthe
flexographic
process.To
achievethe
goal, this
research projectincludes:
An
experimental press runto
gatherdata
utilizing
two
different
targets:
onefor
characterization,
andthe
otherfor
evaluationpurposes.The description
and analysis ofthe
performanceofdifferent
dot-gain
models comparedto
the
flexographic dot
gain curve.The
models analyzed arethe
FOGRA
dot
gainmodel, the
GRL
The
description
and analysis ofthe
performance ofdifferent
color-mixing
models whencombined with
the
dot-gain
models.The color-mixing
modelstested
arethe
Murray-Davies
and
its Yule-Nielsen
modificationfor
the
single-colorramps,
andthe Yule-Nielsen
originalmodel and
the
Spectral Neugebauer
equationswithYule-Nielsen
modificationorVHM-1
for
multi-color ramps.
Analysis
of otherphenomena,
such asink
spreading,
that
may be
modeledfor better
colorimetric performance.
Analysis
ofthe
colorimetricvariability
ofthe
flexographic
pressfor
the
purposeofanalyzing
the
robustness ofthe
models.Chapter
2:
Statement
of the
Problem
and
Hypotheses
As
a result ofimprovements
in image
quality
andcost-effectiveness,
overthe
last
five
years,
flexography
has
taken
a greatdeal
ofthe
printing
marketfrom
gravureand offsetlithography.
At
the
sametime,
some characteristicshave
been brought
to
light
that
makethis
processhard
to
controL
andit
stilldoes
not allowfor
useful external processes such as proofing.One
well-known
problemis high dot
gainin
the
highlight
regions ofanimage. Other
phenomenain
the
flexographic
process,
such asink spreading
andtrapping,
aredue
to the
presses sincetheir
mechanical structure makes
them
vulnerableto
sudden changesin
printing.Colorimetric
characterization ofthese
processesis
currently
being
achievedby
the
measurementof
targets
containing
morethan
1000
patches.12This
is
for
the
purpose ofsampling
the
colorgamutof
the
device
andpopulating 3D-LUT's. This
is
not avery
practical methodbecause
ofits
large
number ofmeasurements,
nordoes it
have
flexibility
or atheoretical
basis.
Flexography
has
a number of uniquefeatures
whichmay
makecharacterizing
its
colorimetric performancechallenging.
The
characterization ofprinting
devices
canbe
achievedby
utilizing
analytical models such asMurray-Davies
orthe
Neugebauer
equationsthat
predicttheir
colorimetric performance.Some
advantages of
using
analytical models arethat
they
requireless
measurementdata
asinput,
"consumables"
are
left
asindependent
variables,
andthe
models providemodeling
tools
for
The
purpose ofthis
researchis
to
identify
the
best
mathematicaltools
to
usefor
analyticalcharacterization of
the
flexographic
processby
analyzing
the
suitability
ofdifferent dot-gain
andcolor-mixing
models,
anddetermining
whether or not other phenomena relatedto the
processneeds
to
be
modeled.In
orderto
achievethis
goal,
the
overall characterizationmodeling
mustpredict all of
the
uniquefeatures
(or
atleast
the
mostsignificantones)
that
flexography
has,
andmust yield
low
AE*ab
orAE*94
valuesbetween
the
colorimetric measurements ofthe
printedsamples and
the
output ofthe
concatenatedcharacterizationmodels.Research
Question
Can
the
flexographic
processbe
characterizedaccurately using
selected(described
below)
models
for
dot-gain,
color-mixing
and other phenomenauniqueto
this
process?Hypotheses
1
.At
least
one ofthe
dot-gain
models consideredin
this
study
accurately
characterizesthe
dot
transfer
performance ofthe
flexographic
printing
process.2.
At
least
one ofthe
color-mixing
models consideredin
this
study
accurately
characterizesthe
colorperformanceof
the
flexographic
printing
process.3.
The
combination ofdot-gain
andcolor-mixing
modelsaccurately
yieldsthe
colorimetricperformancewhen
characterizing
the
flexographic
pressfor
afixed
set of process conditions.4.
The
ink
spread phenomenon canbe
omittedfrom
the
characterization stage ofthe
flexographic
press without significantloss
ofcolorimetric accuracy.5.
The
dot
gainvariability
affecting
anothertarget,
printedwiththe
samespecifications,
is
wellChapter
3:
Flexographic
Process
3.1
What
is Flexography?
As
technology
has
advanced,
mass-productionprinters,
whose applicationtechniques
date back
to
the
1800s,
have become
ahuge
commercialforce
in
the
world.Their
processesrely
onthe
principle of an
image
carrier,
divided into image
and non-image
areas,
that
selectively
transfer
ink
to
asubstrate,
suchaspaper ofplasticfilm.
Among
the
most widely-used are offsetlithography,
gravure,
andflexography. All printing
techniques
have
characteristicfeatures
whichmakethem
unique.For
example,
gravure utilizesrecessed,
engravedcells on a cylinder which arefilled
withink
andthen
putin
contact withthe
substrate.
Offset
lithography,
a planographicprinting
process,
has
the
image
areasessentially
atthe
samelevel
asthe
non-imageareas,
the two
being
distinguished
by
water-ink compatibility.Flexography
is
areliefprinting
process wherethe
image
areas are raised abovethe
non-imageareas.
3.2
Process
Description
The
workflowfrom
the
digitized image
to
the
final
hard
copy
involves
many
stepsbefore
the
[image:20.540.109.465.338.606.2]actual press
is
used.'Figure 3.1
showsthe
majorprocessesinvolved.
First,
the
image
is
digitized
through
aninput
device;
orif
it is
already in digital
form,
it is
modifiedto
be
suitedfor
impression.
This
is
calledthe
pre-press stage.Typical
modificationsinclude
image
sampling
rateadjustment,
dot
gaincompensation,
colorseparations,
out-of-gamutwarning,
registrationmarks,
control
targets,
elongationcompensation,
colorcorrection,
gray
balance,
andbrightness-contrast
improvement.
2During
the
nextstep,
the
image is
put onfilm
whichis
negative and rightreading.
The
image
carriers areflexible
plates madefrom
rubber orphotopolymers.The design
is
imaged
on
the
platefrom
the
negativefilms.
The
film
andthe
plate are putin
contactandexposedusing
a
UV
lamp
that
polymerizesthe
image
areas,
leaving
the
non-imageareas soft.Then
the
plateis
washed with a solvent
that
removesthe
unpolymerizedmaterial,
forming
the
reliefheight
ofthe
image
areas.Two
more steps offmishing
andpost-exposurefollow
to
removethe tackiness
andto
increase
the
degree
ofpolymerization ofthe
plates.The
plates are nowready
to
be
mountedonto
the
printing
cylinders and sentto
press.The
numberofplatesis
equalto the
number ofinks
used.
The printing
process consists ofvarying
arrangements of cylindersdepending
onthe
ink
metering
system.There
aretwo
maintypes
ofink
metering
systems,
as shownin Figure 3.2:
enclosed chambered and
two-roller
systems.The
configuration of cylindersdetermines
the
transfer
ofthe
ink
ontothe
platecylinder,
whichis
wrappedby
the
imaged
plate,
andto
the
substrate
that
is
in
contactwiththe
impression
rollerto
supportthe
web.These
rollers arelabeled
fountain
roller,
aniloxroller,
platecylinder,
andimpression
cylinder.The fountain
roller and/ordoctor blade
canbe
omitteddepending
onthe
configuration ofthe type
ofink metering
systemand press.
The process,
subjectto
many
variations,
is
essentially
asfollows:
a) ink
is
pickedup
by
the
fountain
roller;
b)
theink
is
then
transferred to the
aniloxroller,
anengravedcylinder withcells
that
fill
withink;
c)
the
excessink
is
wipedaway
be
adoctor
blade
(shown
in
first
diagram
in Figure 3.2
as a chambereddoctor
blade
system)
orby
a speeddifferential between
the
fountain
and aniloxrollers,
leaving
ink
only in
the
cells;
d)
ink
is
transferred
to the
plateimage
areas
by
contactwiththe
aniloxroller;
ande)
ink
onthe
plateis
transferred to the
substrate asit
is
pressedbetween
the
impression
rollerandthe
plate cylinder.Plate Cylinder
Substrate
Rate
Cylinder
Doctor
Blade
mpression(_yl
i
nd erAnilox
Roller
Plate
Anilox
Roller
Fountain
Roller
Ink Fountain
Substrate
Ink
3.3
Printing
Variables
Prediction
ofthe
final
outputis
quitechallenging,
sincethere
areseveral variablesthat
makethe
process
difficult
to
control.These
include:
Dot
gain-This
is
the
unavoidable growthin dot
size.10In
flexography,
it
canbe
found both
in
the
film-to-plate
process aswellasthe
plate-to-paperprocess.Dot
gain produces abreak
up in
vignettesin dot
areasbelow
10%,
notallowing
asmoothtransition.
It
also produces adarkening
of thehighlights
on animage,
limiting
the
quality
ofthe
reproduction.Some
research
indicate
that
this
variable affectsflexography
morethan
otherprinting
processes.3'4
Two
causesfor
this
characteristic arethe
hardness
ofthe
dots imaged
onthe
plate andthe
impression
pressure appliedto the
plate ontothe
substrate.Other
causes relateto
the
substrate and
ink
properties, speed,
andthe
relationship between
the
ink metering
systemandthe
screenruling
ofthe
image.
The
anilox rollerdetermines
the
amount ofink
delivered
to
the
plate,5
and
is
controlledby
the
cellcount,
the
cell volume andthe
depth-to-opening
ratio.Studies
by
Crouch5have found
that
dot
gainis increased
by
low
aniloxcell count andlower
depth-to-opening
ratios.An
example ofthe
dot
gain versus originaldot
area onthe
film
is
presentedin Figure 3.3.
These
data28weredefined
by
the
following
specifications:1)
Image
screenruling
of150
lpi,
2)
press speed of100
fpm,
and3)
Ink viscosity
of53
secondsZahn's
Cup
#2. Notice
that
for
small
dot
areas(below
0.1),
the
rate ofdot
gain versusdot
areais
muchhigher
than
for
the
shadows.
Also,
the
maximumdot
gain achievedwasnotonthe
50% film
dot
area asassumedfor
the
otherprocesses.6,7
Dot
gainfor
any printing
process variesconstantly
withany
changein
processconditions,
such as
speed,
inks,
substrate,
impression
pressure,
and others.The
question,
however,
focuses
onthe
contribution of each ofthese
variablesto
dot
gain change andthe
effect oncolor.
Dot
gain vs.Film
dot
area0.2
0.4
0.6
Film dot
area [image:24.540.76.444.340.558.2]0.8
Dot
gainin
flexography
is
affectedby
severalfactors.
Even
atlow impression
pressure, the
dot
onthe
plate,
whenin
contact withthe substrate,
deforms
and compressesdue
to
the
softnature of
the plate,
allowing
the
ink
to
spread andincrease dot
gain.10
During
this
process,
the
hardness
ofthe
platemateria^
the
rheology
ofthe
ink,
andthe type
of substratehave
agreat
influence
onthe
amount ofdot
gain.If
the
plateis
made ofaharder
material,
the
dot
willnot
deform
aseasily
aswhena plateis
madefrom
asofter material.A
technique
sometimes usedto
reducedot
gaininvolves
the
use of specialplates,
called"capped"
plates.
A relatively
hard
layer
is
deposited
abovethe
normal soft elastomerlayer.
This
harder,
thin
layer,
which serves asthe
image
area,
deforms
significantly
less
than the
underlying
elastomer,
resulting in
(claims
of)
reduceddot
gain.A
higher ink viscosity
willlimit
the
ink displacement. Different
substrateshave different
absorption properties:
for
example,
corrugated and uncoated paper willhave
ahigher dot
gain
than
film
and coated paper.Other
variables-New
presses
have included
more unitsin
their
design,
sothat
printershave
the
ability
to
include
morethan
the
just four
process colors.These
colors are called spotcolors.
Because
these
inks
areformulated
specifically
to
achievethese
colors,
they
may
be
out of gamut when
trying
to
matchthem
withafour
process colors perspective.Pantone
andSwatch
are specifications relatedto
these
colors,8
but
they haven't
been
officially
standardized
in
the
industry.
Ink
trapping
refersto
a changein
lightness,
chroma,
andhue
of acomposite colordue
to
the
overprinting
oftwo
primary
color inks9 andmay
causelarge
colordifferences
comparedto
single-color performance.
Bruno5
mentions
that
ink
trapping
for
flexography
is
notimportant
since
the
inks
used arevery
fluid
andfast
evaporating,
allowing
the
ink
to
be
completely
dried
whenreaching
the
next color withvery
little
or notack.
However,
lino
andBerns
found
that
eventhough
there
is
no mechanicalink
trapping,
aneffectis
found
wherethe
dot
gain
for
the
overlapping ink
decreases
asit
was superimposed over anotherink
comparedto
its
performanceonthe
substrate.They
calledthis
opticaltrapping.
Another
phenomenonis ink
spreading,
which canalsobe
identified
asdot
gainin
the
shadowareas.
This
is
when atint
near100%
is filled
in before
the
solidink
density
is
reached,
i.e.,
the tint
has
a greaterdot
area with athinner
ink
film.7This
phenomenonis
analyzed3.4
Simplification
of
the
Process
The
mainconcernin
flexography
is
the
large
number of variables whichare presentin
aspecificjob.
The
possible combinations of pressspeed,
aniloxspecifications,
halftone technique,
inkproperties, substrates,
platematerials,
exposuretimes,
and other variables are almost endless.Work
has
been
done
in attempting
to
analyzethe
effects ofdifferent
variables onprinting
quality.5
Changes
in any
ofthese
variablesrequire adifferent
analysis ofthe
press run,however,
if repeatability
andconsistency
ofthe
results canbe
ensured,
then
colorimetric characterizationof
these
pressesmay
be
more accurate.This
research studiesthe
features
ofthis
processto
achieve a simplified colorimetriccharacterization.
One
setofprocessconditionsis
usedfor
testing
the
different
analyticalmodels.This
is
presentedin Figure 3.4.
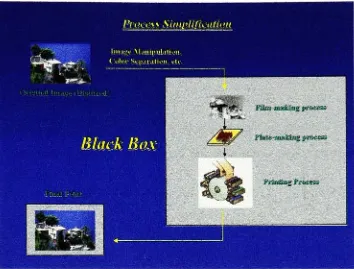
Figure 3.4: Simplification
ofthe
process usedin
this
research.Figure 3.4 indicates
that
all stepsbetween
the
originalimage
andthe
final
print willbe held
Chapter
4:
Press Run
Because
dot
gain variesaccording
to
different
conditions andimage
specifications,
in
this
research, the
press conditions and variables are setto
a specific value.The
scopeis
to
fix
these
variables and analyze
the
performance ofthe
analytical modelsfor further
expansion.The
specifications were used
in
orderto
match,
asclosely
aspossible,
those
establishedby
the
FFTA
12The
conditions arefixed from
the
image
specificationsto
the
actualpress,
throughout the three
major processes:
the
image
creationandfilm-making
process, the
plate-making
process,
andthe
printing
process onthe
press.The
specificationsfor
image
creation andfilm-making
arepresented
in Table 4. 1
.Table 4. 1
:Image
and Film-Making
Specifications
Image
and
Film-Making
Specifications
IMA
[GE
FI1
_MImage
size8x10
in.
Image Setter
AGFA
SeletSet
5000
Screen ruling
133lpi(52
1/cm)
Processing
Chemistry
Kodak Rapid
AccessScreen
anglesC 22.5
,
M 82.5
Y 7.5 ,K
52.5Film
type
Matte
Dot
shapeRound
Addressability
2400
dpi
In
the
prepressstep,
the
software usedto
createthe
image
wasAdobe
Illustrator
8.0,
whileQuarkXPress
4.0
was usedto
setup
the
layout
ofthe
film.
Also,
someimage
manipulationwasdone
in
Adobe
Photoshopto
specify
the
screenruling,
angle anddot
shape.Transfer
ofthe
image
to the
image
setter was accomplishedby
using
the
RIP
programinstalled in
the
AGFA
device driver.
To verify
the
consistency
ofthe
dot
area onthe
film
comparedto
the
digital
file,
some patches were measured on
the
film utilizing
atransmission
densitometer. The
dot
areasgiven
by
the
apparatus were calculatedby
the
Murray-Davies
equationgiving
dot
areadifferences
of+1%
in
somepatches,
whicharewithinthe
measurement error.The
nextstep
wasthe
plate-making
process.The
main variableshere
areback-exposure
time,
main-exposure
time,
wash-up
time,
post-exposuretime,
andfinishing
time.
The
back-exposure
time
determines
the thickness
ofthe
non-image areas ofthe plate,
known
asthe
floor
height.
A
time
exposuretest
is
done
to
determine
the
correctback-exposure
time.
The
test times
rangefrom 5
to
40
secondsin increments
of5
seconds,
andthe time that
produces aThe
main exposuredetermines
the
height
ofthe
image
areas,
whichin
rumdetermines
the
sizeofthe
smallestdot
onthe
plate andthe
quality
ofthe
image in
general.A
time
exposuretest
is done
utilizing
atarget
commonly
used atRIT
that
allows verification ofthree
elementsto
determine
the
best
suitabletime.
The
elementsto
be
considered were smallestdot
onthe plate,
straightlines,
and solids(dot
area equal100%). The
times
variedfrom
10
to
25
minutesin
increments
of5 minutes,
andthe
best
time
was selectedby
visual evaluationofthe
elements.Wash-up,
postexposure,
andfinishing
times
were predefinedby
previousworkutilizing
the
sametype
ofplate.The
values are presentedin Table 4.2.
Table 4.2:
Optimized
Plate-Making
Specifications
Plate-Making
Specifications
Plate Type
Flexo
light
Epic,
cappedBack-Exp. Time
28
secWash-up
Time
7
minFinishing
Time
14min
Plate Thickness
0.067
in
Main-Exp.
Time
17
minPost-Exp
Time
lOmin
To
niinimizethe
variationbetween
images,
plates ofthe
same color were exposed atthe
sametime,
andthe
maximumvariability
ofthe
back- and main-exposuretimes
were+3
sec and+8
sec,
respectively.The
final step in
the
run wasthe
actualprinting
process,
wherethe
inks,
plates and substratecame
into
contactto
producethe
final
prints.The printing
press used was aMark
Andy
narrow-webflexographic
press.This
type
ofpressis
mainly
usedfor label
and medicationpackages,
andhas
the
advantageofsmaller size andenergy
consumption,
atthe
cost oflimited image
sizes and speed.The
inks,
water-basedCMYK
processinks
and extenderaccording
to
FIRST
Specifications
secondedition,
were providedby
Environmental Inks
andCoatings.
The
substrate was providedby
Simon
Labeling
andis
the
UPM Raflatac 60
lb. highgloss face
labeling
paper.The
specificationsfor
the
pressrunarelisted
[image:32.540.146.400.348.569.2]in Table 4.3.
Table 4.3: Press Run Specifications
Press
Run
Specifications
Sequence
YMCK
Speed
120
ft/min (0.6 m/sec)
Stick}
back
3M
Scotch Brand Tape
1015
Impression
Press.
OK
Density
Y-1.00+.05, M-1.25+.07,
C-1.35.07,K-1.45.07,
Anilox Rollers
Y-900
cpi,
M-700
cpi,
C-700 cpi, K-C-700
cpiDryer
Temperature
175
deg.
F
Anilox
Configuration
Y-two
rollerThese
variables were maintained asconstantly
as possibleduring
the
run.The
selection ofthese
variables was
derived from
the
press condition and past performance.The
changein
aniloxconfiguration
between
the
doctor blade
andthe
two-roller
anilox configurationfor
yellow wasimplemented
to
increase
the
density
to the
desired level.
The impression
pressureis
a variablethat
cannotbe
measuredduring
the
run.Thus,
it is
commonly set-up for
the
minimum pressurethat
achievessatisfactory
printing
calledkiss impression.
Unfortunately,
impression
pressuremay
have
alot
of effectin dot
gain,
sothat
any
pressure changes madeduring
the
run will affectthe
dot
gain.One
ofthe
mostimportant
variablesto
measure andcontrolduring
the
runis
the
density
ofthe
4-process colors
because
this
is
directly
relatedto
reflectance.The
apparatus usedto
measuredensity
was anX-Rite densitometer
setup for Status
T
and absolutedensity
readings.The
density
values variedthroughout the
run.After reaching
the
range ofdesired
densities,
many
samples were printed and collected
for
analysis.Chapter
5:
Dot-Gain Models
5.1
Dot
Gain
The
increase
ofdot
sizedue
to
the
physical properties ofthe
dot
is
calleddot
gain.The
phenomenon of
the
Yule-Nielsen
effectis due
to
the
light entering
the
substrate areas ofthe
halftone
pattern andexiting
underthe
ink
areassimulating
anincreased
density
effect.To
compensate
for
this
deficiency
ontheir
model,
an nfactor
was addedto the
Murray-Davies
equation
to
fit
the
data
and yieldbetter
predictionsof reflectancefactors.
Dot
gainis
calculatedby
the
difference between
the
effectivedot
area andthe theoretical
dot
area,
i.e.,
dot
areaofthe
print minusthe
dot
areaofthe
film Dot
gainis
calculatedaccording
to
Equation
5.1,16being
a,
the
dot
area,
andthe
subscripts/?and/,
printandfilm
respectively.Aa
=ap-af
5.2
Murray-Davies
vs.
Yule-Nielsen
Modified Dot Area
Calculation
In
orderto
calculatethe
dot
area of atint,
two
approacheshave
been
derived.
The
first
oneis
the
relationship between
density
anddot
areautilizing
the
Murray-Davies
equation as shownin
Equation 5.4. This
equationisolates
the
areaofthetint
andreplacesthe
reflectance with opticaldensity.
The
meaning
ofthis
equationis
that the
area ofthe tint
is
proportionally
relatedbetween
the
light
that
is
reflectedfrom
the
ink
film
tint
andthe
light
reflectedfrom
the
ink film
solid.The
1
in
the
upper andlower
parts ofthe
equation appearsbecause it
is
assumedthat
the
reflectanceof
the
paperof substrateis
the
unity.As
simple asit
is,
this
equationis
only
validfor
first
surfacereflecting
bases,
and notfor bases
that
causemulti-scattering
oflight.
The
Murray-Davies
equationis
shownin Equation
5.2,
whereA
is
the
dot
area,
Dt
is
the
opticaldensity
ofthe
tint,
andDs
is
the
opticaldensity
ofthe
solid.Rt
andRs
arethe
reflectancefactors
of
the
tint
andsolid,
respectively.This
formula
assumesthe
photometer ordensitometer
is
nulledor"zeroed"on
the
printing
substrate sothat
adensity
of0
or a reflectance ofunity
is
obtainedfor
the
unprinted paper.1-10"'
__!-#,
~\-\Q~D'
~1-R,
Equation 5.2: Murray-Davies
dot
area equation.To
accountfor
the
scattering
ofthe
light
withinthe
substrate,
Yule
andNielsen developed
amodel
that
included
annfactor into
the
Murray-Davies
formula
asshownin
Equation
5.3.
___. i
_
1-10
"
\-R.
A-:___
I
1-10
"l~Rs"
Equation
5.3: Yule-Nielsen
modification.
Because
it is
more generalthan
the
Murray-Davies
model, the
Yule-Nielsen
equation willproduce results which are no
less
accuratethan
those
producedby
the
Murray-Davies
formula,
and
may
be
undermany
practicalconditions, significantly better.
Taking
into
accountthe
nonlinearity
ofthe
behavior
ofthe
light
reflectedfrom
the
halftone
tint,
5.3
Dot-Gain
Models
Viggiano's
GRL
model7and
the
FOGRA
modeL17are
two
ofthese
dot-gain
models whichdepend
onthe
behavior
ofthe
shape ofthe
dot.
The
advantages of mathematical modelsfor dot
gain are
that the
dot
gain curve canbe
predictedbased
onfew input
variables,
resulting in
aminimumofexperimental measurements.
Also,
simulationsmay be
run withoutgoing
to
pressin
order
to
identify
the
best
process conditions.The
major concernis
that
the
performance ofthese
models
is
questionable16
due
to the
fact
that
they
may
notbe
customizedfor flexography. These
models
transform
dot
areato
dot
area,
andthe
calculations ofthe
areasdepend
onthe
equationused as mentioned
before.
5.3.1
FOGRA Model
This
modelis
entirely
empirical-it is essentially
an exponentialappropriately
scaled.The
FOGRA
model usedin
this
research relatesthe
input
withthe
outputdot
areas ofdifferent
transfer
steps,
based
onthe
assumptionthat the
dot diameter is
constant.The
transfer
characteristic curveis
presentedin Equation
5.4,
where,
ay is
the
screendot
area ofthe
outputin
percentagebasis,
ax
is
the
screendot
area ofthe
input,
andAaso%
is
the
characteristicvalue.
100%
A
Equation 5.4: FOGRA
dot
gain model.The
characteristicvalue,
Aaso%,
is
described
asthe
dot
gain ata50%
screendot
area ofthe
input.
This
modelhas
only
the
characteristic value as aparameter,
andbased
onthis value, the
complete
transfer
curve canbe derived.
Depending
onthe
different
variables ofthe
process,
the
parameter changes
to
describe
the
behavior
ofdot
transferring
in different
stages,
thus
predicting
dot
areas more accurately.The
shape ofthe
dot
gain curvevarying
parameter,
Aaso%,
is
predefinedby
the
modelas shownin Figure 5.1.
0
10
20
30
40
50
60
70
80
90%100
[image:38.540.143.407.276.528.2]Rachendeekungsgrad
F>:
Figure 5.1
:Standard
shapeofdot
gain curvefrom
the
FOGRA
modelvarying
Aa50%
(from
5.3.2
GRL Model
In
1985,
J.A.S.
Viggiano7published a modelwiththe
purposeofdescribing
dot
gain curves.This
model allows one
to
mathematically
calculatethe two
criticalprinting
areas,
which arethe
smallest
dot
that
canbe
printed andthe
dot
areathat
produces asolid,
100% dot
area,
withthe
purpose of
identifying
the
limitations
ofthe
process.The GRL
modelis based
on a combination oftwo
theories
ondot
gain,
the
perimeter andisokonturen
models.The
former
rests onthe
assumptionthat
the
gainis
proportionalto
the
perimeter of a
dot, i.e.,
the
dot increase is based
onits
perimeter where smalldots have
moregain
than
shadowdots.
The
latter
statesthat
alldots increase in
diameter constantly
regardless oftheir
size.The
GRL
modelis
a semi-empiricalmodel andis
presentedin Equation 5.5 in
its
singletransfer
form,
where,
ay is
the
screendot
area ofthe
output subjectto
aminimum of0
and a maximum of1,
ax
is
the
screendot
area ofthe
input,
andA
is
the
characteristic gain value similarto the
parameter
in
the
FOGRA
model.a
=a_
+2-A-^
(!-_)
Equation 5.5: GRL
model.Based
onthis
equation,
the
GRL
modeldescribes
the
dot
gain as asemi-ellipse,
wherethe
highest
gain valueis
at50%
ofthe
dot
area onthe
input.
This
is
not alwaysthe
casein
flexography.
Therefore,
this
model canbe
used as a cascade oftwo
single-transferequations,
which shifts
the
peak ofthe
curvedepending
onthe
transfer
characteristic values.In
this
case,
the
output of one equationis
the
input
ofthe
other equation withtwo
different
transfer
characteristic
values,
as shownin Chapter
7. The implication
ofutilizing
two transfer
equationsis
that there
couldbe different
stages wherethe
dot
gains or sharpensits
size andthey
can existas
the
dot
is
transferred
from
one processto the
other.Thus,
instead
ofmodeling
the
entireprocesswithone
fixed
equation,
the
processis
broken up into
more steps.The
shapeofthe
curve predictedby
the
GRL
modelfor
two
cascadefunctions
is
shownin
Figure
5.2.
rfSr
C_SC_6Ot Two [image:40.540.174.374.347.592.2]ifwipi* ssirt'4;*!,. nn
Figure 5.2:
Standard
shapeofdot
gain curvefrom
the
GRL
modelvarying
Aa50%
(from
5.4
Proposed
Model
A
newdot
gain equationis
proposedfor
abetter
prediction ofthe
flexographic
dot
gain.Looking
at
the
dot
gain curve shownin
Figure
3.3,
it
canbe
seenthat there
arethree
important features
that
fit
the
gathereddata.
The
dot
area was calculatedfrom
the
density
readingsutilizing
the
Y-N
modificationwith nequal
to
1.8. There
arethree
maincharacteristicsofthe
flexographic
dot
gaincurve
from Figure
3.3.
One
ofthem
is
the
high
slopethat
is formed in
the
highlights
wherevery
small changes
in
dot
areain
that
region producelarge increments
in
dot
gain.Another
is
the
smooth slope
formed in
the
dark
regions.The
last
oneis
the
peakdot
gain orthe amplitude,
whichone notes
does
notfall
onthe
50%
dot
area,
but
in
a smaller area.With
this
in
mind, the
plot can
be
separatedin
two:
one regionfrom
the
smallestdot
areato the
dot
area withthe
maximum
dot
gain,
andthe
otherfrom
the
latter
dot
areato the
maximumdot
area attainable.Figure 5.3
and5.4
showboth
regionsofthe
same curve.Dot
gain vs.film dot
area(0
to
af(max
dg))
0.35 0.3 -0.25 -S* 0.2
-0.1 -0.05 J
0 0.1 0.2 0.3 0.4 0.5
film
dot
areaDot
gain vs.film dot
area(af(max
dg)
to 100
%)
0 4
0.35
-0.3
-0.25
-W 0.2
-_3 0.15
-0.1
-0.05
-0
-0.4 0.6 0.8 1
film dot
areaFigures 5.3
and5.4:
Dot
gaincurve separatedby
the
dot
areawithlargest
dot
gain.Analogous
withthe
modelsfor CRT
characterization,18these
curvesmay
be fitted
withthe
equations
shownin Equation 5.6.
M
=\
kg,
kg,
-a*,
0<a<a
f
b-fY
(l-a)\
af<a<\
Equation 5.6: Dot
gain model similarto
CRT
characterization.The
terms
in
Equation
5.6, kg!
are similarto
the
gainparameterin
the
CRT
model,
andyi
and?_
similar
to
the
gammaparameter,
ais
the
dot
area onthe
film,
anda/ is
the
dot
area withthe
largest dot
gain value.The
new parameters canbe
estimatedby
least-square
orany
otherstatistical
method,
orthey
canbe
studied moreto
verify
whetherthey
represent specificcharacteristics of
the
dot
gainwithsystematictrends.
The
fit for
the
example shownin Figures 5.3
and5.4 using
equation5.6
is
shownin
figures
5.5
and
5.6.
1.00
The
curves werefitted
using
SYSTATwith non-linearregression
to
estimatethe parameters,
and
the
values ofthe
parameters arekgi
=0.598,
#
=0.605,
andy2
=0.840,
with R2of
0.991.
The
advantages ofthis
model arethat
it fits
the
flexographic
dot
gain curvevery
well,
allowsthe
ability
to
describe
any
type
ofprinting
conditions withoutin-depth
measurements and canbe
statistically
estimated.The
disadvantages
arethat
is
nottheoretically
derived,
it
needsknowledge
of
the
dot
areathat
yieldsthe
maximumdot
gain,
andit
needs experimentaldata
to
estimateits
parameters.
Chapter 6:
Color-Mixing
Models
6.1
Color-Mixing
Models
The modeling
of colorin
systemsis
achievedin
partby
characterization ofthe
devices
andindependence
from device
andviewing
conditions.The
idea
behind
characterizationis
to
know
the
behavior
of color ofthe
device, i.e.,
determine
the
colorimetric characteristics.In
colormodeling, there
aredifferent
techniques to
characterize adevice:14
a)
Analytical
models suchasthe
Neugebauer
equations, Yule-Nielsen model,
Clapper-Yule
model,
among
others;
b)
multipleregression;
c)
3-D
table
look-up
with multidimensionalinterpolations;
d)
artificial neuralnetworks;
ande)
fuzzy
logic.
In
industry,
colorimetric characterizationis
oftendone
by
utilizing 3D-LUTs. As Samworth
describes,
there
is
asystem calledGIMS
by
DuPont,
which usesCIELAB,
andmeasures atest
target that
consists of1800
colors printedby flexography
andthe
prooferto
create adirect
relation
between
the
press'CMYK
values andthe
proofer'sCMYK
values.This
creates a3D-LUT
capable ofreproducing
billions
ofcolors.The only drawback
is
that
it
requires alot
ofmeasurements and
there
is
noflexibility
for further improvements
since,
if printing
conditionsColor-mixing
models aremathematical
descriptions
ofthe
formation
of colorfrom basic
primaries,
which when combinedin
different
amounts,
can createdifferent
colors withinthe
gamut ofthe
device.
The
use ofcolor-mixing
modelshas
advantages overthe
othertechniques.
Analytical
modelsrequire
less
measurementdata
asinput,
"consumables" areleft
asindependent
variables,
they
provide
modeling
tools
for
engineering improvement
onthe
device,
they
mmimize problemsfrom linear
subsampling
in
non-linear spaces and colorimetric calculations performedin any
illumination
andviewing
conditions.19
6.2
Description
of
the
Models
In
the
field
of analytical modelsfor
halftone
printing,
there
aremany
variations ofthe
mainmodels
(the
Neugebauer
equations,
Murray-Davies,
andYule-Nielsen
models),
yielding
different
performances.
However,
the
mainidea is
the
same:"mathematical
models capable of