Rochester Institute of Technology
RIT Scholar Works
Theses Thesis/Dissertation Collections
11-1-2010
Characterization of two-phase flow in a transparent
PEM fuel cell using simultaneous anode and
cathode visualization and digital image processing
Jacqueline Sergi
Follow this and additional works at:http://scholarworks.rit.edu/theses
This Thesis is brought to you for free and open access by the Thesis/Dissertation Collections at RIT Scholar Works. It has been accepted for inclusion in Theses by an authorized administrator of RIT Scholar Works. For more information, please [email protected].
Recommended Citation
i
Characterization of Two-Phase Flow in a
Transparent PEM Fuel Cell using Simultaneous
Anode and Cathode Visualization and Digital Image
Processing
by
Jacqueline M. Sergi
A Thesis Submitted in Partial Fulfillment of the Requirements for the Degree of
MASTER OF SCIENCE
in
MECHANICAL ENGINEERING
Approved by:
Dr. Satish G. Kandlikar
Department of Mechanical Engineering (Thesis Advisor)
Dr. Steven W. Day
Department of Mechanical Engineering
Dr. Robert J. Stevens
Department of Mechanical Engineering
Dr. Wayne W. Walter
Department of Mechanical Engineering
(Department Representative)
DEPARTMENT OF MECHANICAL ENGINEERING ROCHESTER INSTITUTE OF TECHNOLOGY
ii
Thesis Reproduction Permission Statement
Permission Granted
Title:
Characterization of Two-Phase Flow in a Transparent PEM Fuel
Cell using Simultaneous Anode and Cathode Visualization and
Digital Image Processing
I, Jacqueline M. Sergi, hereby grant permission to the Wallace Library of Rochester Institute of Technology to reproduce my thesis in whole or in part. Any reproduction will not be for commercial use or profit.
iii
I.
Abstract
internal combustion engines in order to curb dependency on fossil fuels and reduce harmful
CO2 emissions. Water management has been identified as a key research area for the
advancement of PEM fuel cell technology, especially as it affects the purge protocol prior to
cell shutdown. The presence of water in the cell is necessary to sustain membrane hydration,
but the accumulation of excess liquid water, referred to as flooding, can lead to increased
mass transport losses and reductions in performance and durability. In this work, a technique
was developed to characterize the two-phase flow in the anode and cathode flow field
channels simultaneously using a transparent fuel cell with dual-visualization capability. The
transparent fuel cell used in this work was designed to represent actual full scale automotive
fuel cell geometry. A video processing algorithm was developed to automatically detect
dynamic and static liquid water present in the gas channels and generate relevant quantitative
information. The water coverage ratio is introduced as a parameter to capture the
time-averaged flow field water content information through recorded video sequences. The
algorithm also yields information pertaining to the distribution of water among different
two-phase flow structures. The water coverage ratio and distribution metrics were employed in
comparing the performance of Freudenberg and Toray gas diffusion layers (GDLs) from a
water management perspective, including direct anode to cathode comparisons for each GDL
sample. This technique was able to provide a unique and comprehensive characterization of
liquid water in an operating fuel cell which can be used towards the optimization of water
iv
II.
Table of Contents
I. Abstract ... iii
II. Table of Contents ... iv
III. Index of Tables and Figures ... vi
i. Figures ... vi
ii. Tables ... x
IV. Nomenclature ... xi
1. Introduction ... 1
2. Literature Review ... 5
2.1. Summary of Research Needs ... 14
2.2. Scope of Work ... 15
3. Experimental Methodology ... 16
3.1. Overview of Experimental Work ... 16
3.2. Experimental Setup ... 16
3.2.1. System Overview ... 16
3.2.2. Transparent PEM Fuel Cell Design ... 17
3.2.3. Dual-Visualization Setup ... 20
3.2.4. Material Properties of Cell Components ... 22
3.3. Experimental Procedure ... 23
3.3.1. Fuel Cell Operating Conditions ... 23
3.3.2. Fuel Cell Testing Procedure ... 24
3.3.3. Data Acquisition and Processing ... 25
3.3.4. Video Recording Procedure ... 25
4. Digital Video Processing Methodology ... 27
4.1. Overview ... 27
4.2. Analysis of Digital Videos and Images ... 27
4.3. Theory of Morphological Image Processing ... 29
4.4. Video Processing Algorithm ... 33
4.4.1. Input Files ... 33
4.4.2. Pre-Processing ... 34
v
4.4.4. Application of Morphological Image Processing ... 39
4.5. Calculation of Relevant Metrics ... 44
4.6. Slug and Film Detection using Connected Components ... 44
5. Results and Discussion ... 48
5.1. Fuel Cell Performance Characterization ... 48
5.2. Visual Observations of Two-Phase Flow in the Gas Channels ... 50
5.2.1. Stoichiometric Ratio 1.5/2.5 ... 50
5.2.2. Stoichiometric Ratio 1.5/5 ... 53
5.2.3. Stoichiometric Ratio 3/8 ... 54
5.3. Automatic Detection of Static and Dynamic Liquid Water ... 55
5.4. Water Coverage Ratio ... 59
5.4.1. Stoichiometric Ratio 1.5/2.5 ... 59
5.4.2. Stoichiometric Ratio 1.5/5 ... 60
5.4.3. Stoichiometric Ratio 3/8 ... 61
5.4.4. Tabulated Water Coverage Ratio Results ... 62
5.5. Flow Structure Differentiation and Water Distribution ... 63
5.5.1. Tabulated Water Distribution Results ... 66
5.6. Summary of Experimental Results ... 67
6. Conclusions ... 68
7. Recommendations for Future Work ... 70
8. References ... 71
9. Appendices ... 74
9.1. Appendix A: Water Detection and Quantification Algorithm (MATLAB) ... 74
vi
III.
Index of Tables and Figures
i. Figures
Figure 1.1 - Schematic of PEM fuel cell components and operation. Not to scale ...2
Figure 3.1 - Transparent fuel cell test system ...17
Figure 3.2 - Anode and cathode channel geometry and dimensions (not to scale) ...18
Figure 3.3 - Wavy channels on anode flow field/current collector...19
Figure 3.4 - Exploded view of test section assembly: (1) Lexan support piece, (2) rubber o-ring gasket, (3) current collector/flow fields, (4) PTFE gasket, (5) GDL (6) CCM ...19
Figure 3.5 - Assembled transparent fuel cell ...20
Figure 3.6 - Experimental setup: (a) transparent fuel cell, (b) Photron Ultima APX camera (anode), (c) Photron Fastcam 1024 camera (cathode), (d) motorized stage, (e) fuel cell test station, (f) temperature controllers ...22
Figure 3.7 - Confocal laser scanning microscope images of (a) Freudenberg H2315 GDL and (b) Toray TGP-H-060 GDL ...23
Figure 3.8 - Photron Fastcam Software used for simultaneous visualization of anode (left) and cathode (right) flow channels ...26
Figure 4.1 - Representation of (a) digital image, and (b) digital video. The dotted squares represent the picture elements (pixels) of the image ...28
Figure 4.2 - Common structuring elements (SEs) used in morphological processing: (a) cross, (b) square, and (c) disk. The black dots represent the origin of the SEs ...29
Figure 4.3 - Erosion operation: (a) set A, (b), structuring element B, (c) erosion of A by B, with dotted line representing original set A ...30
vii
Figure 4.5 - Comparison of opening and closing operations: (a) set A, (b), structuring
element B, (c) opening of A by B with dotted line representing original set A (d) closing of A
by B with dotted line representing original set A ...32
Figure 4.6 - Pixel neighborhoods: (a) pixel p and its 4-nieghbors, n, (b) pixel p and its
8-neighbors, n ...33
Figure 4.7 - Masking operation: (a) original image containing region of interest, (b) image
mask, (c) array product of (a) and (b) ...34
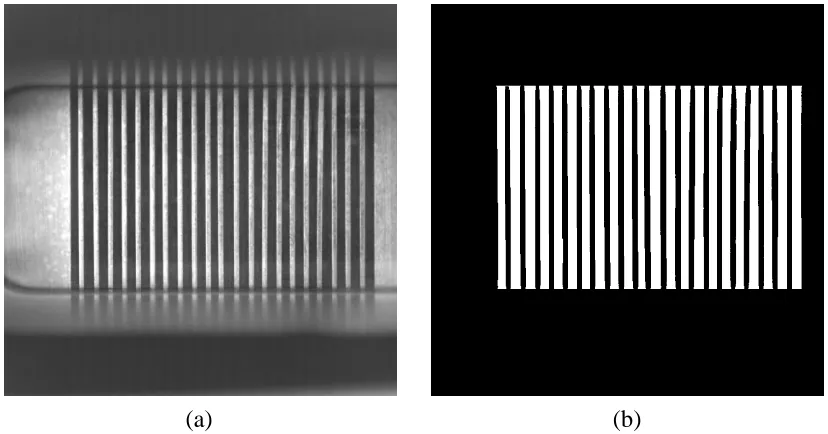
Figure 4.8 - (a) Dry video frame, cathode window #1, (b) corresponding mask image, with
white pixels representing channel area ...34
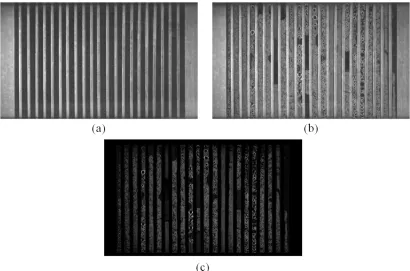
Figure 4.9 - Sample images from cathode window #1: (a) dry video frame, (b) test video
frame, (c) resulting absolute difference image of (a) and (b) ...36
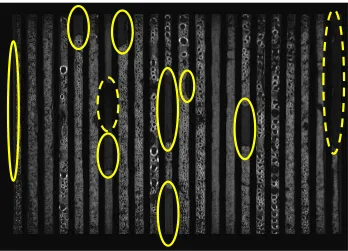
Figure 4.10 - Difference image from Figure 4.9(c) with different intensity regions
highlighted. Dashed yellow outline indicates unchanged GDL, solid yellow outline indicates
liquid water, and remaining non-zero intensity values represent condensation on channel
surface ...37
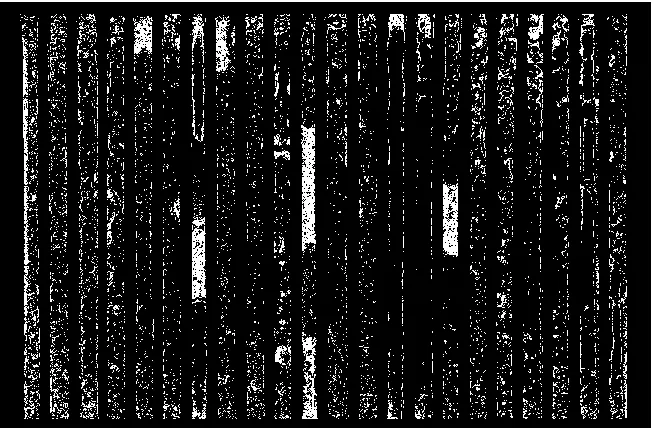
Figure 4.11 - Thresholded difference image. The locations with liquid water possess denser
pixel regions ...39
Figure 4.12 - Thresholded image after filling in holes ...40
Figure 4.13 - Area opening of thresholded image. Remaining connected components
represent liquid water in the channels ...40
Figure 4.14 - Area opening image after hole filling and bridging operations ...41
Figure 4.15 - Closing of Figure 4.14 using disk structuring element ...41
Figure 4.16 - Final processed frame with faint reference frame added. Locations of liquid
water in channels are represented by white pixels ...42
viii
Figure 4.18 - Labeling of connected components in a binary image: (a) binary image, (b)
corresponding pixel values of binary image, with 4-connected components highlighted, (c)
resulting label matrix using 4-connectivity...45
Figure 4.19 - Flow chart of slug/film detection algorithm, with the first frame of a processed
test video as the starting input ...47
Figure 5.1 - Polarization curve and HFR for Freudenberg and Toray GDL samples. Stoich
(an/ca) 1.5/2.5, 100% RH inlet gases ...48
Figure 5.2 - Polarization curve and HFR for Freudenberg and Toray GDL samples. Stoich
(an/ca) 1.5/5, 100% RH inlet gases ...49
Figure 5.3 - Polarization curve and HFR for Freudenberg and Toray GDL samples. Stoich
(an/ca) 3/8, 100% RH inlet gases ...49
Figure 5.4 - Comparison of cathode window #2 for (a) Freudenberg and (b) Toray at
stoichiometric ratio (an/ca) 1.5/2.5 and current density 100 mA/cm2 ...51 Figure 5.5 - Comparison of cathode window #1 for (a) Freudenberg and (b) Toray at
stoichiometric ratio (an/ca) 1.5/2.5 and current density 300 mA/cm2 ...51 Figure 5.6 - Comparison of cathode window #1 for (a) Freudenberg and (b) Toray at
stoichiometric ratio (an/ca) 1.5/2.5 and current density 500 mA/cm2 ...52 Figure 5.7 - Comparison of anode window #2 for (a) Freudenberg and (b) Toray at
stoichiometric ratio (an/ca) 1.5/2.5 and current density 200 mA/cm2 ...52 Figure 5.8 - Comparison of cathode window #1 for (a) Freudenberg and (b) Toray at
stoichiometric ratio (an/ca) 1.5/5 and current density 150 mA/cm2 ...53 Figure 5.9 - Comparison of anode window #2 for (a) Freudenberg and (b) Toray at
stoichiometric ratio (an/ca) 1.5/5 and current density 100 mA/cm2 ...54 Figure 5.10 - Comparison of cathode window #1 for (a) Freudenberg and (b) Toray at
ix
Figure 5.11 - Comparison of cathode window #2 for (a) Freudenberg and (b) Toray at
stoichiometric ratio (an/ca) 3/8 and current density 100 mA/cm2 ...55 Figure 5.12 - Liquid water detection for cathode window #1 with Freudenberg GDL at
stoichiometric ratio (an/ca) 1.5/5 and current density 50 mA/cm2: (a) pre-processed image,
(b) processed image. ...56
Figure 5.13 - Liquid water detection for cathode window #2 with Freudenberg GDL at
stoichiometric ratio (an/ca) 1.5/2.5 and current density 100 mA/cm2: (a) pre-processed
image, (b) processed image ...56
Figure 5.14 - Liquid water detection for anode window #2 with Freudenberg GDL at
stoichiometric ratio (an/ca) 1.5/2.5 and current density 100 mA/cm2: (a) pre-processed
image, (b) processed image ...57
Figure 5.15 - Sequence showing capture and detection of dynamic slug movement in cathode
channel #7 of window #1 with Freudenberg GDL at stoichiometric ratio (an/ca) 1.5/2.5 and
current density 150 mA/cm2. The dotted yellow line placed at the bottom of the slug
highlights its travel ...58
Figure 5.16 - Comparison of anode and cathode water coverage ratio for Freudenberg (left)
and Toray (right) GDL samples, at stoichiometric ratio (an/ca) 1.5/2.5...59
Figure 5.17 - Comparison of anode and cathode water coverage ratio for Freudenberg (left)
and Toray (right) GDL samples, at stoichiometric ratio (an/ca) 1.5/5...60
Figure 5.18 - Comparison of anode and cathode water coverage ratio for Freudenberg (left)
and Toray (right) GDL samples, at stoichiometric ratio (an/ca) 3/8...61
Figure 5.19 – Distribution of liquid water among flow structures at stoichiometric ratio
1.5/2.5 for (a) Freudenberg anode flow field and (b) Freudenberg cathode flow field. ...64
Figure 5.20 – Distribution of liquid water among flow structures at stoichiometric ratio
1.5/2.5 for (a) Toray anode flow field and (b) Toray cathode flow field. Note different scaling
x
ii. Tables
Table 3.1 - Lens properties for dual-visualization setup ...21
Table 3.2 - GDL material properties ...23
Table 3.3 - Fuel cell parameters for optical visualization experiments ...24
Table 4.1 - Summary of data classes ...28
Table 4.2 - Metrics calculated by video processing algorithm ...44
Table 5.1 - Freudenberg GDL water coverage ratio results ...62
Table 5.2 - Toray GDL water coverage ratio results ...62
Table 5.3 - Freudenberg GDL water distribution results ...66
Table 5.4 - Toray GDL water distribution results ...66
xi
IV.
Nomenclature
Abbreviations
PEM Proton exchange membrane
GDL Gas diffusion layer
CL Catalyst layer
HFR High frequency resistance
MEA Membrane electrode assembly
PTFE Polytetrafluoroethylene
RH Relative humidity
MPL Microporous Layer
NIST National Institute of Standards and Technology
CCM Catalyst coated membrane
PFSA Perfluorosulfonic acid
OCV Open circuit voltage
SE Structuring element
GIMP GNU Image Manipulation Program
Symbols
Rate of water production
i Current density
xii
F Faraday’s Constant
Molecular weight of water (18 g/mol)
2
2-D integer space
z Set of all points in 2
A⊖B Erosion of A by B (where A and B denote sets in 2) A⊕B Dilation of A by B
Opening of A by B
Closing of A by B
α Area (defined by number of pixels)
E Connectivity of α
Ci Connected components
N Number of video frames
D Dry video
P Processed video
W Test video
1
1.
Introduction
Fuel cells continue to gain attention from automotive manufacturers as a potential alternative
to internal combustion engines. Proton exchange membrane (PEM) fuel cells are the most
favorable fuel cell technology for transportation applications due to their high power density,
rapid start-up capability, and clean operation. Water management has been identified as one
of the critical issues in the advancement of PEM fuel cells. Water is produced in PEM fuel
cells as a byproduct of the electrochemical reaction, and can also be present due to the
condensation from the humidified inlet gases. Although the presence of water is necessary in
a PEM fuel cell to maintain sufficient membrane hydration, excess accumulation of liquid
water within the cell, often referred to as flooding, can lead to mass transport losses and
significant reduction in cell performance and durability [1].
A schematic of PEM fuel cell operation is shown in Figure 1.1. The source of water and
associated two-phase flow in PEM fuel cells are the result of the following processes: first,
hydrogen and oxygen (air) are introduced to the cell through the flow field channels on the
anode and cathode sides, respectively. The gases then diffuse from the channels through the
porous gas diffusion layer (GDL) to reaction sites at the catalyst layer (CL). On the anode
side, hydrogen is oxidized to produce H+ ions which are then transported through the membrane. Only protons can pass through the membrane, and the electrons are forced to
flow around the fuel cell through an external circuit thus creating the usable electricity. After
passing through the external circuit, the electrons recombine with the H+ ions and oxygen at the cathode CL producing water. The product water is then transported back through the
GDL and into the flow field channels in liquid and/or vapor form (depending on fuel cell
2
Figure 1.1 - Schematic of PEM fuel cell components and operation. Not to scale.
The reactions that take place in the cell are as follows:
Anode:
Cathode:
Net cell reaction:
The rate of water generation in the cell, from Faraday’s Law, is expressed in Equation (1.1)
as
(1.1)
where is the rate of water production, i is the current density, Aactive is the active area, F
is Faraday’s Constant and is the molecular weight of water.
H
+H
2O
2H
2O
An
Ca
Flow Field
GDL
CL
Membrane
-3
In the case of channel/flow field flooding, excess liquid water accumulates within the flow
field channels to form water films which partially block channels, or columns of water which
span the entire channel width called slugs, which can block or hinder the flow of reactants
and their diffusion through the GDL to the catalyst layer. This can lead to a reduction in the
electrochemically active surface area, which limits the reactions that can take place and
decreases cell performance. The presence of slug flow in the gas channels is therefore
undesired. In addition, blocked or partially blocked gas channels can lead to flow
maldistribution among parallel flow field channels, and increased channel pressure drop.
Flooding can be especially prevalent at lower temperatures and lower reactant flow rates
(lower power operation), when the gases may not be able to remove the liquid water from the
channels. An accurate assessment of the total amount of liquid water present in the anode and
cathode gas channels and its flow structure is therefore crucial in assessing performance
losses induced by water accumulation in the flow field, and to the development of water
management and purge strategies.
Optical visualization using a fuel cell with transparent components is a popular technique
used to observe PEM fuel cell flow channels during operation. There are, however, limited
optical visualization studies that are able to obtain quantitative data pertaining to the amount
of liquid water accumulation in the flow field channels, or the two-phase flow structure. Of
these studies there are no automated techniques for water quantification, and the results must
be obtained through manual observation and selection, which can be tedious,
time-consuming, and is subject to inherent human errors. Manual selection may also fail to capture
the presence of dynamic liquid water in the channels. In addition, many studies use rather
arbitrary channel dimensions, which may not be representative of actual full scale fuel cell
geometry. The majority of work also tends to focus on cathode channel observation, although
flooding can be just as prevalent on the anode side.
The objective of this study was to develop a technique to automatically detect and
characterize the two-phase flow present in a transparent fuel cell during operation using
direct optical visualization and image processing. The small scale transparent cell design
used in this work emulates geometry seen in full scale PEM fuel cells. A dual-visualization
4
channels, and high-speed cameras were used to record the two-phase flow in the gas
channels. A video processing algorithm was developed in order to automatically detect static
and dynamic liquid water in the fuel cell channels and yield information pertaining to its
quantity and flow structure. This technique can be used to obtain data for model validation
purposes, and can also be used towards the optimization of cell operational parameters and
material sets for water management. The simultaneous anode and cathode visualization
5
2.
Literature Review
Water management has recently emerged in the literature as a key research area in the
development of proton exchange membrane fuel cells for automotive applications. Liquid
water comes from two processes in a proton exchange membrane fuel cell – the oxygen
reduction reaction that takes place on the cathode electrode, and condensation of water from
the humidified fuel streams. The presence of water in a PEM fuel cell is necessary to sustain
membrane hydration and ionic conductivity, but excess water accumulation can lead to
flooding of the cell and a reduction in performance and durability [1-8]. Flooding can
severely hinder the flow of reactants and block reactant sites thus limiting cell performance,
and it can also cause an uneven distribution of reactants and thus non-uniformity in current
and temperature distributions within the cell and promote material degradation. In addition,
excess water accumulation prior to cell shut-down can require extended purge sequences [5].
The major types of PEM fuel cell flooding that have been identified are catalyst layer/gas
diffusion flooding, and flow field/channel flooding. In catalyst layer/GDL flooding an
accumulation of liquid water within these layers blocks pores and reduces the number of
active reaction sites. In flow field/channel flooding, two-phase flow within the channels can
hinder the flow of reactants and their diffusion through the GDL, limiting cell performance
due to mass transport losses and a reduction of the electrochemically active surface area.
Typically the cathode side of the cell is studied for water management because of its role in
water production, but the anode side can also be prone to flooding [5, 6, 9-12].
Although water production does not take place on the anode side by the same means as it
does on the cathode side, it has been shown that liquid water is present on the anode side as a
result of two processes – transport from the cathode side of the cell, and humidification of the
hydrogen gas stream [9, 11]. Water transports from the cathode side to the anode side as a
result of back diffusion, which is a concentration gradient driven flux through the membrane.
Anode flooding can be detrimental to the operation of PEM fuel cells because once water
accumulates on the anode side it is not as easily removed due to the lower hydrogen flow
rates, and it can also lead to carbon corrosion in the cathode catalyst layer due to localized
6
Two-phase flow in the gas channels is a critical aspect of fuel cell water management [1, 3,
4]. The presence of excess liquid water in the channels can have detrimental effects such as:
restricted access to reaction sites caused by a liquid film on the GDL surface, starvation of
reaction sites due to partial or complete blockage of the gas channel, maldistribution of
reactant flow and subsequent non-uniform current distribution, and an increase in channel
pressure drop as a result of liquid water blockage [1].
In order to better understand flooding in the channels and its effect on fuel cell performance,
a variety of diagnostic tools have been employed to detect as well as characterize the liquid
water within a fuel cell including: cell voltage and high frequency resistance (HFR)
measurements [10, 13], pressure drop measurements [8, 13-16], and visualization [5-26]. Of
these techniques, visualization has the advantage of obtaining information regarding the
location and spatial distribution of liquid water in the anode and cathode flow fields, GDL,
and membrane electrode assembly (MEA), as well as water transport dynamics and
two-phase flow structure. Two of the most prominent methods of visualization are neutron
radiography and direct optical visualization in the visible range. Neutron radiography is a
non-invasive technique used to visualize and quantify the presence of liquid water in flow
field channels, within the gas diffusion layer and MEA, and under the land area [5, 6, 19, 20,
22]. In the neutron radiography technique, a beam passes from a neutron source through an
operating fuel cell, and the attenuation of the beam reveals the two-dimensional measurement
of water thickness. The 2-D nature of neutron radiography makes distinguishing cathode
water from anode water rather ambiguous, as it is difficult to determine which layer of the
cell the water is residing in (anode flow fields, MEA, cathode flow fields, etc.) It is also
limited by its current spatial and temporal resolutions (approximately 25 µm and 5.4 s,
respectively [27]) which makes it unable to resolve water transport dynamics, although
efforts are underway to improve resolution. Neutron radiography has severe limitations in
visualizing small, fast-moving water quantities; in addition, calibration errors can lead to less
accurate water measurements in operating cells [6]. The technique is further limited by its
high cost and limited facilities [28]. Optical visualization, which requires the development of
transparent fuel cell components to view the internal channels, is a lower cost alternative that
offers the advantage of high spatial and temporal resolutions which enables the capture of
7
be used to enhance cell design and material selection, as well as give insight to optimal
conditions for purge and operation, and therefore makes optical visualization an ideal
candidate to study two-phase flow within the gas channels and at the GDL surface [6-9, 11,
13-18, 21, 23-26].
Tuber et al. [23] was the first group to utilize direct optical visualization to study the
accumulation of liquid water in cathode channels at low temperatures. They developed a
transparent fuel cell consisting of two air channels separated by a stainless steel rib. The
channel dimensions were 1.5 mm width, 1.0 mm depth, and 50 mm length. They performed
constant voltage tests at low temperature (30 °C) and ambient pressures and observed the
liquid water in the cathode channels. Observations were recorded using a digital camera.
The effect of the liquid water on cell performance was investigated by monitoring the drop in
current density due to the accumulation of liquid water in the air channels. In addition, the
effect of GDL hydrophobicity was studied. It was determined that a change in the surface
properties of the GDL in either direction (more hydrophilic or more hydrophobic) resulted in
a substantial change in water accumulation tendencies in the channels. They concluded that
in the case of low temperature and cold-start conditions, hydrophilic GDLs are more
beneficial for fuel cell performance due to more uniform distribution of water content in the
MEA.
In 2004, Hakenjos et al. [17] developed a cell to simultaneously measure current and
temperature distributions while observing flow field flooding. The anode flow field was
segmented to measure the cell current distribution, and an infrared (and optical) transparent
window was used on the cathode side. A CCD camera was used to record observations of
liquid water on the cathode. The cathode flow field had channels of 1 mm wide by 2 mm
deep with 1 mm spacing in between. Toray GDL with a thickness of 360 µm was used in
their tests and a constant voltage of 200 mV was sustained for 1 hour prior to measurements.
Dry hydrogen was supplied to the cell at 100 sccm, and humidified air was supplied to the
cathode ranging from 250 to 750 sccm. In general, the cell current rose with increasing air
flow rate, and temperature increased as well due to the higher reaction enthalpy. The authors
found that condensed water lead to lower current density due to blockage of gas flow and
8
flooded sections compared to non-flooded regions. This was attributed to the enthalpy of
water condensing causing an increase in the temperature.
Also in 2004, a transparent fuel cell was developed by Yang et al. [26] that was suitable for
testing under higher temperatures (70 °C), higher current densities, and fully humidified inlet
gas streams. The test section comprised of two clear polycarbonate plates sandwiching gold
plated stainless steel current collectors/flow fields and the MEA. The anode and cathode
flow fields were identical and consisted of seven straight parallel channels with geometry of
1 mm x 1 mm by 100 mm. The active area for the cell was 14 cm2. The visualization studies were conducted on the cathode side of the cell and a Sony digital camcorder and 24x
microscopy lens were used for recording observations. The emergence of water droplets
from preferential pores on the GDL surface was observed during their testing. Other
observations included water film on the channel walls, and a water bridge across the width of
the channel that blocked gas flow. This caused a notable decline in the average current
density, indicating the negative effect the blockage of gas flow channels can have on cell
performance. They concluded that under practical stoichiometric ratios, the two-phase flow
in the cathode channels of their cell was in the form of annular film flow.
Zhang et al. [7] used a transparent fuel cell to characterize liquid water removal in a PEM
fuel cell from both the GDL surface and the gas flow channels. The cell was 14 cm2 with 100 mm long x 1 mm wide x 0.5 mm deep flow channels. A polycarbonate window was
used to have visual access into the cell and images were recorded using a 3-CCD camera.
Toray 090 GDL was used with 20% wet-proofing and the cell was operated at 80 °C with
fully humidified gas streams. The main modes of water removal were determined by this
group to be: mist flow (tiny water droplets suspended in the gas stream) at high air flow
velocities, corner flow (along interior channel corners due to capillary wetting), annular film
flow (water film along channel sidewall), and slug flow (water band clogging the gas
channel) at low velocities. Corner flow was found to be the primary liquid water removal
mechanism and it was concluded that steady corner flow is an efficient way to remove water
from the channel. This group also studied droplet formation and on the GDL and used image
processing tools to determine the fractional coverage of liquid droplets on the GDL surface.
9
flow (high velocity) or capillary interactions with the channel walls. The forces acting on a
water droplet on the GDL surface were modeled, and they determined the droplet detachment
diameter to be an important design parameter. A channel size smaller than the droplet
detachment diameter resulted in the water contacting the channel walls before it detaches
from the GDL surface, which could promote liquid water buildup in the channels.
In 2007 Ge and Wang [9] were the first to use a transparent fuel cell to investigate liquid
water formation and transport on the anode side of a PEM fuel cell. The cell design was the
same used in previous experiments by Yang et al. [26]. The GDL used on the anode side was
Toray 060 with microporous layer (MPL), and treated (polytetrafluoroethylene - PTFE) and
untreated samples were used. Both a straight channel flow field (14 cm2) and four-pass serpentine flow field were used (5 cm2). An Olympus DP 70 digital camera with a Navitar zoom lens was used. Experiments were performed in a parallel channel flow field at three
different current densities – 0.2, 0.5, and 0.8 A/cm2 – and inlet gas relative humidity (RH) of 66%. At the lowest current density, condensation and film were present in the anode channel
but significant flooding was not observed. At the higher current densities, no film or
condensation was observed in the channel and the authors concluded that anode flooding was
strongly dependent on current density. At 0.2 A/cm2, hydrogen stoich ratios of 1.5, 2.0, and 3.0 were tested and it was determined that hydrogen flow rates do not have a significant
effect on the formation and transport of water in the anode. Ge and Wang further measured
the anode pressure gradient and saw that a sharp increase in pressure gradient correlated to
liquid water blocking several of the channels. Using the anode pressure gradient they were
able to confirm that channel clogging can be mitigated by using a hydrophilic GDL on the
anode side. Additional tests with a four-pass serpentine cell verified that anode side flooding
can be diagnosed using the anode pressure gradient. Since no water droplets were found on
the anode GDL in any of the tests it was determined that, in contrast to the cathode water
production mechanism, water vapor condensation is the source for liquid water formation on
the anode – either from the cathode side via membrane transport or from the hydrogen gas
stream as consumption of hydrogen leads to supersaturation in the anode gas.
Optical visualization experiments were conducted by Spernjak et al. [11] to investigate
10
GDLs. A transparent single channel (1 mm) serpentine cell was tested at high temperature
and high water production rates with different commercially available GDLs – Toray 060
carbon paper, Sigracet wet-proofed SGL31BA (without MPL), SGL31BC and SGL35BC
(with MPL), and a Ballard woven cloth GDL (AvCarbTM 1071HCB). Liquid water was
found to originate in the cathode either by being wicked away through GDL pores into the
channel, from condensation on the channel walls, or from bursts of liquid water from the fuel
cell test stand. They also observed mechanisms of water transport within the flow field and
found that droplets were either removed from the GDL surface via the gas stream, consumed
by other moving droplets, film, or slugs from upstream, or contacted the channel walls and
moved through the channel as film or slug flow. At the U-turns and corners of the serpentine
channel water accumulation was more prevalent and resided for longer periods of time. In
addition, because of the dynamic nature of water coverage and removal along the channels,
they found that the active area of the cell will change as reactant sites are blocked by
flooding. The effect of GDL materials and their water management properties revealed that
with the wet-proofed SGL GDLs, discreet droplets emerged over the entire visible surface
area. This was in contrast to the untreated GDLs where the water typically moved along the
sidewall in the form of film or slugs. Toray GDL had lower performance and hardly any
visible water at the same water production rates, and the authors concluded that the untreated
GDL cannot efficiently push the water to the membrane through the catalyst layer or eject
water into the gas channels. This resulted in low membrane hydration, blockage of pores and
hindrance of gas flow. The anode side of the cell was visualized to study effect of the
microporous layer. Results revealed that the MPL had an effect on water dynamics and lead
to an increase of water content present on the anode side. This was attributed to the MPL
creating a pressure barrier at the cathode catalyst layer which causes the water to be pushed
to the anode side. The anode water was determined to be caused by water transport from the
cathode to anode across the membrane and by the humidified gas stream.
Liu et al. [8, 15, 18] performed several studies to characterize flooding and pressure drop in
the cathode channels of a PEM fuel cell. In 2007 this group investigated the relationship
between water flooding and pressure drop in a PEM fuel cell by studying the effect of cell
temperature, current density, and operating time on the total pressure drop for the anode and
11
0.8 mm wide by 24 mm long by 1 mm deep. The cell was tested at 35 °C and 70 °C and the
two-phase flow in the anode and cathode flow fields was also observed. Their results
showed that the cell performance was reduced due to the presence of liquid water in the
channels because of mass transport limitations. The total pressure drop of the cell was found
to primarily depend on the amount of resistance to gas flow caused by water in the channels.
The total pressure drop was found to increase with increasing current density, but decrease
with an increasing cell temperature. Overall, cathode flow field pressure drop was higher
than anode flow field pressure drop. A ‘rate of flooding’ parameter (Rf, %) was introduced
in an effort to quantify flooding as the ratio of the length of water columns in the channels to
the length of the channels.
In 2008 the same group also studied the effect of cell temperature, cathode flow rate, and
operating time on the two-phase flow patterns and liquid in the cell [8]. They observed that
increasing the cell temperature caused a decrease in condensation, and an increase in
electrochemical reaction kinetics, which led to better fuel cell performance. However, too
much of a temperature increase can have an opposite effect by drying out the membrane and
reducing performance. An increase in the flow rate on the cathode side corresponded to an
increase in cell performance by aiding in the removal of liquid water from the flow field, but
a threshold condition was reached at a stoich ratio of 42.9 when membrane dehydration
caused a decrease in performance. They clearly observed slug flow at low gas flow rates
and annular flow at higher flow rates, and a transition pattern between the two was also
observed at intermediate air flow rate. Blockage of channels by liquid water columns lead to
poor performance due to mass transfer losses.
Owejan et al. [5] highlighted the need for better understanding of two-phase transport under
low temperature and low power conditions. U.S. Department of Energy performance targets
were used in their design of a 50 cm2 fuel cell for neutron radiography testing. The resulting 22 cathode channels were 0.7 mm wide by 0.4 mm deep channels and 0.5 mm lands, and the
11 anode channels were scaled to 1.5 mm lands and identical channel geometry. The channel
length was 183 mm. The flow fields were designed to have a wavy pattern in order to
mitigate compression misalignments. They performed a number of steady state tests at NIST
12
showed that lower operating temperatures contained higher amounts of liquid water,
especially at lower current densities. This is important because as the authors point out, a
fully dynamic automotive fuel cell mostly operates at 20% of its rated power, and many trips
aren’t long enough in duration to bring the fuel cell up to its designed operating temperature.
They also identified areas that may present problems during start-up in freezing conditions,
including the anode channels and the channel-to-header transitions at the exits. The transport
processes that occur in the cell during a shut-down purge sequence were also investigated.
Two main water removal regimes were identified when the cathode was purged with air: first
the anode channel water was cleared rapidly due to a system pressure release, and then the
water residing in the gas diffusion layers was evaporated slowly. These results showed that at
low shut down temperatures, long cathode air purges may be necessary to ready the cell for
start-up in freezing conditions.
In 2009 Spernjak et al. [6] introduced a novel visualization technique combining neutron
radiography and direct optical visualization in order to quantify the water in a PEM fuel cell
during operation. The goal of this study was to provide a technique that allows one to obtain
and separate MEA and flow field water content. It also attempts to differentiate anode and
cathode channel water transport. A 25 cm2 fuel cell [11] was observed simultaneously by neutron radiography and optical visualization through the use of a silver-coated quartz
mirror. Three alternate versions of the cell were tested – a non-transparent cell, a cathode
transparent cell, and anode transparent cell. A Nafion membrane was tested in two cases –
with Toray 060 GDL on both sides of the cell, and with SGL35BC and SGL31BA GDL on
the cathode and anode respectively. For different test cases the neutron images were overlaid
onto the optical image. Information relating the water in the channels to the neutron image
was found by comparing the dry optical image and wet optical image to the overlay. When
observing the cathode side, some areas of high neutron attenuation could not be correlated to
visible water present in the cathode flow field. Using this comparison it was possible to
deduce that the water remaining is located in the MEA and anode channels. The authors
speculate that with further image processing and assumptions it may be possible to determine
the upper and lower bounds for the water content in these regions. With no anode water
present it was possible to distinguish and quantify the cathode water from the MEA water,
13
components. This group’s use of concurrent optical and neutron radiography images gave
more complete information about cell water distribution, and helped to make improved
correlations between cell performance and water dynamics.
In 2009 Hussaini and Wang [13] used the same transparent cell design outlined by Yang et
al. [5] to perform in situ visualization of cathode flooding. The cell was operated with a
Teledyne test station and an Olympus video microscope was used to record observations. A
200 μm thick Toray GDL was used for testing at a temperature of 80 °C, relative humidities
of 26%, 42%, and 66%, current densities of 0.2, 0.5, and 0.8 A/cm2, and flow stoichiometries of 2, 2.5, 3, 3.5 and 4. From their visualization they were able to observe cathode channel
flooding to be concentrated towards the exit region. In addition, due to low gas flow rates,
the level of flooding was higher at low current densities and stoichiometries. The main flow
patterns they observed in the channels were single-phase, droplets, film, and mist flow. This
information was used to construct a flow pattern map depicting the flow transition regions as
a function of superficial air and liquid water velocity, which can be useful for both cell
design and determining optimal operation conditions to minimize flooding. Two other
parameters were introduced by this group to aid in the understanding of flooding in the
channels – the two-phase pressure drop coefficient and wetted area ratio. The two-phase
pressure drop coefficient was defined as the measured pressure drop during cell operation
divided by the single phase pressure drop, and analyzing this parameter showed that flooding
in the channels can cause as much as a four-fold increase in total pressure drop. In order to
better quantify the amount of liquid water present in the channels, the wetted area ratio was
developed. This is the ratio between the total area within the channels where two-phase flow
is consistently present and the total area. This was done by manually selecting the area of the
channels that was perceived to be occupied with two phase flow, a technique that lends itself
to inherent uncertainty and error. The wetted area ratio was shown to be relatively constant
for a given operating condition even though the distribution was varied. They noted that this
parameter could be more refined by developing image processing techniques to more
accurately assess the wetted channel area without bias caused by manual selection.
Yamauchi et al. [29] simultaneously observed the anode and cathode of a transparent cell
14
cathode flow orientations and their effect on water management. A 3-serpentine channel was
used for the flow fields. A condensation rate parameter was used for quantifying the water in
the flow fields, and was defined as the ratio of area in the channels where condensate forms
to the total area. The authors observed anode flooding at low humidities due to water
transport across the membrane. It was found that asymmetrical flow orientations (e.g. anode
top/cathode bottom, anode bottom/cathode top) promoted water transport between the anode
and the cathode.
In 2010, Spernjak et al. [30] expanded their simultaneous neutron and optical imaging work
[6] and compared the water content and dynamics of three different flow field types: parallel,
single-serpentine, and interdigitated. Anode channel flooding was observed in all tests, and
water was removed from the anode at a much slower rate due to the lower flow rates. Anode
flooding was contributed primarily to water transport across the membrane as a result of the
microporous layer present on the cathode side. In addition, liquid water was observed in the
anode channels sooner than the cathode channels. The parallel flow field was found to
exhibit the worst performance, and possessed the highest water content. The main method for
water removal in this type of flow field was determined to be short slugs being purged from
the cell periodically as they interacted with other water droplets and the channel walls.
Flooding was observed on both the anode and cathode at higher current densities. The
single-serpentine flow field maintained the lowest water content during operation, and
exhibited the highest pressure drop. The interdigitated contained much higher water content
than the single-serpentine, but maintained comparable performance. The water removal
mechanisms and distribution in this type of flow field were found to be similar to the parallel
channel flow field.
2.1. Summary of Research Needs
It can be seen from the literature that direct optical visualization is a powerful tool that can
enhance the fundamental understanding of two-phase flow in PEM fuel cell gas channels.
One key area lacking in the literature is the ability to generate quantitative data pertaining to
the liquid water observed in the fuel cell channels without relying on manual selection of
wetted regions [13, 29], which inherently lends itself to error and bias and may not capture
15
the flow structures of the liquid water in the channels. Currently in the literature there has
been a minimal amount of visualization studies aimed at better understanding anode flooding
dynamics [6, 9, 11], and studies performing optical visualization of both the anode and
cathode simultaneously are extremely limited [29]. In addition, most studies (with the
exception of [5]) use rather arbitrary channel and flow field geometry for small scale
visualization testing, with little design influence from actual full scale fuel cell hardware.
Relatively low temperature/power conditions, which are pertinent to realistic automotive fuel
cell drive cycles [5], can be especially prone to flooding and further insight into liquid water
accumulation under these conditions would be beneficial.
2.2. Scope of Work
The goal of this research is to develop a technique to characterize and quantify the two-phase
flow in the gas channels of a PEM fuel cell using optical visualization. The following
objectives are established in order to accomplish this goal and address the current research
needs:
Objective 1 – Small Scale Transparent Fuel Cell with Realistic Geometry
Implement a small scale (50 cm2) transparent fuel cell that represents actual full scale automotive PEM fuel cell hardware for in situ optical visualization experiments.
Objective 2 – Simultaneous Anode and Cathode Flow Field Visualization
Develop a dual-visualization system that allows for concurrent viewing and recording of
two-phase flow activity in the anode and cathode flow field channels using high-speed cameras.
Objective 3 – Automatic Detection and Quantification of Static and Dynamic Liquid
Water in Fuel Cell Gas Channels
Develop a video processing algorithm in MATLAB® that can automatically detect liquid
water in the flow field channels from recorded test videos and yield quantification
information.
Objective 4 – Automatic Differentiation of Two-Phase Flow Structure
Develop a video processing algorithm in MATLAB that can automatically determine the
flow structure (e.g. slug, film) of detected liquid water in the channels and yield information
16
3.
Experimental Methodology
3.1. Overview of Experimental Work
In this work, a transparent PEM fuel cell with visual access to both the anode and cathode
sides was developed for use with optical visualization techniques. The geometry of the cell
was designed to represent actual automotive fuel cell hardware. A high speed camera system
was used to simultaneously observe the two-phase flow in the anode and cathode gas
channels of the fuel cell during operation. This in situ experimentation allowed for
information pertaining to liquid water quantification, distribution, transport dynamics, and
two-phase flow structure to be extracted. Additional performance metrics such as
polarization curve and HFR measurements were also recorded. This method was used to
compare two GDL samples from a water management perspective. Tests were performed at
35°C for a range of current densities and stoichiometric ratios to elucidate two-phase flow
dynamics at lower temperature/low power conditions, when excess liquid water in the cell
can be especially prevalent.
3.2. Experimental Setup
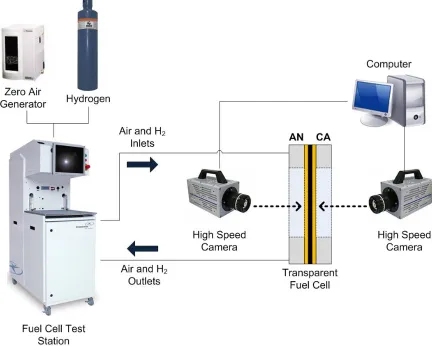
3.2.1. System Overview
The fuel cell testing was performed using a Hydrogenics G40 fuel cell test station operated
under constant current mode. The fuel cell was mounted in a vertical down position with
co-flow orientation. Air and hydrogen were supplied to the cell through the test station from a
Parker Balston Zero Air Generator and bottled hydrogen, respectively. The water for the gas
humidification system was supplied from a Siemens water de-ionization system. The inlet
gas temperatures, humidities, and flow rates were regulated by the Hydrogenics test station,
which also monitors cell voltage and membrane hydration (HFR). The temperature of the
fuel cell was controlled using Watlow flexible silicone heaters attached to the cell endplates.
The inlet gas tubes were heated with OMEGALUX® rope heaters to prevent condensation
and maintain a constant gas temperature from the test station to the cell inlets. Both the cell
heaters and rope heaters were controlled using Omega CN1504-TC temperature controllers.
The internal cell temperature was monitored using four 0.05 mm thick Omega 88309K thin
leaf-type thermocouples embedded within the cell. The internal cell temperature
17
cDAQ-9172) and a LabVIEW VI. A Velmex 3-axis motorized stage mounts two Photron
high-speed cameras, each facing one side of the transparent fuel cell. The fuel cell assembly
and visualization equipment were mounted to a Newport ST-UT2 vibration isolation table. A
[image:30.612.101.533.170.516.2]schematic of the experimental setup is shown in Figure 3.1.
Figure 3.1 - Transparent fuel cell test system.
3.2.2. Transparent PEM Fuel Cell Design
The design of this 50 cm2 transparent fuel cell used in this work has previously been described in literature [5, 31] and the details are summarized in this section. The test section
is comprised of anode and cathode flow fields sandwiching the gas diffusion layers (GDLs)
and catalyst coated membrane (CCM). The flow fields of this cell also function as the current
collectors and are formed by 0.4 mm thick gold plated copper plates. Copper was chosen
because of its high electrical conductivity and receptiveness to gold plating, which has been
18
machined through the copper plates resulting in a channel depth of 0.4 mm. Lexan®
(polycarbonate) support pieces provide optical access to the flow field channels and form the
channel bottoms (surface opposite of the GDL) when the test section is assembled. The
channel geometries and dimensions were designed by Owejan et al. [5] in order to meet
Department of Energy targets for volumetric power density. The rectangular cathode
channels are 183 mm long and 0.7 mm wide with 0.5 mm wide lands between adjacent
channels. The channel and land width dimensions were based on values from the literature
that were found to be optimal for cell performance. The anode channel geometry is identical
to the cathode except that the land width is scaled three times larger in order to account for
the higher binary diffusion coefficient of hydrogen, resulting in 1.5 mm lands. The anode
and cathode channel geometries are shown in Figure 3.2.
Figure 3.2 – Anode and cathode channel geometry and dimensions (not to scale).
An active area of 50 cm2 results in flow fields comprised of 22 cathode channels and 11 anode channels. The channel depth was minimized to preserve volumetric power density
target constraints while avoiding the negative effects of GDL intrusion/inflection into the
channel under compression, which are exacerbated as the channel depth decreases. The
channel length of 183 mm was extracted from active area calculations to meet fuel cell power
targets. In order to avoid misalignment effects and mechanical shearing of the GDL
associated with straight channels, a wavy channel pattern was implemented, as shown in
19
Figure 3.3 – Wavy channels on anode flow field/current collector.
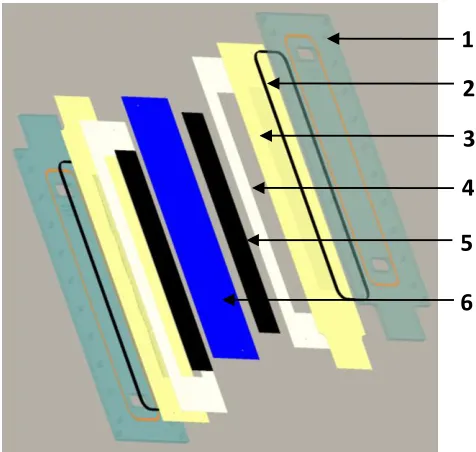
The assembled test section contains a CCM that is sandwiched by gas diffusion layers, anode
and cathode flow fields, and the Lexan support pieces. The MEA consists of the anode and
cathode GDLs and the CCM. PTFE and rubber o-ring gaskets are placed appropriately
between components. An exploded view of the test section is shown in Figure 3.4.
Figure 3.4 - Exploded view of test section assembly: (1) Lexan support piece, (2) rubber
o-ring gasket, (3) current collector/flow fields, (4) PTFE gasket, (5) GDL (6) CCM.
The flow fields are carefully assembled to ensure channel width and uniformity, and dowel
pins are used to ensure the proper alignment of each cell component during assembly. The
test section is housed on both sides by machined 6061 aluminum blocks which are used to
compress the cell and also contain the inlet and outlet manifolds for the fuel streams. The
aluminum end pieces contain a series of windows (machined-through cavities) for viewing
2 1
3
4
5
20
access through the transparent Lexan pieces. Rubber o-ring gaskets are used to seal the area
between the test section and aluminum blocks. The entire cell assembly is compressed to
200 psi. Even compression distribution within the cell was verified prior to testing by
replacing the soft goods with a pressure sensitive film. The fully assembled cell is shown in
Figure 3.5.
Figure 3.5 – Assembled transparent fuel cell.
3.2.3. Dual-Visualization Setup
A dual-visualization setup was developed in order to perform simultaneous optical
visualization of the anode and cathode sides of the fuel cell during operation. The setup
consists of two high speed video cameras – a Photron Ultima APX (anode side) and Photron
Fastcam 1024 PCI (cathode side). The Ultima APX has a full 1024x1024 megapixel
resolution for a frame rate range of 60-2,000 fps, and the Fastcam 1024 PCI has full
1024x1024 for 60-1,000 fps. A Sigma Macro 105mm F2.8 EX DG lens is attached to the
Ultima APX and used for viewing the anode side of the cell, and a Nikon 105 mm AF Micro
Nikkor lens is used on the Fastcam 1024 to visualize the cathode. The lenses share nearly
identical specifications, as shown in Table 3.1, which allows for spatially comparable images
21
Table 3.1 - Lens properties for dual-visualization setup.
Edmund MI-150 fiber optic illuminators provide lighting to the cell viewing windows. A
single aluminum bracket mounts both cameras to a Velmex motorized 3-axis stage which has
a positional repeatability of 5 microns. The design of the mounting bracket allows the
cameras to vertically traverse the length of the flow field channels while maintaining
simultaneous view of the same window on respective sides of the cell. The cathode side
camera is connected to the mounting bracket with a manually controlled Velmex linear slide
in order to enable additional flexibility with focusing the cameras or for use with alternate
lenses with different focal ranges. The dual-visualization setup is shown in Figure 3.6.
The motorized stage is moved by stepper motors which are controlled through MATLAB. A
MATLAB code was developed to store the vertical position of each window (1-4) from a
zero reference point (absolute bottom of the vertical stage) and mathematically relate this
position to each of the other windows. This ensures that the cameras will automatically return
to the same position for each specified window regardless of their previous location. When
the code is run, the cameras automatically move to the zero reference point, and the user is
prompted to enter a window number. After a window number is entered the cameras move to
that position and the user is again prompted to enter a window number, and the sequence
repeats until the code is terminated by the user.
Lens Property Sigma Macro 105 mm F2.8 EX DG (Anode)
Nikon 105 mm AF Micro Nikkor (Cathode)
Focal Length 105 mm 105 mm
f/Stop Range 2.8 - 32 2.8 - 32
Minimum Focus Distance 0.310 m 0.314 m
Magnification 1:1 1:1
22
Figure 3.6 - Experimental setup: (a) transparent fuel cell, (b) Photron Ultima APX
camera (anode), (c) Photron Fastcam 1024 camera (cathode), (d) motorized stage, (e)
fuel cell test station, (f) temperature controllers
3.2.4. Material Properties of Cell Components
Two different commercially available carbon paper gas diffusion layer samples were used for
this testing: Freudenberg H2315 and Toray TGP-H-060, both coated with an in-house
microporous layer (MPL) by General Motors. The properties of the two GDL samples are
summarized in Table 3.2. Confocal laser scanning microscope images of the GDL samples
are shown in Figure 3.7. The W.L. Gore Inc. catalyst coated membrane used in these
experiments was fabricated on an 18 µm thick perfluorosulfonic acid (PFSA) membrane and
has a platinum loading of 0.2/0.3 (an/ca) mg Pt/cm2. The contact angles of the gold plated current collectors and Lexan windows are approximately 85° and 60°, respectively.
a
b
c
d
e
23
Table 3.2 - GDL material properties.
(a) (b)
Figure 3.7 - Confocal laser scanning microscope images of (a) Freudenberg H2315 GDL
and (b) Toray TGP-H-060 GDL.
3.3. Experimental Procedure
3.3.1. Fuel Cell Operating Conditions
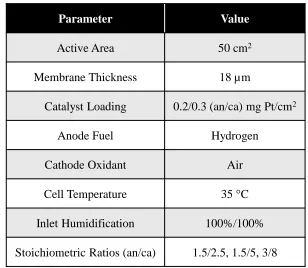
The experiments described in this section were performed with a cell temperature of 35 °C
and fully humidified inlet gases (100 %RH). As indicated by Owejan et al. [5], conditions of
low temperature, low power and low stoichiometric ratio are especially susceptible to an
accumulation of liquid water within the flow field channels and GDL, and can represent a
considerable portion of the cell’s operational lifetime. Therefore, an analysis of two-phase
flow occurring in the gas channels under these operating conditions can provide valuable Property Freudenberg H2315 Toray TGP-H-060
Type Air-laid hydro-entangled carbon fiber paper
Wet-laid carbon fiber paper
Thickness* (μm) 210 190
Contact Angle ( )
153 150
MPL Coating** Yes Yes
24
insight towards water mitigation strategies at these inevitable operating conditions. A
[image:37.612.159.467.141.409.2]summary of the experimental parameters are shown in Table 3.3.
Table 3.3 - Fuel cell parameters for optical visualization experiments.
3.3.2. Fuel Cell Testing Procedure
Prior to running a test, dry reference videos of each viewing window were recorded. The fuel
cell was then subjected to conditioning with fully humidified gases and operation at ~0.60 V.
After the cell was conditioned, the load was removed from the cell so it could stabilize at
open circuit voltage (OCV). After the cell voltage stabilized it was kept at OCV for 10
minutes to allow steady state to be reached. A point was then added to the polarization curve
and the load was increased. For each test, current density was increased in increments of 50
mA/cm2 from 50 mA/cm2 to 400 mA/cm2, and in increments of 100 mA/cm2 for each additional test point until cell failure. At each load point, prior to recording any data, the cell
operated for 10 minutes in order to achieve steady state voltage and water production (an
additional 5 minutes was added for lower current densities if steady state water had not been
reached, as determined by visual observation). Data was recorded starting with the fourth
(top) window and moving downwards to the first (bottom) window. This was due to the
increased water production along the length of the cell as the reactant gases are consumed,
Parameter Value
Active Area 50 cm2
Membrane Thickness 18 µm
Catalyst Loading 0.2/0.3 (an/ca) mg Pt/cm2
Anode Fuel Hydrogen
Cathode Oxidant Air
Cell Temperature 35 C
Inlet Humidification 100%/100%
25
thus the windows closer to the cell inlets reach steady state water production more rapidly.
For each window, simultaneous anode and cathode videos were recorded. In addition to
videos, visual observations of two-phase flow patterns present in the windows were manually
recorded. Once data and videos had been recorded for each window, a point was added to the
polarization curve, an HFR reading was taken, and the load to the cell was incremented.
3.3.3. Data Acquisition and Processing
In order to fully characterize the cell during operation, polarization curves were recorded for
cell performance and HFR measurements were recorded for the membrane hydration state.
The polarization curves were recorded using the Hydrogenics test station, and the cell voltage
at each current density was plotted using a built in graphical function and monitored during
operation. After each test, the data was saved and exported so it could be plotted externally
from the test station. HFR values were also taken from the test station by applying a ripple
current of 10 amps at operating conditions where the current density was 100 mA/cm2 or higher, and recording the associated resistance at steady state.
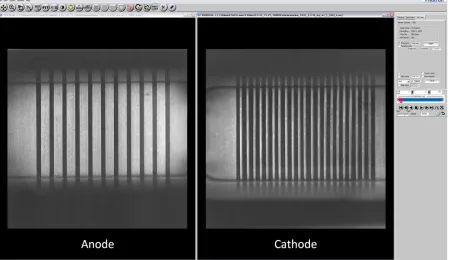
3.3.4. Video Recording Procedure
Videos of two-phase flow in the anode and cathode gas channels were recorded using
Photron FASTCAM Viewer version 3.2. This software allows for two high speed cameras to
be controlled and viewed simultaneously, as shown in Figure 3.8 with the anode facing
26
Figure 3.8 – Photron Fastcam Software used for simultaneous visualization of anode
(left) and cathode (right) flow channels.
The videos were recorded at a frame rate of 60 frames per second and a shutter speed of 1/60
s. The trigger was set to center mode which records the content directly before and after
when the trigger is input. This mitigated any delays between visual observation and
triggering of the video recording when dynamic two-phase flow was present. For each
operating condition, the cell was allowed to reach steady state as described in Section 3.3.2.,
with videos of each window recorded starting with the fourth (top) window and incrementing
down to the first (bottom) window. The window closest to the inlet manifold was not
observed due to visual interference from individual channel pressure tubing.
Each window was observed and videos were recorded when any two-phase flow events were
taking place, such as dynamic film and slug transport in the channels, in order to capture
representative maximum water content present at steady state operation at each condition. In
many cases, multiple videos were recorded of the same window in order to obtain an average
steady state maximum water level. If no significant dynamic two-phase events were
occurring, or if there was not a significant amount of two-phase flow present, a single video
27
4.
Digital Video Processing Methodology
4.1. Overview
In order to obtain information about the liquid water present in the flow field channels during
cell operation, a video processing algorithm was developed. Video processing is a powerful
tool that can be used to extract information from a sequence of images. The goal of the
developed algorithm was to automatically detect and isolate dynamic and static liquid water
in the fuel cell channels and quantify it as a ratio of the liquid water area in the channels to
the total flow field channel area. The video processing algorithm was developed and written
in MATLAB, and utilized functions from the Image Processing Toolbox™. Each video was
processed on a frame-by-frame basis, with the processed frames compiled back together in
order to form a final processed video. Relevant quantification data was automatically
extracted and saved. The algorithm utilized arithmetic operators and image segmentation
techniques in combination with morphological processing to reveal key information about
liquid water within the operating fuel cell. An additional algorithm was developed to
automatically distinguish between the different flow structures present in the channels, and
provide information about the distribution of liquid water among the flow structures. <