R E S E A R C H A R T I C L E
Open Access
Patients
’
level of satisfaction on quality of health
care at Mwananyamala hospital in Dar es Salaam,
Tanzania
Kudra Khamis
1and Bernard Njau
1,2*Abstract
Background:Enhancing quality of health care delivered in public health facilities in developing countries is a key prerequisite to increase utilization and sustainability of health care services in the population. The aim of the study was to determine patients’level of satisfaction on the quality of health care delivered at the out-patient department (OPD) in Mwananyamala hospital in Dar es Salaam, Tanzania.
Methods:A cross-sectional study design was conducted from April to May, 2012. A systematic sampling method was employed to select 422 study subjects. A pre-tested SERVQUAL questionnaire was used to collect data and one-sample t-test was employed to identify patients’level of satisfaction and principal component analysis to identify key items that measure quality of care.
Results:Patients’level of satisfaction mean gap score was (−2.88 ± 3.1) indicating overall dissatisfaction with the quality of care. The level of dissatisfaction in the five service dimensions were as follows: assurance (−0.47), reliability (−0.49), tangible (−0.52), empathy (−0.55), and responsiveness (−0.72).
Conclusion:Patients attending OPD at Mwananyamala hospital demonstrates an overall dissatisfaction on quality of care. Hospital management should focus on: improvement on communication skills among OPD staff in showing compassion, politeness and active listening, ensure availability of essential drugs, and improvement on clinicians’ prescription skills.
Keywords:Patient satisfaction, Quality of care, Donabedian model, Tanzania
Background
Quality of health care is defined as a degree of perform-ance in relation to a defined standard of interventions known to be safe and have the capacity to improve health within available resources [1].
The patient satisfaction perspective of hospital care had gained more attention in recent years and studies have shown that patients are most satisfied with inter-personal interactions, such as staff-patient relationships [2]. A study done in South Africa concluded that patient satisfaction is a fundamental indicator of equitable qual-ity of care [3]. Another study on patients’satisfaction at a referral hospital in Tanzania observed a high level of satisfaction among respondents, mainly because of the
hierarchical health care delivery system, whereby the refer-ral hospital is at the apex with super-specialty services. However, a small proportion of patients were dissatisfied with long waiting time, high cost of treatment, and investi-gation charges [4]. It is well documented that if patients’ level of satisfaction on quality of care does not meet their standard, they may decide to seek for treatment some-where else [5-7].
In fact, satisfied patients are likely to exhibit favorable behavioral intentions, which are beneficial to the health-care provider’s long-term success. However, one of the major barriers to better health care for much of the population in developing countries, including Tanzania, is lack of access to even basic health services [8]. In Tanzania, despite efforts by the Government, through the Ministry of Health and Social Welfare (MoHSW), to improve the quality of care through different approaches * Correspondence:biesein2007@gmail.com
1Kilimanjaro Christian Medical University College, Box 2240, Moshi, Tanzania 2
Kilimanjaro Christian Medical Centre, Box 3010, Moshi, Tanzania
such as Health Quality Improvement Framework, still health service provision is constrained by a number of factors in terms of poor infrastructure, unavailability of drugs and/or medical equipments and limited human re-source for health [9,10]. For example, in 2006 the national average population/doctor ratio was 138,000 persons per doctor, while the national average population/nurse ratio was 5,000 persons per nurse [11].
In Tanzania, 80% of all patients attending health facil-ities are attended at out-patient-department (OPD), hence making OPD a key area to assess quality of care [9-11]. To understand patients’level of satisfaction it was imperative to conduct this study to determine patients’level of satis-faction on the quality of health care delivered at the OPD in Mwananyamala hospital in Dar es Salaam, Tanzania.
This study used the Donabedian model [12] to deter-mine patients’ level of satisfaction on quality of care at the study setting. According to the Donabedian model, three key domains, namely structure, process and out-come are interrelated in the context of quality of care. Donabedian posit that a good structure increases the like-lihood of good process, which increases the likelike-lihood of good outcome, such as patients’ satisfaction [12]. The Donabedian model was adopted in this study because it has received substantial empirical support for its ability to generate information from which inferences can be drawn on quality of care [12].
However, there is dearth of empirical evidence on the use of Donabedian model to assess patients’ satisfaction on quality of care provided at different health care facilities in Tanzania. This study therefore aims to determine patients’ level of satisfaction in an urban health care facility. Findings from this study will add knowledge to the literature by assessing how Donabedian model might explain patients’ level of satisfaction on quality of care and provide evidence for improvement of quality of care in the study setting.
Methods
Design and study area
A cross-sectional study design was conducted at Mwananyamala hospital from April to May 2012. Mwanayamala public hospital is located in Kinondoni mu-nicipality in Dar es Salaam, Tanzania. During the study period, Mwananyamala hospital use to attend 1500 to 1700 patients per day through six units at the OPD [13].
Study population and sampling
A single population proportion sample size determin-ation formula was used with the following assumption: the patients’level of satisfaction in Dar es Salaam of 50% [14], margin error of 5%, and non response rate of 10% and the desired level of confidence interval at 95% [14]. A minimum sample size of 422 was calculated. A systematic sampling based on the projected daily attendance at OPD
per day and a list of attending patients obtained from the medical records was used to select participants to partici-pate in the exit interviews. To get the sampling interval a formula N/n was used whereby N = the total number of patients attending OPD per day, and n = the estimated sample size [14].
Anonymous, structured SERVIQUAL questionnaire was adapted and then adopted to address the study ob-jectives [15]. The SERVIQUAL questionnaire is divided into five service dimensions (tangibles, reliability, re-sponsiveness, assurance and empathy) to determine pa-tients’level of satisfaction on quality of care. According to SERVIQUAL questionnaire, the questions to assess patients’level of satisfaction are in two categories: 1) ex-pectation and 2) perception questions.
The questionnaire was developed in English with back-and-forth translated in Kiswahili-the local language in Tanzania. The SERVIQAUL questionnaire in Kiswahili was then piloted with a convenient sample of n = 30 (15 males vs. 15 females patients) for validity and reliabil-ity. Minor adjustments were made based on the pilot test-ing. The respondents were informed of the purpose of the study and assured of confidentiality and their right to withdraw from the study. Data was collected for 14 days with an average of 30 exit interviews per day by three trained research assistants.
Study variables
The dependent variable in this study was Patients’ level of satisfaction and was assessed by asking the level to which they were satisfied with the structure and process domains using a four point-Likert Scale questions (rating points on the scale).
The explanatory variables in this study includes: socio demographic characteristics (sex, age, religion, marital sta-tus, occupation); Tangibles: Five questions were used to assess the tangibles variable. An example of expectation question was: “I expect drugs for all diseases to be avail-able at the OPD”. Expected response was: 1 = strongly dis-agree; 4 = strongly agree. An example of perception question was:“I am satisfied that all drugs for all diseases are available at the OPD”. Expected response was: 1 = strongly disagree; 4 = strongly agree. The reliability scale was Cronbach’s alpha coefficients = .85.
Reliability: Four questions were used to assess the reli-ability variable. An example of expectation was: “I expect staff at the OPD to keep my appointments”. Expected re-sponse was: 1 = strongly disagree; 4 = strongly agree. An example of perception question was: “I am satisfied that staff at OPD kept my appointment”. Expected response was: 1 = strongly disagree; 4 = strongly agree. This scale was reliable at alpha = .76.
question was: “I expect staff at OPD to always retrieve my records promptly whenever required”. Expected re-sponse was: 1 = strongly disagree; 4 = strongly agree. An example of perception question was:“I am satisfied that staff at OPD retrieved my records promptly whenever required”. Expected response was: 1 = strongly disagree; 4 = strongly agree. The reliability scale was alpha = .80.
Assurance: Five questions were used to assess the assur-ance variable. An example of expectation question was:“I expect laboratory results at the OPD will be timely deliv-ered”. Expected response was: 1 = strongly disagree; 4 = strongly agree. An example of perception question was:“I am satisfied that my laboratory results were timely deliv-ered”. Expected response was: 1 = strongly disagree; 4 = strongly agree. This scale was reliable at alpha = .77.
Empathy: Five questions were used to assess the empathy variable. An example of expectation question was:“I expect staff at the OPD to pay attention to my medical concerns”. Expected response was: 1 = strongly disagree; 4 = strongly agree. An example of perception question was:“I am satis-fied that staff at OPD paid attention to my medical con-cerns”. Expected response was: 1 = strongly disagree; 4 = strongly agree. The reliability scale was alpha = .83.
Data management and analysis
Data was entered and cleaned in EPI INFO software and analyzed using STATA version 13.1 and Statistical Pack-age for Social Sciences (SPSS) version 14.1. Descriptive as well as analytical analysis was employed to determine patients’ level of satisfaction. To calculate the mean gap score for patients’level of satisfaction the following proce-dures was used. A total score (in%) was calculated for each dimension (e.g. Tangibles) for both expectation and per-ception questions. The total gap score was derived by sub-tracting perception score (%) from expectation score (%). A one-sample t-test was conducted to assess whether the two scores are statistically different from each other. The gap implies the level of patients’satisfaction on quality of care. Quality of care is deemed indifferent or sufficient when patients’level of satisfaction is equal or greater than the expected level of service or vice versa [15].
In addition, principal component analysis (PCA) was done using SPSS to identify the subgroups of SERVIQUAL items forming subscales. Prior to performing PCA, the suit-ability of data was assessed. Correlation coefficient was set at a cut of point of .3 or above. The Kaiser-Meyer-Oklin [16,17] value-which was used to assess sampling adequacy was set at a cut-off point of .6, while the Bartlett’s test of sphericity [18], was used to support the factorability of the correlation matrix. Furthermore, a Catell’s scree test [19], and eigenvalue of over 1.0, which represents the amount of the total variance explained by a factor, were used to in-spect the plotting of each eigenvalue of the factors to find a point at which the shape of the curve changes direction
and becomes horizontal. All factors above the break in the plot and with eigenvalues of over 1.0 were retained for fur-ther analysis. Lastly, furfur-ther analysis was done using Vari-max method, to try to minimize the number of variables with high loadings on each factor.
Ethical consideration
Ethical clearance was obtained from Kilimanjaro Christian Medical University College Ethics Committee. All respon-dents consented to take part in the study and ethical pro-cedures were adhered to.
Results
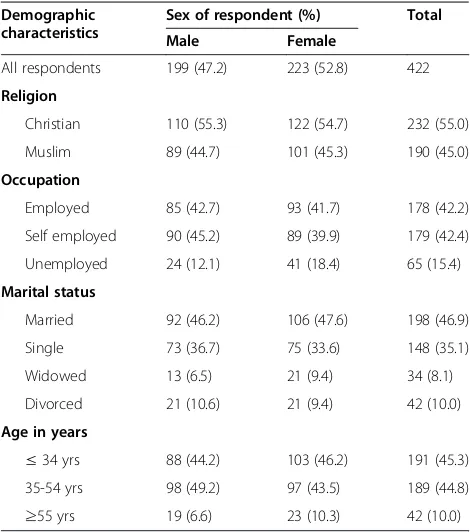
A total of 422 study participants were included with a re-sponse rate of 100%. Mean age of participants was 36.8 ± 11.9. Almost half, (n = 191, 45.3%) were aged 34 years or less, most, 52.8% were female, 55% were Christians and 84.6% were either employed or self-employed. Table 1 below summarize socio-demographic characteristics of all study participants.
Overall patients’level of satisfaction
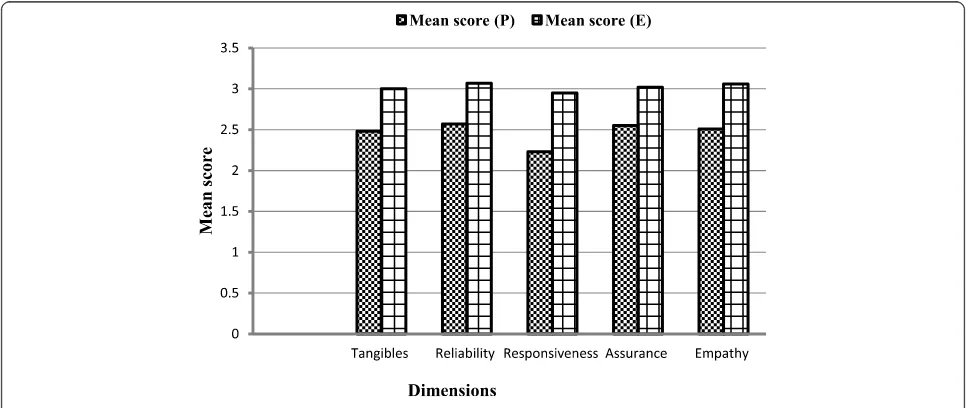
[image:3.595.304.539.467.733.2]Overall, the mean gap score (standard deviation) to assess overall patients’ level of satisfaction attending OPD at Mwananyamala hospital was relatively small–2.88 (±3.1). The mean expectation score was 15.1 while the mean per-ception score was 12.2. Therefore, the gap mean score (Perception - Expectation) was−2.88 of all five service di-mensions assessed.
Table 1 Characteristics of participants Demographic
characteristics
Sex of respondent (%) Total
Male Female
All respondents 199 (47.2) 223 (52.8) 422
Religion
Christian 110 (55.3) 122 (54.7) 232 (55.0)
Muslim 89 (44.7) 101 (45.3) 190 (45.0)
Occupation
Employed 85 (42.7) 93 (41.7) 178 (42.2)
Self employed 90 (45.2) 89 (39.9) 179 (42.4)
Unemployed 24 (12.1) 41 (18.4) 65 (15.4)
Marital status
Married 92 (46.2) 106 (47.6) 198 (46.9)
Single 73 (36.7) 75 (33.6) 148 (35.1)
Widowed 13 (6.5) 21 (9.4) 34 (8.1)
Divorced 21 (10.6) 21 (9.4) 42 (10.0)
Age in years
≤34 yrs 88 (44.2) 103 (46.2) 191 (45.3)
35-54 yrs 98 (49.2) 97 (43.5) 189 (44.8)
Figure 1 below shows a summary of mean score of five service dimensions including tangibles, responsiveness, reliability, assurance and empathy.
Ranking of service dimensions to assess quality of care
Of the five service dimensions, assurance was ranked first. Expectation score for assurance was 3.02 and standard error (SE) 0.143, while the mean perception score was 2.55 and SE 0.151, therefore the gap mean score for assurance was−0.47. Of all five items used to assess assurance, respondents were least likely being sat-isfied with confidentiality of patient’s records at the OPD (−0.20; SE = 0.041; p < 0.001), less likely to recommend OPD service to other patients (−0.43; SE = 0.039; p < 0.001), least satisfied by the skills and knowledge of staff to answer questions (−0.47; SE = 0.039; p < 0.001), timely availability of laboratory results (−0.54; SE = 0.045; p < 0.001), and availability of adequate staff at OPD (−0.69; SE = 0.045; p < 0.001).
Reliability was ranked second. Expectation score for reliability was 3.07 (SE = 0.10) while the mean perception score was 2.57 (SE = 0.11), therefore the gap mean score for assurance was−0.49. Of all four items used to assess reliability, respondents were least satisfied with proper prescription of medications (−0.35; SE = 0.047; p < 0.001), communication skills of the staff (−0.5; SE = 0.040; p < 0.001), on how staff kept their appointments (−0.55; SE = 0.043; p < 0.001), and physical examination of clients (−0.61; SE = 0.043; p < 0.001). Tangible was ranked third. The mean expectation score for tangibles was 3.00 (SE = 0.143), while the mean perception score was 2.48 (SE = 0.151), therefore the gap mean score for tangibles was−0.52. Of all five items used to assess tan-gibles dimension, respondents were least satisfied with
OPD clinicians ability to prescribe good drugs (−0.41; SE = 0.044; p < 0.001), availability of drugs for all diseases (−0.43; SE = 0.045; p < 0.001), general cleanliness at OPD (−0.50; SE =0.045; p < 0.001), accessibility of drugs in the OPD (−0.57; SE = 0.049; p < 0.001), and sufficient chairs and toilets at OPD (−0.67; SE = 0.047; p < 0.001).
Empathy was ranked fourth. Mean expectation score for empathy was 3.06 (SE = 0.120), while the mean perception score was 2.51 (SE =0.140), therefore the gap mean score for assurance was −0.55. Of all five items used to assess empathy, respondents were least satisfied with compassion (−0.50; SE=; 0.038; p < 0.001), active listening to patients (−0.51; SE=; 0.036; p < 0.001), politeness, comforting and encouraging when patients face medical problems (−0.55; SE=; 0.037; p < 0.001), OPD staff paid attention to individ-ual medical concerns of patients (−0.60; SE = 0.043; p < 0.001), and OPD staff built good cooperation with patients (−0.62; SE = 0.041; p < 0.001).
[image:4.595.56.539.516.720.2]Responsiveness was ranked fifth. Mean expectation score for responsiveness was 2.95 (SE = 0.195) while the mean perception score was 2.23 (SE = 0.203), therefore the gap mean score for assurance was −0.72. Of all seven items used to assess responsiveness, respondents were least satisfied with OPD staff respect of patients (−0.42; SE = 0.041; p < 0.001), ability of OPD staff to assist when medical help is needed (−0.46; SE = 0.040; p < 0.001), OPD staff offer prompt services (−0.51; SE = 0.043; p < 0.001), time taken by OPD staff when attend-ing patients’ problems (−0.51; SE = 0.042; p < 0.001), prompt retrieval of patients’records (−0.53; SE = 0.043; p < 0.001), waiting time of patients before getting ser-vices (−0.56; SE = 0.041; p < 0.001) and identify very ill patients and offer help (−0.64; SE = 0.040; p < 0.001). Table 2 below summarizes the mean score on
perception score and expectation score and ranking of the five service dimensions which assessed quality of care.
[image:5.595.57.539.107.681.2]The 26 items of the SERVIQUAL scale were subjected to Principal Component Analysis (PCA). Prior to per-forming PCA the suitability of data for factor analysis
Table 2 Mean score and ranking of 5 service dimensions to assess quality of care (n = 422)
SN SERVQUAL statements Mean perception
score (SE)
Mean score expectation (SE)
Mean gap score (SE)
P-value
I Tangibles (structure)
1 OPD has provided me with drugs of all diseases 2.64(.033) 3.07(.036) −0.43(.045) 0.0000
2 Doctors of this OPD has prescribed good drugs 2.72(.031) 3.13(.037) −0.41(.044) 0.0000
3 Drugs are obtained easily in this OPD 2.27(.037) 2.84(.037) −0.57(.049) 0.0000
4 OPD has good reception area that have sufficient seats and toilets 2.26(.035) 2.93(.034) −0.67(.047) 0.0000
5 OPD appears clean every day 2.53(.036) 3.03(.030) −0.50(.045) 0.0000
Average Tangibles SERVQUAL scores 2.48(.151) 3.00(.143) −0.515 3
II Reliability (process)
6 OPD staff keeps appointments given to me. 2.39(.033) 2.94(.034) −0.55(.043) 0.0000
7 OPD staff has good communication and information skills. 2.75(.030) 3.25(.033) −0.50(.040) 0.0000
8 OPD staff has fulfilled my expectations by giving me thorough physical examinations.
2.57(.034) 3.17(.031) −0.60(.043) 0.0000
9 OPD staff has given me proper medications as prescribed (essential drugs)
2.59(.035) 2.91(.032) −0.35(.047) 0.0000
Average Reliability SERVQUAL scores 2.57(.110) 3.07(.100) −0.494 2
III Responsiveness (process)
10 OPD staff retrieves my records promptly. 2.08(.034) 2.61(.037) −0.53(.043) 0.0000
11 OPD staff identifies very ill patients and assist them whenever there is need.
2.62(.031) 3.26(.029) −0.64(.039) 0.0000
12 OPD staff is respectful to me. 2.75(.032) 3.17(.028) −0.42(.041) 0.0000
13 OPD staff offer prompt services. 2.40(.034) 2.91(.032) −0.51 (.043) 0.0000
14 OPD staff is willing to help client whenever medical help was needed 2.36(.032) 2.82(.033) −0.46(.040) 0.0000
15 I used a short period of time to wait (<30 min) before getting services 2.40 (.036) 2.96(.030) −0.56(.041) 0.0000
16 OPD staff spend enough time (at least 10 min) while attending to my problems
2.45(.035) 2.96(.032 −0.51(.042) 0.0000
Average Responsiveness SERVQUAL scores 2.23(.203) 2.95(.195) −0.722 5
IV Assurance (structure)
17 Laboratory results of this OPD are timely availed 2.33(.036) 2.87(.034) −0.54(.045) 0.0000
18 OPD staff adhere to the confidentiality of my information 2.98(.034) 3.18(.030) −0.20(.041) 0.0000
19 OPD has adequate staffs to take care of its clients 2.23(.034) 2.92(.033) −0.69(.045) 0.0000
20 OPD staff has enough knowledge to answer my questions 2.63(.032) 3.10(.028) −0.47(.039) 0.0000
21 I can recommend this OPD services to other client 2.58(.033) 3.01(.030) −0.43(.039) 0.0000
Average Assurance SERVQUAL scores 2.55(.143) 3.02(.132) −0.466 1
V Empathy (process)
22 OPD staff paid attention to my individual medical concerns 2.36(.036) 2.96(.032) −0.60(.043) 0.0000
23 OPD staff has built good cooperation with me and are ready to offer me medical assistance
2.34(.032) 2.95(.031) −0.61(.041) 0.0000
24 OPD staff is polite, comforting and encouraging to me when faced with medical problems
2.56(.031) 3.11(.025) −0.55(.037) 0.0000
25 OPD staffs were compassionate to me 2.64(.034) 3.13(.025) −0.49(.038) 0.0000
26 OPD staff listened to me adequately 2.63(.033) 3.14(.024) −0.51(.036) 0.0000
was assessed. Inspection of correlation matrix revealed the presence of many coefficients of .3 and above. The Kaiser-Meyer-Oklin value was .87, exceeding the cut-off point of .6 and the Barlett’s Test of Sphericity was statis-tical significant (X2= 2648 (66); p < 0.001). Principal com-ponent analysis for expectation scale revealed the presence of seven components with eingenvalues exceed-ing 1, explainexceed-ing 31.3%, 8.7%, 7.0%, 6.5%, 5.2%, 4.5% and 4.0% of the variance. These seven components explained a total of 67.2% of the variance. Principal component ana-lysis for perception scale revealed the presence of six com-ponents with eingenvalues exceeding 1, explaining 41.6%, 6.3%, 6.0%, 5.0%, 4.1% and 4.0%. These six components explained a total of 67% of the variance.
Using Catell’s scree test, two components above the break point on the screeplot of factors for both expect-ation and perception scale were retained for further ana-lysis. Further analysis using Varimox method revealed strong loading of six factors with both components. The two factor solution explained a total of 53 per cent of the variance, with Component 1 contributing 27.7% and Component 2 contributing 25.3% and had acceptance reliability, as indicated by Cronbach’s coefficients of .78 for expectation sub scale and .83 for perception sub scale. Table 3 above provides a summary of the Principal Component Analysis(PCA) of the SERVIQUAL scale.
Discussion
The study findings indicate that the overall patients’level of satisfaction on the quality of care at the OPD in Mwa-nanyamala hospital was relatively low. This is in line with findings of patients’satisfaction studies elsewhere [20,21]. However, this is contrary to a study done in Muhimbili National Hospital in Dar es Salaam, whereby a high
proportion of patients were satisfied with quality of care [22]. In fact, it is not generally proven that patients’ satis-faction is related to quality as reported by Leonard (2008) in a study done in Arusha Tanzania. In this study Leonard showed that, in the Tanzanian context, satisfaction is not directly associated with quality, but changes in quality do lead to changes in satisfaction, as patients notice improve-ments [5]. Of all five dimensions used to assess patient’s level of satisfaction, respondents were least satisfied with the assurance dimension, followed by reliability, tangibles, empathy, and responsiveness. According to Donabedian model [12] there is a strong relationship between all three domains of structure, process and outcome, which exist in the context of quality of care. Based on the Donabedian model assurance dimension was used to assess the struc-ture category. Of all items used to assess assurance dimen-sion, respondents were least satisfied with OPD staff adherence to confidentiality of patient’s information. The observed dissatisfaction of patients’on providers’lack of ad-herence to confidentiality of patient’s information underline the importance for the hospital management to strengthen adherence skills among OPD staff on confidentiality of pa-tient’s information. It is well documented that patients who perceive lack of confidentiality on their medical information tend to seek care somewhere else [5-7,23,24].
In this study reliability dimension was ranked second by respondents. Reliability dimension was used to assess the process domain according to the Donabedian model. In the reliability dimension, respondents were least satis-fied with proper prescription of medications. The ob-served level of dissatisfaction of respondents on proper prescription of medications at the OPD may raise con-cern regarding clinician’s ability to make proper diagno-sis and treatment of common diseases [23-25].
Tangibles dimension, which was used to assess the struc-ture domain was ranked third by respondents. Respondents were dissatisfied with clinician’s ability to prescribe good drugs. This observation substantiates respondent’s dissatis-faction on proper prescription of medication mentioned in reliability dimension above. In this study, empathy was used to assess the process domain. Respondents were dissatisfied with lack of compassion by the OPD staff. Provider’s behav-ior towards patients, such as politeness is an important pre-dictor for patient satisfaction [4,5,26]. This observation, which is reported to be common in most public health fa-cilities, force patients who can afford to pay for services to choose to go to private health facilities instead of seeking care at public health facilities [26-29]. It is important for the hospital management at Mwananyamala to encourage the health personnel to embrace staff-patient relationship, whereby the patient is viewed as a customer in order to im-prove the quality of care in this setting.
[image:6.595.56.290.527.733.2]Responsiveness was used to assess the process domain as well. Respondents were least satisfied with OPD staff
Table 3 Varimax Rotation of Two Factor Solution for SERVQUAL Items
Items Component 1 Compenent 2
Expectation Perception score score
1. OPD staffs were compassionate to me
.83 .86
2. OPD staffs are polite, comforting and encouraging to me when faced with medical problems.
.78 .80
3. OPD staffs listened to me adequately .74 .86
4. OPD staff has provided me with drugs of all diseases
.65 .73
5. Clinicians at this OPD have prescribed good drugs
.60 .67
6. OPD reception has sufficient seats and toilets
.57 .44
% of variance explained 27.7% 25.3%
respect towards patients. It is well documented that pa-tient’s perception of health care provider’s behaviour, such as respect influence their view’s towards quality of care [4-6].
From the Principal Component Analysis (PCA), six items (3 empathy items versus 3 tangibles items) explained 53 percent of the patient’s satisfaction scores on quality of care. Empathy items which explained most of the dissatis-faction on quality of care were failure to show compassion, lack of politeness and inadequate listening by OPD staff. Tangibles items which explained most of the dissatisfac-tion on quality of care were lack of essential drugs, poor prescription of drugs by clinicians and insufficient seats and toilets at OPD. Apart from perceived poor prescrip-tion by clinicians at OPD, the perceived lack of essential drugs observed by respondents is crucial, because avail-ability of essential drugs is an important factor influencing patients’level of satisfaction observed in several studies in other settings [21-25].
According to the Donabedian model, all three domains, structure, process, and outcome are interrelated and in order to improve quality of care, all must function well to achieve the expected outcome, such as patients’ satisfac-tion [12]. However, it is important to note that a multitude of factors influence patients’level of satisfaction and qual-ity of care hence caution should be taken into consider-ation while making conclusions regarding quality of care [5,8,29-34].
Study limitation and strength
This study has several limitations. First, the study, which was cross-sectional in nature, is unable to identify the causality of the outcome of interest. Second, the patient satisfaction relied on self response of participants and did not assess their views to changes in technical quality. It is well documented that self-reporting is liable to re-sponse bias. Third, this study only assessed patients who attended at the OPD and did not assess the patient-doctor interactions and may not reflect the overall quality of care at the hospital. A further study, which will include all de-partments in the hospital, and which will assess the effect of patient-doctor interactions to detect changes in tech-nical quality of care is warranted to determine the overall quality of care in this setting.
The strength of this study is based on the fact that the study used the Donabedian model, which has been tested in many studies on patient’s satisfaction and revealed sig-nificant results. In addition this study used SERVIQUAL questionnaire, which is a standardized tool to measure ser-vice quality applied in different settings.
Conclusion
In conclusion, respondents in this study perceived low quality of care provided at the OPD in Mwananyamala
hospital. Key areas of concern includes: improvement on communication skills in showing compassion, politeness and active listening, availability of essential drugs, and improvement on clinicians’ prescription skills. If policy can improve the reality on the ground, patients will no-tice, and hence indirectly improve their satisfaction.
Competing interests
The author(s) declare that they have no competing interests.
Authors’contributions
KK designed, collected, analyses, interpreted and took part in drafting the manuscript; BN assisted in design, analysis and took part in drafting the manuscript. Authors read and approved the manuscript.
Acknowledgements
We gratefully acknowledge all patients who participated in this study. We also thank the local health authorities who provided permission to conduct this study at Mwananyamala hospital.
Received: 15 October 2013 Accepted: 11 September 2014 Published: 18 September 2014
References
1. Murray C, Frenk J:World Health Report 2000: a step towards evidence based health policy.Lancet2000,357:1698–1700.
2. Olusina AK, Ohaeri JU, Olatawura MO:Patient and staff satisfaction with the quality of in-patient psychiatric care in a Nigerian general hospital. Soc Psychiatr Epidemiol2002,37:283–288.
3. Myburgh NG, Solanki GC, Smith MJ, Lalloo R:Patient satisfaction with health care providers in South Africa: The influences of race and socioeconomic status.Int J Quality in Health Care2005,17(6):473–477. 4. Muhondwa E, Leshabari M, Mwangu M, Mbembeti N, Ezekiel M:Patient
satisfaction at Muhimbili National Hospital in Dar Es salaam, Tanzania. East Africa journal of public health2008,5:13.
5. Leonard KL:Is patient satisfaction sensitive to the changes in the quality of care? An exploitation of the Hawthorne effect.Journal of Health Economies2008,27(2):444–459.
6. Lantis K, Green C, Stephanie J:Providers and quality of care. New Perspectives on Quality of Care2002, (3):2–8.
7. Aldana M, Piechulek H, Al-Sabir A:Client satisfaction and quality of health care in rural Bangladesh.Bull World Health Organ2001,79:512–517. 8. Kruk ME, Freedman LP:Assessing health system performance in
developing countries: A review of Literature.Health Pol2008,85:263–276. 9. Juma D, Manongi R:User’s perception of outpatient quality of care in
Kilosa district hospital in central Tanzania.Tanzania Journal of Health Research2009,11:4.
10. Munga MA, Mwangu MA:Comprehensive health workforce planning: re-consideration of the primary health care approach as a tool for addressing the human resource for health crisis in low and middle income countries.Tanzania Journal of Health Research2013,15:2. 11. Tanzania Ministry of Health and Social Welfare:Health Sector Performance
Profile Report.In Dar es Salaam: Ministry of Health and Social Welfare; 2008. http://ihi.eprints.org/612/1/ihi.eprints.pdf_(38).pdf [Accessed on 19/09/2014]. 12. Donabedian A:Exploration in Quality Assessment and Monitoring
Volume I. Definition of Quality and Approaches to its Assessment.In Ann Arbor: Health Administration Press, University of Michigan; 1980.
13. United Republic of Tanzania, Prime Minister’s Office Regional Administration and Local Government:Strategic Plan for 2010/11-2012/2013.In Dar es Salaam: Prime Minister’s Office Regional Administration and Local Government; 2010. http://www.dsm.go.tz/kurasa/nyaraka/Strategic% 20plan_Book.pdf [Accessed on 19/09/2014].
14. Cochran W:Sampling techniques.3rd edition. New York: John Wiley and Sons; 1977.
15. Senel M, Senel B:The effect of European Foundation for Quality Management (EFQM) Excellence model application on the perceived service quality.InAn application in health care; 2006.
18. Bartlett MS:A note on the multiplying factors for various chi-square approximations.J Roy Stat Soc Stat Soc1954,16(Series B):296–298. 19. Catell RB:The scree test for numbers of factors.Multivar Behav Res1966,
1:245–276.
20. Derua Y, Ishengoma D, Rwegoshora D, Tenu F, Massaga J, Mboera L, Magesa S:User’s and health service provider’s perception on the quality of laboratory malaria diagnosis in Tanzania.Malar J2011,10:78. 21. Ahmad I, Nawaz A, Khan S, Khan H, Rashid MA, Khan MH:Predicators of
Patient Satisfaction.Gomal Journal of Medical Sciences2001,9(2):183–188. 22. Leshabari M, Muhondwa P, Mwangu M, Mbembati A:Motivation of health
care workers in Tanzania; a case study of Muhimbili National Hospital. East Africa Journal of Public Health2008,5:1.
23. Thompson A:Predictors of patient satisfaction with hospital health Care. BMC Health Serv Res2006,6:102.
24. Kagashe G, Rwebangila F:Patients’satisfaction with health care service provided at HIV clinics at Amana and Muhimbili hospital in Dar es Salaam.African Health Science2011,11:60–66.
25. Assefa F, Moses A, Johannes M:Assessment of client’s satisfaction with health service delivered at Jimma University specialized hospital. Ethiopian Journal Of Health Science2010,21:2.
26. Forster D, McLachlan H, Yelland J, Rayner J, Lumley J, Davey MA:Staffing in postnatal units: is it adequate for the provision of quality care? Findings from a state-wide review of postnatal care in Victoria, Australia. BMC Health Serv Res2006,6:83.
27. Peltezer K:Patient experiences and health system responsiveness in South Africa.Bio Med Central2009,9:117.
28. Khori V, Changizi S, Biuckians E:Relationship between consultation length and rational prescribing of drugs in Gorgan City.Islamic Republic of Iran Pub Med2012,18(5):480–486.
29. Andaleeb SS:Service quality perceptions and patient satisfaction: a study of hospitals in a developing country.Soc Sci Med2001,52:1359–1370. 30. Mamdani M, Bangser M:The poor people’s experiences of health Care
services in Tanzania: a literature review.Reproductive Health Matters2004, 12:138–153.
31. Chang TJ, Hays RD, Shekelle PG, MacLean CH, Solomon DH, Reuben DB, Roth CP, Kamberg CJ, Adams J, Young RT, Wenger NS:Patient’s global ratings of their health care are not associated with the technical quality of their care.Ann Intern Med2006,144:665–672.
32. Leonard KL, Mliga G, Mariam DH:By passing health facilities in Tanzania: revealed preferences for observable and unobservable quality.J Afr Econ
2002,11(4):441–471.
33. Leonard KL:Learning in Health care: evidence of learning about clinician quality in Tanzania.Econ Dev Cult Chang2007,55(3):531–555.
34. Lundberg M:Client satisfaction and the perceived quality of primary health care in Uganda.InAre You Being Served? New Tools for Measuring Service Delivery.Edited by Amin S, Das J, Goldstein M. World Bank; Chapter 14: 340-364. © 2008 The International Bank for Reconstruction and Development/The World Bank 1818 H Street NW Washington DC 20433. http://wwwwds.worldbank.org/external/default/WDSContentServer/ WDSP/IB/2008/02/15/000333038_20080215064605/Rendered/PDF/ 424820PUB0ISBN1LIC0disclosed0Feb131.pdf [Accessed on 19/09/2014].
doi:10.1186/1472-6963-14-400
Cite this article as:Khamis and Njau:Patients’level of satisfaction on quality of health care at Mwananyamala hospital in Dar es Salaam, Tanzania.BMC Health Services Research201414:400.
Submit your next manuscript to BioMed Central and take full advantage of:
• Convenient online submission
• Thorough peer review
• No space constraints or color figure charges
• Immediate publication on acceptance
• Inclusion in PubMed, CAS, Scopus and Google Scholar
• Research which is freely available for redistribution