R E S E A R C H
Open Access
Widespread movement of invasive cattle fever
ticks (
Rhipicephalus microplus
) in southern Texas
leads to shared local infestations on cattle and
deer
Joseph D Busch
1, Nathan E Stone
1, Roxanne Nottingham
1, Ana Araya-Anchetta
1, Jillian Lewis
1,
Christian Hochhalter
1, John R Giles
1, Jeffrey Gruendike
1, Jeanne Freeman
2, Greta Buckmeier
2, Deanna Bodine
2,
Roberta Duhaime
3, Robert J Miller
4, Ronald B Davey
4, Pia U Olafson
2, Glen A Scoles
5and David M Wagner
1*Abstract
Background:Rhipicephalus(Boophilus)microplusis a highly-invasive tick that transmits the cattle parasites (Babesia bovisandB. bigemina) that cause cattle fever.R. microplusandBabesiaare endemic in Mexico and ticks persist in the United States inside a narrow tick eradication quarantine area (TEQA) along the Rio Grande. This containment area is threatened by unregulated movements of illegal cattle and wildlife like white-tailed deer (WTD;Odocoileus virginianus).
Methods:Using 11 microsatellite loci we genotyped 1,247R. microplusfrom 63 Texas collections, including outbreak infestations from outside the TEQA. We used population genetic analyses to test hypotheses about ecological persistence, tick movement, and impacts of the eradication program in southern Texas. We tested acaricide resistance with larval packet tests (LPTs) on 47 collections.
Results:LPTs revealed acaricide resistance in 15/47 collections (32%); 11 were outside the TEQA and three were resistant to multiple acaricides. Some collections highly resistant to permethrin were found on cattle and WTD. Analysis of genetic differentiation over time at seven properties revealed local gene pools with very low levels of differentiation (FST0.00-0.05), indicating persistence over timespans of up to 29 months. However, in one
neighborhood differentiation varied greatly over a 12-month period (FST0.03-0.13), suggesting recurring immigration
from distinct sources as another persistence mechanism. Ticks collected from cattle and WTD at the same location are not differentiated (FST= 0), implicating ticks from WTD as a source of ticks on cattle (and vice versa) and emphasizing
the importance of WTD to tick control strategies. We identified four major genetic groups (K= 4) using Bayesian population assignment, suggesting multiple introductions to Texas.
Conclusions:Two dispersal mechanisms give rise to new tick infestations: 1) frequent short-distance dispersal from the TEQA; and 2) rare long-distance, human-mediated dispersal from populations outside our study area, probably Mexico. The threat of cattle fever tick transport into Texas is increased by acaricide resistance and the ability ofR. microplusto utilize WTD as an alternate host. Population genetic analyses may provide a powerful tool for tracking invasions in other parts of the world where these ticks are established.
Keywords:Bovine babesiosis, Cattle fever ticks, Eradication, Population genetics,Rhipicephalus(Boophilus)microplus
* Correspondence:Dave.Wagner@nau.edu 1
Center for Microbial Genetics and Genomics, Northern Arizona University, 1298 S Knoles Drive, PO Box 4073, Flagstaff, AZ 86011, USA
Full list of author information is available at the end of the article
Background
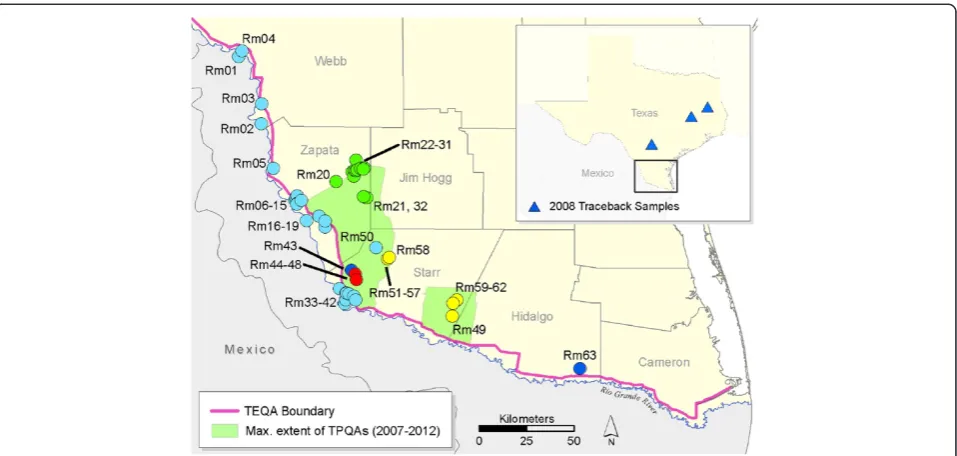
The southern cattle tick, Rhipicephalus (Boophilus) microplus, is a highly adaptable ectoparasite that has become established in nearly all tropical and subtrop-ical regions of the world where domesticated cattle production occurs [1]. This tick species is a major problem for livestock production worldwide because it is the biological vector for disease agents causing bo-vine babesiosis (Babesia bovis, B. bigemina) and ana-plasmosis (Anaplasma marginale) [2]. Along with the closely related cattle tick (R. annulatus) it was likely in-troduced to the New World by Spanish colonialists. By 1906, economic losses were estimated to be > $130 million per year in the U.S. alone [3]; this would be the equivalent of > $3 billion today. The Rhipicephalus-Babesia system was one of the first vector-borne diseases to be described in detail [4], which led to the insight that eradicating tick vectors would prevent the spread of bovine babesiosis [5]. Consequently, the National Cattle Fever Tick Eradication Program (CFTEP) was established in the U.S. in the early 1900s to eradicate bothRhipicephalusspecies (collectively referred to as cattle fever ticks) from 14 southeastern states and southern California. By 1943, both species were successfully eliminated from most of the U.S., with the exception of southern Texas and Florida. Complete eradica-tion in Florida took another 17 years [3,6] because the ticks successfully used white-tailed deer (Odocoileus virginianus; hereafter WTD) as an alternative host [7] and central Florida contains highly suitable habitats for cattle fever ticks [8,9]. Complete eradication may never have been achieved in some areas along the Texas border with Mexico, and tick infestations in this area have been reported yearly since 1960 [10].
The possibility of re-introducing cattle fever tick-borne diseases to U.S. livestock operations remains a constant concern. The U.S. currently imports 1–2 million cattle annually from Mexico, where cattle fever ticks and the Babesiaparasites they transmit are endemic [11]. As part of the CFTEP, the U.S. Department of Agriculture-Animal Plant Health Inspection Service-Veterinary Services div-ision (USDA-APHIS-VS) maintains an ~800 km long tick eradication quarantine area (TEQA) that follows the Rio Grande border between Texas and Mexico (Figure 1), the purpose of which is to monitor and apprehend stray ani-mals from Mexico that threaten to transport cattle fever ticks to south Texas. All cattle imported via four Texas ports of entry located within the quarantine zone are dipped in an organophosphate acaricide (coumaphos) and certified as tick free prior to being shipped outside the TEQA; CFTEP regulations specifically prohibit imported cattle from being stocked into the TEQA. Most imported cattle are destined for stockyard facilities in the Texas panhandle, but thousands are purchased annually by ranching operations in southern Texas [12]. Despite
the rigorous regulations mandated by the CFTEP, new tick infestations on both cattle and WTD have been detected in the area north of the TEQA in Texas. An increasing number of these infestations are resistant to coumaphos and pyrethroid acaricides. Resistance is rampant in Mexico, where there is documented tick resist-ance to five chemical groups of acaricides [13-15] as well as multiple resistance to 2–3 acaricides simultaneously [16]. If ticks are not detected at border-crossing stations and survive the mandatory coumaphos treatment or stray livestock from Mexico are not found and treated, then re-sistant tick populations might become established in the southern U.S. [17,18].
Tick dispersal by infested alternative hosts is another sig-nificant threat to the eradication program. Rhipicephalus microplus is able to successfully complete all stages of its life cycle on WTD [20]. Infested wild ungulates, including WTD, nilgai antelope (Boselaphus camelotragus) and red deer (Cervus elaphus), readily cross the Rio Grande [21]. White-tailed deer have experienced a remarkable expansion in Texas over the last 100 years, from <10,000 in the 1900s to a current statewide population numbering 3–4 million [22]. Movements of this free-ranging and largely un-regulated host are not restricted by typical cattle fencing (“low fences”) in southern Texas; therefore, movement of ticks on WTD may greatly increase local gene flow among tick populations. One of our primary goals in this study was to investigate whether deer could serve as a source of ticks that infest cattle.
establishment, movement, control, and eradication in southern Texas.
Methods
Field collections and acaricide testing
Tick surveillance occurs year-round in the TEQA and is carried out by USDA-APHIS personnel as part of the CFTEP, as outlined in the Texas Administrative Code under Title 4, Part 2, Chapter 41. The TEQA is a narrow strip be-tween the Rio Grande River and the next physical barrier (usually State Hwy 83) that extends for ~800 km along the border of the U.S. and Mexico (Figure 1). Temporary pre-ventative quarantine areas (blanket quarantine zones) are extended northwards from this eradication zone during severe tick outbreaks; the most recent TPQAs were in place from 2007–2012 and some properties are still under quarantine (Texas Animal Health Commission and R. Duhaime, pers. comm.). Our study is focused on Starr and Zapata counties where R. microplus infestations peaked during 2008–2009; during this time over one million acres were placed under TPQA restrictions. Field samples of live ticks collected directly from hosts (cattle and WTD) are sent to the USDA Cattle Fever Tick Research Laboratory in Edinburg, TX, to be screened for resistance to five compounds (coumaphos, permethrin, amitraz, ivermectin, and fipronil) using the larval packet
test [18,23]. Frozen archives of excess/unused field ticks are stored by USDA-Agricultural Research Service (ARS) in Kerrville, TX and were used for this study.
The most important hosts forR. microplusin southern Texas are cattle (mixed Bos taurus/B. indicus breeds) and WTD. Ticks are sampled from cattle at infested properties by corralling a herd and“scratching”each animal individu-ally to detect attached ticks. Sampling from WTD occurred in Zapata and Starr Cos. in neighborhoods with high rates of infested cattle and large numbers of deer. Randomly sam-pled deer were netted from a helicopter, restrained by ground personnel, and scratched for ticks. We used collec-tions from both hosts to evaluate genetic variation in 63 tick collections sampled from 46 properties in southern Texas (Table 1 and Figure 1). A tick collection is defined as a sam-ple of ticks from a single property taken within a 30-day time window. Tick samples taken from the same premise but separated by >30 days are treated as separate collections. The full life cycle (one generation) ofR. microplusin south-ern Texas takes 3–6 months to complete. Thus, it is reason-ably likely that ticks collected within 30 days from a single location are sampled from the same generation.
Molecular methods
[image:3.595.60.539.88.316.2]Table 1 Information for 63 collections ofRhipicephalus microplusticks (N = 1,247), ordered from West to East (as in Figure 1)
Collection Property Collection date N Host County Analyses
Rm01 Prop01 10-MAR-2008 6 cowMX Webb S
Rm02 Prop02 09-MAR-2009 17 cow Webb S I
Rm03 Prop03 02-JAN-2008 6 cow Webb S
Rm04 Prop04 02-DEC-2009 6 cow Webb S
Rm05 Prop05 19-JUN-2008 30 cow Zapata S V I
Rm06 Prop06 17-DEC-2009, 07-JAN-2010 29 WTD Zapata S V TBD I
Rm07 Prop07 21-JAN-2010 7 WTD Zapata S
Rm08 Prop08 09-DEC-2009 10 WTD Zapata S TBI
Rm09 Prop09 14-NOV-2007 14 cow Zapata S TB
Rm10 Prop10 06-MAY-2009, 04-JUN-2009 31 cow Zapata S V TATBD I
Rm11 Prop10 28-SEP-2009 11 cow Zapata S TAI
Rm12 Prop11 20-JUN-2007 27 cow Zapata S TATB
Rm13 Prop11 27-JUL-2009 20 cow Zapata S TATBD I
Rm14 Prop11 16-NOV-2009 13 WTD Zapata S TATBD I
Rm15 Prop12 04-DEC-2008 12 WTD Zapata S TBI
Rm16 Prop13 28-DEC-2009, 13-JAN-2010 20 WTD Zapata S D I
Rm17 Prop14 16-JUL-2009 20 cow Zapata S D I
Rm18 Prop15 19-MAY-2009 6 cow Zapata S
Rm19 Prop16 06-MAY-2009 2 cow Zapata S
Rm20 Prop17 07-MAY-2008 2 WTD Zapata S
Rm21R Prop18 26-JUN-2008 4 cow Zapata S
Rm22 Prop19 06-MAY-2009 2 cow Zapata S
Rm23 Prop20 06-MAY-2009 7 cow Zapata S
Rm24 Prop21 25-JUN-2009 1 cow Zapata S
Rm25 Prop22 04-MAY-2009, 15-MAY-2009 6 cow Zapata S
Rm26R Prop23 05-NOV-2008 19 cow Zapata S I
Rm27R Prop24 27-OCT-2008, 05-NOV-2008 24 cow Zapata S I
Rm28 Prop25 15-APR-2009, 24-APR-2009, 06-MAY-2009 36 cow Zapata S V I
Rm29R Prop26 15-APR-2009, 24-APR-2009, 01-MAY-2009, 15-MAY-2009 25 cow Zapata S I
Rm30R Prop27 20-APR-2009, 24-APR-2009, 01-MAY-2009 60 cow Zapata S V TAI
Rm31R Prop27 16-JUL-2009 12 cow Zapata S TAI
Rm32R Prop28 26-JUN-2008 18 cow Zapata S I
Rm33 Prop29 15-NOV-2007 7 cowMX Starr S
Rm34 Prop30 29-APR-2005, 03-MAY-2005 42 cow Starr S
Rm35 Prop31 06-JUN-2008 22 cow Starr S I
Rm36 Prop32 30-DEC-2008 31 WTD Starr S V TBD I
Rm37 Prop33 27-MAR-2008 15 cow Starr S TBD I
Rm38 Prop34 23-MAY-2008 24 cow Starr S TATBI
Rm39 Prop34 18-MAR-2009 18 cow Starr S TATBD I
Rm40 Prop34 09-APR-2009, 24-APR-2009 14 cow Starr S TATBI
Rm41 Prop35 04-APR-2008 13 WTD Starr S TBI
Rm42 Prop36 22-FEB-2008 30 cow Starr S V I
Rm43a Prop37 11-APR-2008 48 cow Starr S V I
samples in our study were adult females, so only half of the tick body was used per extraction. We used the entire body of ticks that were small enough to not overload the Qiagen columns. DNA was quantified on a NanoDrop 8000 spec-trophotometer (Thermo Scientific, Waltham, MA) and di-luted to 20 ng/uL for PCR. Because R. annulatus also occurs in the TEQA and may hybridize with R. micoplus, we developed a PCR assay to query a single nucleotide polymorphism (SNP) found in the mitochondrial 16S gene that distinguishes the two species. We aligned partial 16S sequences available in GenBank for R. microplus, R. annulatus, and Haemaphysalis cretica (GenBank accession numbers: EU918179, EU918183, EU918185, L34311, Z97877, and L34308) to find a pu-tative species-specific SNP target that corresponds to nucleotide 295 of the H. cretica reference sequence [24]. We developed specific forward primers to detect a thymine for R. microplus (TICK16S_DerT_Rmicroplus:
5’gggcgggcgggcAAAATGACCCATTATTAATGAAAA
TATGAGT) or an adenine forR. annulatus
(TICK16S-AncA-F1_Rannulatus: 5’AAAATGATCCATTATTAAT
GAAAATATGACA). The reverse primer (TICK16S-R1:
5’AAAATATAACGCTGTTATCCCTAGAGTATTT) was
[image:5.595.57.540.114.380.2]conserved in both species, thus the amplicon lengths are 73 bp forR. microplus(because of the GC tail) and 61 bp forR. annulatus. All three primers were used in a com-petitive PCR; reactions were carried out in 10 μL vol-umes containing the following reagents (given in final concentrations): 20-40 ng of DNA template, 1X SYBR® Green Master Mix (Invitrogen, Carlsbad, CA), 0.15μM of each forward primer, and 0.30 μM of the reverse primer. Quantitative PCRs were thermocycled on an AB7900 (Applied Biosystems, Foster City, CA) under the following conditions: 95°C for 10 minutes to release theTaqpolymerase antibody, followed by 35 cycles of 95°C for 15 seconds, 58°C for 60 seconds, and 72°C for 30 seconds. Afterwards, a dissociation curve was generated for each sample. The R. microplus product dissociates at 73°C because of the GC tail on primer TICK16S_DerT_ Rmicroplus, whereas the R. annulatus product dissociates at 67°C. We ran morphologically identified R. microplus andR. annulatusvouchers as positive controls in all runs.
Table 1 Information for 63 collections ofRhipicephalus microplusticks (N = 1,247), ordered from West to East (as in Figure1) (Continued)
Rm45 Prop38 27-JUL-2009 7 cow Starr S TA
Rm46 Prop39 17-FEB-2009 30 cow Starr S V TAI
Rm47b Prop39 03-MAR-2009 171 WTD Starr S V TAD I
Rm48 Prop39 04-MAR-2009 22 cow Starr S D I
Rm49 Prop40 02-APR-2009 29 cow Starr S V I
Rm50 Prop41 19-JUN-2008 29 cow Starr S V I
Rm51 Prop42 16-JAN-2009 30 cow Starr S V TAI
Rm52 Prop42 27-FEB-2009 30 cow Starr S TAI
Rm53 Prop42 27-MAR-2009 11 cow Starr S TA
Rm54 Prop42 10-APR-2009 10 cow Starr S TA
Rm55 Prop42 04-MAY-2009 3 cow Starr S
Rm56 Prop42 08-JUL-2009 20 cow Starr S TA
Rm57 Prop42 13-AUG-2009 2 cow Starr S
Rm58 Prop43 04-MAY-2009 18 cow Starr S I
Rm59 Prop44 15-APR-2009 30 cow Starr S V I
Rm60 Prop45 06-MAY-2009 15 cow Starr S I
Rm61 Prop45 08-JUN-2009, 29-JUN-2009 3 cow Starr S
Rm62 Prop45 31-JUL-2009 1 cow Starr S
Rm63 Prop46 05-MAY-2008 3 cow Hidalgo S
A tick collection is defined as a sample of ticks from a single property taken within a 30-day time window. Tick samples taken from the same property but separated by >30 days are treated as distinct collections. All samples were made by USDA-APHIS at 46 properties in southern Texas. Hosts included domestic cattle (cow), stray Mexican cattle that were apprehended on the Texas side of the U.S.-Mexico border (cowMX
), and white-tailed deer (WTD). Collections were partitioned into appropriate datasets for statistical analyses, including: population assignment in STRUCTURE software (S), genetic marker validation tests (V), temporal genetic structure within single properties (TA), temporal genetic structure within 4 km neighborhoods centered on Prop11 or Prop34 (TB), genetic differentiation between paired collections of ticks from WTD and cattle (D), and isolation-by-distance (I).
R
Collection was highly resistant to permethrin in larval packet test (seeMethods). a
The Rm43 collection is comprised of 15 ticks from a source pasture (Prop37) and 33 traceout ticks known to have originated from this property. The traceout ticks were intercepted within a few days of transport to Atascosa Co. (n = 5), Madison Co. (n = 10), and Nagocdoches Co. (n = 18).
b
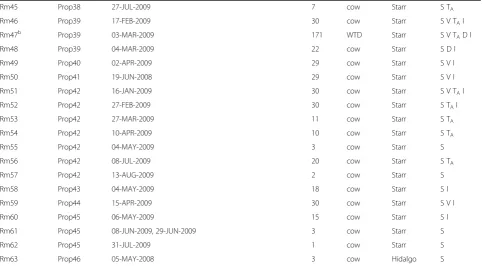
We generated multi-locus genotypes for each tick using 12 neutral microsatellite markers (Table 2). Of 22 published loci forR. microplus, only nine amplified ro-bustly in the Texas samples. This limited performance might stem from a deep phylogenetic split between lin-eages ofR. microplusthat colonized the Americas ver-sus Australia and New Caledonia [25]; until now, all published markers have been developed from the latter tick populations. We were able to improve amplification for three loci by redesigning reverse primers (Table 2). In addition to the nine published loci, we added three markers that were developed for our parallel genetics study on R. annulatus [26]. These markers were identified by single-end shotgun sequences ofR. annulatusDNA on a Roche 454 Titanium instrument at the Genome Resource Center (University of Maryland). MSATCOMMANDER [27] was used to find sequence reads with di-, tri-, and tet-ranucleotide repeats. 138 candidate loci were tested against R. annulatus [26] and R. microplus before choosing the three loci added to this study (Table 2).
All PCRs were carried out in 10 μL volumes contain-ing the followcontain-ing reagents (given in final concentrations): 20-40 ng of DNA template, 1X PCR buffer, 2 mM MgCl2, 0.2 mM dNTPs, 1U Platinum Taq polymerase
(Invitrogen, Carlsbad, CA), and 0.2 μM of each primer.
PCRs were thermocycled according to following condi-tions: 10 minutes at 95°C to release the Platinum Taq® antibody, followed by 38 cycles of 60s at 94°C, 30s at the annealing temperature (Ta) and 30s at 72°C. The Ta,
di-lution, and pooling scheme for each locus are provided in Table 2. Diluted PCR products were electrophoresed on an ABI 3730 sequencer with LIZ®-1200 size standard and analyzed using the software GENEMAPPER v4.0 (Applied Biosystems, Foster City, CA).
Statistical analysis
We ran a series of tests on the microsatellite markers to val-idate their usefulness in population genetic analyses. In this validation step, we used only our largest sample sizes: 14 populations withn≥25 (see Table 1, collection subset“V”). We performed a test of Hardy-Weinberg equilibrium in GENEPOP using the option for a probability test that is based on a Markov chain algorithm [31], a test for linkage disequilibrium in FSTAT v2.9 based on the log-likelihood ratioGstatistic [32], a test of selective neutrality in FDIST2 [33], and a test for null alleles in MICROCHECKER [34].
Question 1: Temporal genetic stability
[image:6.595.55.540.417.700.2]To address our first question, we investigated the temporal genetic signature of ecologically establishedR. microplus
Table 2 Microsatellite markers used to estimate population structure inR. microplusticks from southern Texas
Marker Ta Duplex mix Post-PCR dilution
Dye A Allele sizes (bp) Citation and/or primer sequence (5’-3’)
PNC75 64 2 1/40 NED 4 139, 143, 145, 147 [28]
PNC98 55 3 1/10 NED 4 135, 139, 141, 143 [28]
PNC153 48 naa 1/15 VIC 16 132, 136, 140, 144, 148, 152, 156, 160, 164, 172, 176, 180, 184, 188, 192, 196
[28] but redesigned R primer (PNC153-R2): TTCAAAGTTCATATGCATGGTC
BmC07 57 1 1/100 NED 8 132, 142, 158, 170, 172, 178, 190, 192 [29] but redesigned R primer (BmC07-R2); GTCAGCCATATGTTCAACCAGA
BmD10 57 1 1/100 6FAM 2 152, 154 [29]
BmB12 67 naa 1/60 6FAM 2 297, 301 [29] but redesigned R primer (BmB12-R2):
CGTATGAAGCTATGATGAATAGGAGACGTG
LTF4.3 48 naa 1/15 PET 3 295, 297, 319 [30]
SJB411 55 3 1/10 6FAM 19 159, 187, 191, 195, 215, 219, 223, 227, 231, 239, 243, 251, 259, 263, 267, 271, 275, 279, 283
[30]
KRGinv 55 na na VIC 20 138, 142, 146, 150, 154, 158, 162, 166, 170, 174, 210, 246, 252, 256, 258, 262, 266, 270, 274, 278
[30] Removed from study.
ATC12 64 2 1/40 PET 12 137, 143, 155, 158, 161, 164, 167, 170, 173, 176, 179, 182
[26] F-CAAGCACAGGACCGAGTTGA
[26] R-GTGTGCTTTCGCAATGATCG
ATC15 56 4 1/30 PET 4 187, 205, 208, 211 [26] F-AAAGATTCATGAAGGATGTTGATCG
[26] R-GCCTACAAATTCAACTGAGGGAAAA
ATT20 56 4 1/30 6FAM 25 190, 226, 229, 232, 235, 238, 241, 244, 247, 250, 253, 256, 259, 262, 265, 268, 271, 274, 277, 280, 283, 286, 289, 292, 295
[26] F-CGGTTAATCTACAAACGAAGTCTTG
[26] R-TTTTTATGTAGTGCTTTTTCAACTTTCA
Tais the annealing temperature in PCR;Ais the total number of observed alleles. Loci were amplified in duplexes or as singletons; compatible loci were pooled into a single loading mix before being run on an AB3730. The KRGinv locus was removed from this study due to linkage disequilibrium with PNC153 and amplification of >2 alleles in individuals from some populations.
a
infestations in southern Texas. We focused our analysis on a subset of collections from seven properties that were sampled repeatedly over time, with at least 30 days separ-ating each collection (Table 1, collection subset“TA”). We
evaluated genetic differentiation for all pairwise FST
comparisons of collections sampled at individual properties (e.g., we did not use among-property comparisons). The FSTof each collection pair was estimated using θ [35] in
the program FSTAT, with 20,000 randomized permutations for significance testing (α= 0.05). In restricting our analyses to within single properties we controlled for the effects of isolation by distance (IBD). However, the TAcollection
sub-set did not provide enough repeated temporal samples from any single property to robustly test a correlation ofθversus time with a Mantel test. Thus, we extended the temporal analysis to include multiple properties located near two infestation foci from the TA subset, Prop11 (Zapata Co.)
and Prop34 (Starr Co.). These neighborhoods experienced chronic tick infestations from 2007–2010 (Table 1, collection subset“TB”). The size of both neighborhoods was limited to
a diameter of 4 km to minimize the effect of IBD. In this sec-ond dataset, we comparedθvalues versus time (months) to check for a positive relationship using the Mantel test option in the program IBD (Isolation by Distance) [36]. Because we were not interested in testing genetic differentiation between the two neighborhoods, we only used within-neighborhood comparisons.
Question 2: Ticks from WTD vs. cattle
A central goal of this study was to determine whether southern cattle ticks at any single location use cattle and WTD indiscriminately, or instead segregate according to host. Ideally Question #2 would be answered by compar-ing genetic differentiation (FST) between ticks sampled
from WTD and cattle at the same property and time, such as the paired Rm47-Rm48 collections (Table 1). However, paired samples of this kind are rare due to the large amount of effort required to sample ticks from WTD. Thus, we included five additional collection pairs that minimized spatial and temporal separation of ticks collected from WTD and cattle (Table 1, collection subset “D”). We estimated pairwise FST between each
WTD-cow collection pair using θ and generated 95% bootstrap confidence limits in FSTAT. Confidence limits that overlapped with zero would be indicative that ticks collected from both hosts in the same pas-ture (or neighboring paspas-tures) share a common gene pool. As a supporting analysis for Question #2, we also used the large Rm47 collection (n= 171) to establish the baseline level of genetic structure among ticks sampled from 10 individual WTD. These ten tick infrapopulations control for spatial and temporal vari-ation and allow us to evaluate the level ofFSTvariance
within a single property (Prop39).
Question #3: Multiple introductions and tick movements in Texas
The remaining analyses in our study were focused on Question #3. An important goal was to estimate the number of genetic populations in the quarantine zone and find if genetic admixture occurs. All 1,247 ticks (Table 1, collection set “S”) were used in assignment tests with STRUCTURE [19]. We set Bayesian parameters to assume both genetic admixture and correlated allele frequencies in the study system, and to ignore collec-tion locacollec-tions. These parameters were run atKvalues from 1–47 with 25,000 burn-in iterations followed by 100,000 run iterations. The Bayesian analysis was re-peated five times for eachK. The resulting log(Prob K) values were analyzed with the delta-K method [37] to estimate the most likely number of genetic popula-tions. We assigned ticks to a specific genetic group if their probability of membership (Q) was≥0.95.
Southern cattle ticks from all 63 collections were used to estimate basic descriptors of genetic diversity, including allelic richness (A), observed heterozygosity (HO), and expected heterozygosity (HE) using GENALEX
[38]. As ana posterioritest of genetic diversity in the study system, we compared HO among core genetic groups
identified in the STRUCTURE analysis using FSTAT (option“Comp. among groups of samples”).
To address questions about tick genetic structure and IBD in Texas, we used collections from 2008 (n= 13) and 2009 (n= 25) (Table 1, collection subset“I”). We an-alyzed these two years separately to reduce variation due to time, since 2–3 tick generations may occur between years. Original collections were used for analyses of glo-bal and pairwiseFST (i.e. we ignored the genetic groups
estimated by STRUCTURE). We used FSTto estimateθ
in the program FSTAT; to reduce variance in these esti-mates we omitted collections withn< 10. We tested for an IBD pattern using reduced major axis (RMA) regres-sion implemented in the IBD program [36], with geo-graphic distance (in km) as the independent variable and a transformedFSTcoefficient,FST/(1- FST) [39], as
the dependent variable. Because host species has been shown to play a significant role in IBD patterns in R. microplus from New Caledonia, we tested the slope of our regression against these published estimates [40]. To make our variables directly comparable to that study, we 1) performed a natural logarithm transformation of geographic distance, 2) separated datasets into cow-only and WTD-only, 3) removed pairwise comparisons that re-sulted inFST= 0, and 4) generated 95% confidence
inter-vals for each slope using GENEPOP.
Results
three of these were located outside of the TEQA. The level of resistance was generally low for all acaricides ex-cept permethrin. Resistance to permethrin was medium to high in seven collections (Rm21, Rm26, Rm27, and Rm29-Rm32) located in eastern Zapata Co. (Figure 1). The level of resistance was similar to that reported for other pyrethroid-resistant field populations from the U.S. and Mexico [18,41]. Resistance to multiple acaricides was also observed, including low-level coumaphos resistance in collections Rm21, Rm27, and Rm32. The higher con-centration in our LPTs (0.32% coumaphos) simulates the concentration of active ingredient used in the border dip-ping vats (0.3% coumaphos); however, the exposure time is greater during LPTs (24 hrs).
All 1,247 ticks in this study had previously been morpho-logically identified by USDA personnel asR. microplus, and the mitochondrial qPCR assay correctly identified every specimen. Furthermore, the assay correctly identified 407 R. annulatus samples morphologically identified for another study [26]. In validating the identity of all R. microplusin our study, we demonstrate the usefulness of this molecular tool for future studies of field-sampled R. microplusand R. annulatuslarvae and nymphs, which are difficult to resolve using morphology alone. Since our validation only included North American samples, we do not know if the SNP assay will be species-specific inR. microplusandR. annulatusfrom other parts of the world. Thus, we emphasize the importance of validating this assay on morphologically verified voucher specimens of both species before using it.
Validation tests on the 12 markers detected one prob-lem locus, KRGinv (Table 2). This locus was out of Hardy-Weinberg equilibrium in 5 of 14 collections, had linkage disequilibrium with PNC153 in 9 of 14 collections, and amplified >2 alleles in three collections. Thus, we re-moved this marker and used the remaining 11 loci. We checked for allele scoring errors by comparing independent PCR replicates of each locus on a subset of 188 ticks. From a total of 4,136 possible allele calls (188 individuals x 11 loci x 2 alleles per diploid individual) we found 12 that were incorrect, yielding an error rate estimate of 0.3%.
Question 1: Temporal genetic stability
Our temporal analysis suggests that southern cattle ticks often persist for multiple generations at chronically infested locations. At seven individual properties sampled repeatedly over time (collection subset TA), most pairwiseθ values
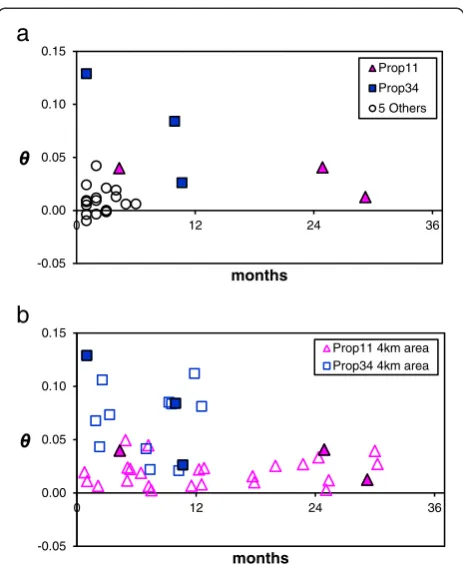
were <0.05 (Figure 2a), and 16 of 24 were not signifi-cantly greater than zero. The largest time span between two collections at any single property was 29 months (Rm12 and Rm14 from Prop11), which resulted in surpris-ingly little genetic differentiation (θ= 0.012, p = 0.017). Our second time-series analysis (collection subset TB:
4 km neighborhoods at Prop11 and Prop34) uncovered
significant genetic differentiation (Figure 2b), but it was not correlated with time (Prop11 Mantel r = 0.16, p = 0.24; Prop34 Mantel r =−0.004, p = 0.53). The magnitude of differentiation in the Prop11 area (globalθ= 0.02, 95% CI [0.011, 0.029]) was about one-third of that in the Prop34 area (globalθ= 0.065, 95% CI [0.049, 0.081]). Since neither globalθestimate overlapped with the 95% CI of the other, the difference in genetic differentiation within neighbor-hoods was significant. Of particular interest in this analysis was the difference in the range of θ values found within each neighborhood (low variance among Prop11 compari-sons and high variance among Prop34 comparicompari-sons). This indicates that the amount of temporal genetic dif-ferentiation on a local scale (4 km) is highly labile and
a
b
-0.05 0.00 0.05 0.10 0.15
0 12 24 36
months
Prop11 Prop34 5 Others
-0.05 0.00 0.05 0.10 0.15
0 12 24 36
months
[image:8.595.306.538.86.369.2]Prop11 4km area Prop34 4km area
Figure 2Isolation over time in Texas collections ofRhipicephalus
microplus.Tick samples include collections from cattle and white-tailed deer.Panel a)pairwiseFSTcomparisons over time within seven
individual properties (see Table 1, collection subset“TA”). Each
individual point is a pairwiseθvalue between two collections at a single property, which controls for spatial variation. Filled pink triangles denote pairwise comparisons within Prop11 in Zapata Co.; filled blue squares denote pairwise comparisons within Prop34 in Starr Co.; open circles represent pairwise comparisons within five other properties sampled over shorter time intervals.
Panel b)pairwiseFSTcomparisons for collections sampled within
a 4 km neighborhood around Prop11 (Zapata Co.) or Prop34 (Starr Co.) (see Table 1, collection subset“TB”). Symbol definitions are the same as
may depend on persistence history and gene flow from outside sources.
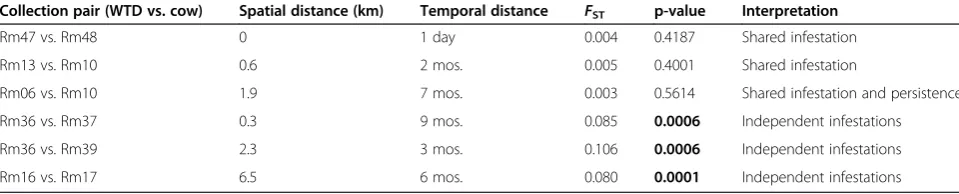
Question 2: Ticks from WTD vs. cattle
An important analysis for the tick eradication program was the test of genetic differentiation in six paired col-lections from WTD and cattle. The best paired sample to address this question is Rm47-Rm48, where south-ern cattle ticks from WTD and cattle from the same pasture (Prop39) were sampled just one day apart. No genetic differentiation exists between these two collec-tions (Table 3), which suggests that a single source of ticks infested both host species. The Rm47 collection was sampled from 10 WTD, and we detected a small but significant level of differentiation among these 10 infrapopulations (globalθ= 0.01, 95% CI = 0.002, 0.019). Upon closer examination, this differentiation was driven by the ticks from one deer (Rm47-26) that displayed much higher pairwise θ values (0.04-0.107) than any other infrapopulation (Additional file 2: Table S2). It is possible this deer may have acquired its ticks at a different location before dispersing to Prop39. The other nine infrapopulations did not show significant population structure (θ values −0.006 to 0.034). This pattern is consistent with the prediction by Chevillon et al. [42] that infrapopulation is not an important level of genetic differentiation in R. microplus. When cattle-derived ticks of the Rm48 collection were com-pared to these nine infrapopulations from WTD, an even smaller range ofθvalues (−0.002 to 0.017) was observed (Additional file 2: Table S2).
We could not strictly control for the effects of space and time in the remaining paired tick collections from WTD and cattle (Table 3). However, two additional comparisons displayed a lack of genetic differentiation, despite a separation of up to 1.9 km and 7 months. In contrast, tick collections separated by more than 2 km or 9 months display a marked rise in genetic structure, reflecting the overall IBD pattern in Texas (see IBD analysis below).
Question #3: Multiple introductions and tick movements in Texas
The Bayesian analysis in STRUCTURE suggests the ex-istence of four main genetic groups in southern Texas (Additional file 3: Figure S1 and Additional file 4: Figure S2). These four genetic partitions include: 1) the “green”group of northeastern Zapata Co., which has permethrin-resistant ticks; 2) the“yellow”group of Starr Co., which was found in both TPQAs; 3) the “blue” group; and 4) the “red” group (Figure 1). A total of 750 ticks (60%) assigned to one of these four groups at Q≥0.95. The remaining ticks (n= 497 from 30 collections) did not assign to any single genetic group at this level of confidence. Rather, their membership probabilities were partitioned across multiple groups and indicate widespread admixture in the TEQA (shown as light blue markers in Figure 1). The green and yellow genetic groups were the most clearly defined, with at least 93% of individuals assign-ing at Q≥0.95 (Additional file 5: Table S3). Genetic structure was essentially zero among green collections (globalθ= 0.009, 95% CI [−0.002, 0.025]) and very low among all but one of the yellow collections (globalθ= 0.06, 95% CI [−0.019, 0.124]). We also identified candi-date diagnostic alleles in six microsatellite loci that had frequency signatures specific to single genetic groups (Additional file 5: Table S3). For example, the 172 bp allele of locus PNC153 is fixed at a frequency of 1.0 in both blue collections, is fixed at 0 in all 13 green collec-tions, and exists at intermediate frequencies (0.16-0.57) in the red and yellow collections.
[image:9.595.57.537.620.717.2]Genotype data allowed us to track dispersal events of the yellow and blue groups that resulted from cattle transport. According to APHIS cattle traces and livestock sale records, yellow group ticks appear to have been spread from a prop-erty adjacent to Prop42 (collections Rm51-Rm57) in west-ern Starr Co. and were transported 39 km southeast to Prop44 (Rm59) on three cows purchased in October 2007. By April 2009, ticks had spread from Prop44 to adjacent pastures (including Prop40 [Rm49] and Prop45 [Rm60-62]) and resulted in the establishment of a new TPQA in Starr
Table 3 Comparisons of genetic differentiation in paired collections ofRhipicephalus microplusticks sampled from white-tailed deer (WTD) and cattle in southern Texas
Collection pair (WTD vs. cow) Spatial distance (km) Temporal distance FST p-value Interpretation
Rm47 vs. Rm48 0 1 day 0.004 0.4187 Shared infestation
Rm13 vs. Rm10 0.6 2 mos. 0.005 0.4001 Shared infestation
Rm06 vs. Rm10 1.9 7 mos. 0.003 0.5614 Shared infestation and persistence
Rm36 vs. Rm37 0.3 9 mos. 0.085 0.0006 Independent infestations
Rm36 vs. Rm39 2.3 3 mos. 0.106 0.0006 Independent infestations
Rm16 vs. Rm17 6.5 6 mos. 0.080 0.0001 Independent infestations
and Hidalgo Cos. (see Figure 1). In the same way, we were able to correctly assign 33 known traceback ticks of the blue genetic group (Rm43) back to their source at Prop37. These movements occurred in April 2008, when tick-infested cattle from Prop37 were inadvertently transported to three feedyards in central and eastern Texas up to 200 miles from the TEQA (Figure 1 inset). The STRUCTURE analysis correctly assigned 30 of these traceout ticks back to Rm43 with a high level of confidence (Q≥0.95) and the final three ticks at a slightly lower level (Q= 0.91-0.94). Of course, the source of these 33 ticks was already known, but in another case we found a previously unsuspected connection between Rm43 and ticks sampled three weeks later at Prop46 (Rm63). Each Rm63 tick (n= 3) assigns to the blue group with very high confidence (Q> 0.98), even though these two locations are separated by 120 km. The two locations also share three diagnostic alleles at two loci (PNC153 allele 172 and PNC75 alleles 145/147; see Additional file 5: Table S3). A follow-up check of APHIS field records revealed that Rm63 was indeed the result of a single infested cow from Prop37 (Rm43) that had been transported to Prop46 (Rm63) in February of 2008.
The STRUCTURE analysis identified two additional migrants that would not have been detected without genetic data. The first assigned with very high confi-dence (Q= 0.978) to the green genetic group of north-eastern Zapata County, but was sampled with collection Rm50 (Prop41) 27 km from the nearest known green collection (Rm32). By way of comparison, the greatest span between any two collections in the green group is 16 km. To validate this result, we re-extracted DNA from the remaining half of the frozen tick and generated a new multilocus genotype; this second genotype is identical to the first. Additional green group migrants may have been sampled at Prop41, because a small per-centage of ticks survived the LPT test for permethrin (see results for Rm50 in Additional file 1: Table S1). A second unknown migrant in our study assigned primarily to the blue genetic group (Q= 0.88), but was sampled with collection Rm30 (green). The closest source of southern cattle ticks with a high proportion of blue individuals is the TEQA, about 33 km distant. We also validated this second migrant by re-genotyping it from a new DNA extraction. We may have sampled other migrants in our 63 collections but, if so, they were less obvious and did not assign to any single genetic group with a high level of confidence.
Measures of genetic diversity were low to moderate in southern Texas. The average number of alleles per locus ranged from 1.2-6.1 (Additional file 6: Table S4), and was often higher in collections closer to the Rio Grande (Additional file 7: Figure S3a). Tick collections from the green, yellow, and blue genetic groups displayed the smallest values ofA, with an average of about two alleles per locus. This is similar to the small number of alleles
(2.3-3.5) reported for isolated R. microplus infestations in an eradication area of New South Wales, Australia [30] and may indicate that these genetic groups experienced bottlenecks during establishment. Values ofHOranged from
0.18-0.54 (Additional file 6: Table S4 and Additional file 7: Figure S3b). In the FSTAT test for among-group differences inHO, we omitted tick collections that 1) were not clearly
assigned to one of the four genetic groups (see Figure 1), and/or 2) had sample sizes ≤5. A global test among the four core genetic groups revealed a significant difference (p = 0.023) in meanHO. This pattern was driven primarily
by the green group (meanHO= 0.31), which had anHO
much lower than the others (mean HO: yellow = 0.41,
blue = 0.43, red = 0.47).
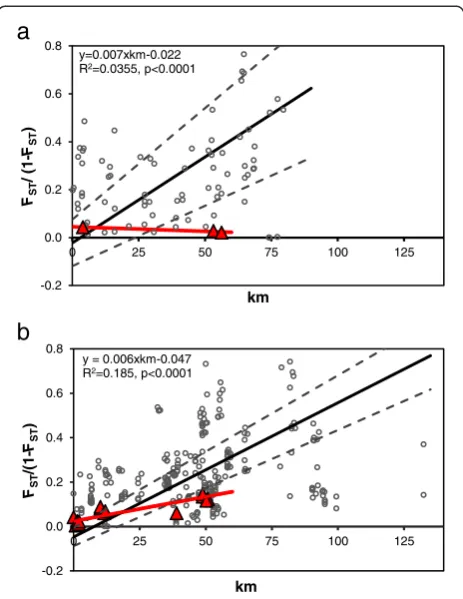
We observed moderate to high genetic differentiation amongR. micropluscollections in southern Texas. Global estimates of meanFSTwere greater in 2008 (θ= 0.22, 95%
CI [0.19, 0.26] than 2009 (θ= 0.16, 95% CI [0.14, 0.17]). The genetic structure in the quarantine zone shows an overall pattern of IBD (Figure 3), however, a large amount of variation is present and produced low R2values. Al-though the meanFST estimates were different between
years, the IBD slopes did not differ (2008 b = 0.007, 95% CI [0.0055, 0.0088]; 2009 b = 0.006, 95% CI [0.0054, 0.0067]). Interestingly, the WTD slopes for 2008 (b =−0.00039) and 2009 (b = 0.0022) were both significantly lower than the slope for all pairwise comparisons. Admittedly, the 2008 WTD sample size was low (three pairwise comparisons), but the 2009 WTD results indicate that deer may move southern cattle ticks farther than cattle, thereby decreasing the magnitude of genetic structure over distance. Signifi-cant genetic differentiation was rarely observed in pairwise comparisons≤4 km, indicating genetic homogenization in local gene pools.
After removing comparisons with zero genetic distance and performing a natural logarithm transformation of geographic distances, we found the IBD slope of Texas R. microplussampled from cattle in 2008 (b = 0.066, 95% CI [0.050, 0.088]) and 2009 (b = 0.076, 95% CI [0.0536, 0.106]) was significantly higher than ticks from cattle in New Caledonia (b = 0.0017), and more similar to ticks from wild rusa deer (b = 0.0637) [40]. In contrast, the IBD slope in WTD ticks from 2008 (b =−0.007, 95% CI [−0.028, 0.006]) and 2009 (b = 0.028, 95% CI [0.016, 0.059]) were lower than rusa deer from New Caledonia. This is an interesting out-come, and suggests that wild WTD may moveR. microplus ticks farther on average than wild rusa deer.
Discussion
and Mexico have met similar difficulties [30,40,42-44]. Population genetic approaches provide a powerful means to infer the invasion history and movement of arthropod pests and parasites [45,46]. We have used genetic data to reveal patterns of southern cattle tick persistence and spread, which will provide the CFTEP with key informa-tion on genetically linked infestainforma-tions in southern Texas.
Temporal genetic stability
Despite extensive efforts to eradicate tick infestations on cattle as soon as they are detected,R. microplusremains ecologically established in the TEQA of southern Texas. Understanding the mechanisms that lead to tick persistence is a central concern for the CFTEP. We investigated this problem by quantifying genetic differentiation over time while controlling for spatial variation. At seven individual properties genetic structure was very low (most θ <0.05) over short timespans (Figure 2a). This pattern was observed
up to 29 months and suggests most samples came from persistent tick gene pools. WTD can support serial genera-tions ofR. microplus[7,20], therefore, persistence probably occurs even when ticks are regularly eliminated from cattle herds. A recent study found tick-infested WTD were com-mon on low-fence properties in southern Zapata Co. that had been vacated of cattle for years [6]. Two low-fence properties in our study (Prop10 and Prop11) were known to be inhabited by infested WTD; the Rm14 collection from Prop11 is a sample of these WTD ticks. Despite intensive acaricide treatment of cattle at Prop10 and pasture vacation at Prop11, clean cattle at both locations quickly became re-infested (sampled in collections Rm10-Rm11 and Rm13). Because infestations on cattle are eradicated rapidly once found, other hosts, especially WTD, are more likely to be responsible for tick persistence over time.
Our temporal analyses suggest that two different mechanisms can lead to cattle fever tick persistence in southern Texas. In the first (mechanism #1), local tick populations persist on wildlife and result in a stable gene pool over time. In the other (mechanism #2), a cycle of eradication/reduction followed by serial re-infestation from genetically diverse sources leads to a rapidly chan-ging gene pool. We found evidence of both mechanisms with our second temporal analysis (TB), which included
collections sampled near two chronically infested prop-erties, Prop11 and Prop34 (Figure 1; collections Rm06-Rm15 and Rm36-Rm41). Both neighborhoods included tick collections from cattle and WTD. In the Zapata Co. neighborhood, mean genetic differentiation remained quite low (pairwiseθ= 0-0.05) over a 30-month window, suggesting multi-year persistence of the local gene pool by wildlife and/or cattle with minimal gene flow from outside genetic sources (Figure 2b). In contrast, the amount of genetic differentiation within the Starr Co. neighborhood was greater (pairwiseθ= 0.02-0.13) over a shorter time span (just 12 months). This is important because, as noted in the pairwise comparisons among infrapopulations from Rm47, repeated sampling from a single genetic source of ticks will recover relatively low variation inθ values (0–0.034). Thus, larger variation in θ may suggest that the Starr Co. neighborhood is experiencing rapid genetic change, possibly due to eradication/reduction followed by re-infestation from genetically distinct sources in the TEQA or Mexico (population replacement). The ability to use genetic patterns to distinguish between these two mechanisms of persistence will be useful in tailoring strategies for tick control. At properties where mechanism #2 dominates, monitoring and restricting transportation of infested cattle may be effective at preventing re-infestation after eradication. In areas where mechanism #1 is more important, tick eradication on WTD and other wildlife will be required.
a
b
-0.2 0.0 0.2 0.4 0.6 0.8
0 25 50 75 100 125
FST
/
(1-FST
)
km
y=0.007xkm-0.022 R2=0.0355, p<0.0001
-0.2 0.0 0.2 0.4 0.6 0.8
0 25 50 75 100 125
FST
/(
1
-FST
)
km
[image:11.595.58.290.87.387.2]y = 0.006xkm-0.047 R2=0.185, p<0.0001
Figure 3Isolation by distance in Texas populations of
Rhipicephalus microplusticks collected during two years of high infestation rates, a) 2008 and b) 2009.Open grey circles denote all possible pairwise comparisons of ticks from all hosts (cattle and white-tailed deer [WTD]). Closed red triangles denote comparisons among ticks from WTD only. PairwiseFSTestimates from FSTAT (θ)
were transformed toFST/(1-FST) according to the method of
Ticks from WTD vs. cattle
Controlling ticks on wildlife has now become critical to efforts to eradicate cattle fever ticks because our genetic data suggest WTD likely serve as a source for ticks on cattle. The opposite situation (cattle serving as a source for ticks on WTD) is probably rare in the TEQA because cattle (and horses) are inspected and treated intensively. As such, under the CFTEP treatment strategy cattle have functionally become a dead-end host. On a local scale, R. micropluscollected from WTD and cattle in the same pasture share a single gene pool. The best paired collec-tion of ticks was sampled from a single property in Starr Co. (Prop 39), where ticks from WTD (Rm47) and cattle (Rm48) were collected just one day apart. These ticks are not genetically differentiated and clearly originate from a common source. In fact, the ticks collected from cattle displayed a smaller amount of variation in all pair-wise comparisons with WTD ticks than was observed among the nine most similar WTD infrapopulations (Additional file 2: Table S2). A complete lack of genetic differentiation between ticks from the two hosts can be seen in paired samples separated by up to 2 km and 7 months. From this, we infer each source is a local population of ecologically established ticks, which can infest “clean” cattle even after a pasture has been va-cated for years. We did find paired WTD-cow tick col-lections that were significantly differentiated. However, these samples were more widely separated in space and/or time, and probably result from the movement of genetically dissimilar ticks onto a neighboring prop-erty between sampling sessions, as inferred in our tem-poral analysis. In terms of the eradication program, this genetic dataset validates an ecological situation that field personnel have suspected for a long time (USDA-APHIS, Ed Bowers Pers. Comm.), and emphasizes that long-term control strategies must account for WTD as a source of southern cattle ticks on cattle.
Multiple introductions and tick movements in Texas
R. microplus has likely been introduced to southern Texas on multiple occasions and these introductions ap-pear to be associated with two main dispersal mechanisms. The assignment tests predict the existence of four major genetic groups ofR. microplusin southern Texas. The most well-defined genetic groups (green and yellow) occur out-side the TEQA, in an area that was free of ticks until 2007. In contrast, every collection situated within the TEQA (close to the Rio Grande) displays a signature of genetic ad-mixture (Additional file 3: Figure S1; denoted as light blue markers in Figure 1). This dichotomous pattern may be the result of frequent short-distance host movements along and across the Rio Grande in the vicinity of the TEQA, and rare long-distance transport from outside of the study area to locations north of the TEQA.
Within the TEQA, genetic admixture of southern cattle ticks is likely due to local movements of WTD and stray cattle. The Rio Grande is a natural corridor for wildlife movement along both banks and is only a weak barrier to WTD, which are known to cross the river in both direc-tions [21]. Such movements would promote genetic admix-ture among tick populations on both sides of the border. This could also lead to increased levels of genetic diversity (AandHO), which, in this study, tended to be higher in
lo-cations adjacent to the river (Additional file 7: Figure S3). The movement of stray and smuggled livestock could also increase gene flow along and across the Rio Grande be-cause 40-90% of intercepted cattle are infested with R. microplus[47]. Two of our collections (Rm01 and Rm33) were sampled from stray Mexican cattle intercepted in the US. Both demonstrate the signature of genetic admixture found inside the TEQA. Although the cattle could have acquired ticks after crossing to Texas, it is likely that at least some of their ticks were acquired in northern Mexico and represent the genetic variation found on the Mexican side of the Rio Grande. Any new infestations north of the TEQA that arise from the Rio Grande corridor should carry this particular signature of admixture. Indeed, we found this general pattern in Rm17, Rm50, and Rm40-Rm42 (Figure 1). The red (Rm44-Rm48) and blue (Rm43) genetic groups are also situated relatively near the Rio Grande and may be the result of short-distance movements from this area. In the TEQA, the blue gene pool is commonly represented in admixed populations (Additional file 3: Figure S1); to a lesser extent the same is true for the red genetic group. Therefore, it is possible the“pure”blue and red groups are semi-isolated infestations that originated from the Rio Grande corridor. Over time, we expect that admixture with neighboring genetic groups will remove the distinct genetic signatures of the blue and red groups.
and the greater distance of these infestations from the TEQA.
Acaricide resistance is a major threat to the eradica-tion program, which is almost completely dependent on chemical control, and we found acaricide resistance in all four genetic groups. One of the most distinct genetic groups found outside the TEQA, the green group (Figure 1), includes collections that are resistant to single and multiple acaricide classes. Three of the permethrin-resistant green collections also had low-level resistance to coumaphos, the acaricide used to dip all cattle imports from Mexico. This provides additional evidence that the source of this infestation is likely in Mexico, where resistance has increased in the last decade due to heavy acaricide use [16,48-50]. One green collection, Rm20, was sampled from two WTD and highlights the risk of this host potentially spreading resistant ticks across property boundaries in areas not under quarantine and therefore not routinely monitored by APHIS inspectors. Thus, WTD are a major concern for the eradication program not just because they decrease the effectiveness of pasture vacation as a control method, but also because they have a great potential to disperse untreated, resistant ticks.
The two main mechanisms of tick movement in southern Texas, common short-distance dispersal and rare long-distance dispersal, appear to be responsible for the IBD pattern we observed across southern Texas (Figure 3). Although the IBD pattern is significant in both 2008 and 2009, the regression coefficients are low to moderate and a large amount of variation is apparent. This variation most likely originates from greater than average movements of cattle and WTD, genetic drift, or a combination of the two. Extreme outlying FST estimates above and below the
regression line always involve ticks from cattle and are known, in some cases, to be the result of humans trans-porting livestock fairly long distances (30–120 km). The documented spread of ticks in the blue and yellow groups across long distances is an example of this dispersal mode. In contrast, local dispersal is probably facilitated more by WTD than cattle, because ticks from this alternate host have a significantly lower IBD slope. This pattern makes sense biologically, given the high population density of WTD in Texas and their relatively unimpeded movement among properties with low fencing.
The WTD in Texas appear to fill a different role in R. microplus dispersal compared to wild rusa deer (Cervus timorensis) in New Caledonia [40]. Rusa deer on that island have small home ranges (~5 km2) and display strong site fidelity over time [51]. As a result, they move ticks relatively shorter distances than Texas WTD and have a correspondingly greater IBD slope [40]. In fact, the IBD slope of ticks from rusa deer (b= 0.0637) is about the same as for ticks from Texas cattle (brange = 0.06-0.07), a host whose local movements are restricted by fences.
Somewhat surprisingly, the flat IBD slope of WTD ticks is more similar to ticks from New Caledonian cattle. Long-distance dispersal of R. microplus on New Caledonia is mediated by the transport of cattle from across the entire island to livestock markets in the city of Bourail. It appears that both hosts (Texas WTD and New Caledonia cattle) promote genetic admixture in ticks that leads to similarly low IBD slopes. Overall, the IBD patterns match what is known about host movement in both systems.
We have developed a large genetic database that can be used to track new infestations back to their most likely source(s). The panel of 11 microsatellite markers allowed us to identify two likely migrants (one from an acaricide resistant infestation) and correctly assign traceout ticks from the yellow and blue groups. Human-mediated movement of ticks in the yellow group in 2007 led to new tick infestations on the eastern border of Starr Co. and the establishment of a new TPQA. The genetic data show an obvious genetic relationship that links yellow group ticks in Starr Co. and validates APHIS records tracing a cattle transfer from the Prop42 neighborhood to Prop44 in October 2007. Another successful genetic traceback analysis was accomplished for the blue group. We correctly assigned 33 traceout ticks intercepted at three feedlots in central Texas back to their known source, Rm43, and found a previously unsuspected connection between Rm43 and Rm63. This discovery provided the starting point for a follow-up investigation by APHIS. The search revealed that Rm63 ticks could be traced back to a single cow purchased at a stockyard auction in February of 2008; the infested cow originated from Prop37 (Rm43). Ticks from this single cow led to the infestation of five additional cattle at Prop46 within a three month period, a sample of which became Rm63. Our ability to provide accurate traceback information highlights the usefulness of molecular tools for tracking cryptic tick movements in southern Texas and elsewhere.
Conclusions
the southern cattle tick has likely been introduced to multiple locations in southern Texas on numerous occa-sions due to a combination of frequent short-distance movements from the Rio Grande corridor and rare long-distance dispersal from Mexico. Third, a number of new infestations are resistant to acaricides, which is a major problem because the CFTEP relies almost exclusively upon chemical control. Unfortunately, the number of resistant populations in Mexico and Texas has been on the rise in the past decade [17,18,52].
Because the genetic data suggest tick movements in southern Texas are common, this study highlights the importance of restrictions on cattle movement and sur-veillance protocols that are already in place where ticks are ecologically established. Genetic tools such as micro-satellite markers can support this goal by identifying the most likely source of migrants and traceout ticks. The genotyping data in this study are one part of a larger genetic database we have developed to study this prob-lem. Other information we have gathered includes geno-typing ticks for single nucleotide polymorphisms (SNPs) associated with acaricide resistance [53,54] and screening for the presence of Babesiaparasites with qPCR [55]. A central goal of our future research is to sample tick populations from cattle-producing regions in Mexico to determine the most probable source of resurgent in-festations in southern Texas. Another major goal is to sample additional time series datasets from properties in the TEQA and Mexico to deepen our understanding of the ecological scenarios that lead to tick persistence in endemic areas. The genetic tools developed in this study will benefit the CFTEP by providing much-needed data regarding the source and spread of cattle fever tick infesta-tions in southern Texas, and provides a framework for similar studies in other regions of the world affected by cattle fever ticks.
Additional files
Additional file 1: Table S1.Percent mortality levels resulting from larval packet tests for 63Rhipicephalus micropluscollections from southern Texas.
Additional file 2: Table S2.Comparison of genetic structure and heterozygosity amongRhipicephalus microplusticks sampled from ten white-tailed deer (collection Rm47).
Additional file 3: Figure S1.Probability of membership (Q) graph from STRUCTURE shown for one example run atK= 4.
Additional file 4: Figure S2.Results of theΔKmethod [37] for determining the most likely number of genetic groups from STRUCTURE output.
Additional file 5: Table S3.Proportion of individual ticks from“pure” collections that assigned to one of the four genetic groups in the STRUCTURE analysis.
Additional file 6: Table S4.Genetic diversity in 63 collections of
R. microplusticks (N = 1,247), including Nei’s unbiased expected
heterozygosity [56].
Additional file 7: Figure S3.Genetic diversity measures versus sample size inRhipicephalus microplusfrom 63 collections in southern Texas.
Competing interests
The authors declare that they have no competing interests.
Authors’contributions
JDB performed the data analyses, supervised all molecular data generation, and drafted the manuscript. NES generated most of the molecular data, with help from RN, JL, and CH. AAA and JG provided new microsatellite markers from a genome sequence. JRG created maps. JF, GB, DB, and PUO provided all DNA samples. RD supervised tick collections and provided CFTEP program data. RJM and RBD conducted larval packet tests and provided tick samples. GAS conceived the study and critically revised the manuscript. DMW conceived the study and provided substantial scientific guidance. All authors read and approved the final manuscript.
Authors’information
JDB is the Assistant Laboratory Director at the Northern Arizona University Center for Microbial Genetics and Genomics (MGGen), where he performs research on population genetics of pathogens, arthropod vectors, and vertebrate hosts. NES, RN, AAA, JL, JG, CH, and JRG were all students of DMW’s research group at Northern Arizona University. JF was a Veterinary Medical Officer at the USDA-ARS in Kerrville, TX, where GB and DB currently work as technical staff. RD is an APHIS Veterinarian and CFTEP Epidemiologist. RJM and RDB are both USDA Research Entomologists who have worked extensively on cattle fever ticks and acaricide resistance in Texas and Mexico; RDB is now retired. PUO is a USDA Research Molecular Biologist at Kerrville, TX, where she investigates arthropod pests that have economic impacts on agricultural livestock. GAS is a Research Entomologist with the USDA Animal Disease Research Unit at Washington State University, who conducts basic and applied research on tick-borne pathogens of domestic animals. DMW is an Associate Professor at NAU whose research program at MGGen is focused on pathogens of humans and animals.
Acknowledgements
We thank USDA-APHIS mounted patrol inspectors for collecting field samples used in this study. We are grateful to Mr. Ed Bowers, Director of Field Operations (CFTEP) for providing field records of infested properties and valuable insight into the eradication program. This work was supported by USDA-NIFA Grant 2010-65104-20386. The USDA is an equal opportunity provider and employer. Use of trade, product, or firm names does not imply endorsement by the US Government.
Author details
1Center for Microbial Genetics and Genomics, Northern Arizona University, 1298 S Knoles Drive, PO Box 4073, Flagstaff, AZ 86011, USA.2USDA, ARS, Knipling-Bushland United States Livestock Insects Research Laboratory, 2700 Fredericksburg Rd, Kerrville, TX 78028, USA.3USDA-APHIS, Veterinary Services, 903 San Jacinto Blvd., Room 220, Austin, TX 78701, USA.4USDA, ARS, SPA, Cattle Fever Tick Research Laboratory, Moore Air Base, Building 6419, 22675 N. Moorefield Road, Edinburg, TX 78541, USA.5USDA, ARS, Animal Disease Research Unit, Washington State University, Pullman, WA 99164, USA.
Received: 11 December 2013 Accepted: 12 April 2014 Published: 17 April 2014
References
1. Bram RA, George JE, Reichard RE, Tabachnick WJ:Threat of foreign arthropod-borne pathogens to livestock in the United States.J Med
Entomol2002,39(3):405–416.
2. Heekin AM, Guerrero FD, Bendele KG, Saldivar L, Scoles GA, Gondro C, Nene V, Djikeng A, Brayton KA:Analysis ofBabesia bovisinfection-induced gene expression changes in larvae from the cattle tick,Rhipicephalus
(Boophilus)microplus.Parasite Vectors2012,5:162.
3. Graham OH, Hourrigan JL:Eradication programs for the arthropod parasites of livestock.J Med Entomol1977,13(6):629–658. 4. Smith T, Kilborne FL:Investigations into the nature, causation and
of Animal Industry for the Year 1892.Washington: U.S. Department of Agriculture; 1893:177–304.
5. Curtice FC:The cattle tick quarantine line and what can be done to move it.Southern Planter1896,65(6):444–447.
6. Pound JM, George JE, Kammlah DM, Lohmeyer KH, Davey RB:Evidence for role of white-tailed deer (Artiodactyla: Cervidae) in epizootiology of cat-tle ticks and southern catcat-tle ticks (Acari: Ixodidae) in reinfestations along the Texas/Mexico border in south Texas: a review and update.J Econ
Entomol2010,103(2):211–218.
7. George JE:Wildlife as a constraint to the eradication ofBoophilusspp. (Acari: Ixodidae).J Agr Entomol1990,7:119–125.
8. Giles JR:Predicting the invasion potential of cattle fever ticks in southern Texas
using ecological niche modeling.Flagstaff, AZ: Northern Arizona University;
2012.
9. Giles JR, Peterson AT, Busch JD, Olafson PU, Scoles GA, Davey RB, Pound JM, Kammlah DM, Lohmeyer KH, Wagner DM:Invasive potential of cattle fever ticks in the southern United States.Parasit Vectors2014,7:189.
10. De León AA P, Strickman DA, Knowles DP, Fish D, Thacker E, de la Fuente J, Krause PJ, Wikel SK, Miller RS, Wagner GG, Almazán A, Hillman R, Messenger MT, Ugstad PO, Duhaime RA, Teel PD, Ortega-Santos A, Hewitt DG, Bowers EJ, Bent SJ, Cochran MH, McElwain TF, Scoles GA, Suarez CE, Davey R, Howell Freeman JM, Lohmeyer K, Li AY, Guerrero FD, Kammlah DM,et al:
One Health approach to identify research needs in bovine and human babesioses: workshop report.Parasit Vectors2010,3:36. http://www.parasi-tesandvectors.com/content/3/1/36.
11. Peel DS, Mathews KH Jr, Johnson RJ:Trade, the expanding Mexican beef industry, and feedlot and stocker cattle production in Mexico.United States
Department of Agriculture Economic Research Service Report LDP-M-206-01;
2011, 24 pages. Accessed Apr. 14, 2014. http://www.ers.usda.gov/media/ 118317/ldpm20601.pdf.
12. Skaggs R, Acuña R, Torell LA, Southard L:Live cattle exports from Mexico into the United States: Where do the cattle come from and where do they go?InChoices: The Magazine of Food, Farm, and Resource Issues.vol. 1 Quarterth edition. Edited by Darien IL. Milwaukee, Wisconsin: American Agricultural Economics Association; 2004:25–30.
13. Rosario-Cruz R, Almazan C, Miller RJ, Dominguez-Garcia DI, Hernandez-Ortiz R, de la Fuente J:Genetic basis and impact of tick acaricide resistance.
Front Biosci2009,14:2657–2665.
14. Miller RJ, Li AY, Tijerina M, Davey RB, George JE:Differential response to diazinon and coumaphos in a strain ofBoophilus microplus(Acari: Ixodidae) collected in Mexico.J Med Entomol2008,45(5):905–911.
15. Rodriguez-Vivas RI, Alonso-Diaz MA, Rodriguez-Arevalo F, Fragoso-Sanchez H, Santamaria VM, Rosario-Cruz R:Prevalence and potential risk factors for organophosphate and pyrethroid resistance inBoophilus microplusticks on cattle ranches from the State of Yucatan, Mexico.Vet Parasitol2006,
136(3–4):335–342.
16. Fernandez-Salas A, Rodriguez-Vivas RI, Alonso-Diaz MA:First report of a
Rhipicephalus microplustick population multi-resistant to acaricides and ivermectin in the Mexican tropics.Vet Parasitol2012,183(3–4):338–342. 17. Miller RJ, Davey RB, George JE:First report of organophosphate-resistant
Boophilus microplus(Acari: Ixodidae) within the United States.J Med
Entomol2005,42(5):912–917.
18. Miller RJ, Davey RB, George JE:First report of permethrin-resistant
Boophilus microplus(Acari: Ixodidae) collected within the United States.
J Med Entomol2007,44(2):308–315.
19. Pritchard JK, Stephens M, Donnelly P:Inference of population structure using multilocus genotype data.Genetics2000,155(2):945–959. 20. Kistner TP, Hayes FA:White-tailed deer as hosts of cattle fever-ticks.
J Wildlife Dis1970,6(4):437–440.
21. Currie C:Influence of white-tailed deer on cattle fever tick eradication efforts in
Southern Texas.Kingsville: Dissertation. Texas A & M University; 2013.
22. McDonald JS, Miller KV:White-tailed deer restocking in the United States 1878
to 2004.Bogart, GA: The Deer Management Association; 2004.
23. FAO:Recommended methods for the detection and measurement of resistance of agriculural pests to pesticides-tentative method for larvae of cattle ticks,Bophilus microplusspp. FAO method No. 7.InFAO Plant
Proceedings Bulletin.vol. 19th edition. Rome, Italy: Food and Agriculture
Organization of the United Nations; 1971:15–18.
24. Black WC, Piesman J:Phylogeny of hard- and soft-tick taxa (Acari: Ixodida) based on mitochondrial 16S rDNA sequences.P Natl A Sci USA1994,
91(21):10034–10038.
25. Labruna MB, Naranjo V, Mangold AJ, Thompson C, Estrada-Pena A, Guglielmone AA, Jongejan F, de la Fuente J:Allopatric speciation in ticks: genetic and reproductive divergence between geographic strains ofRhipicephalus
(Boophilus)microplus.BMC Evol Biol2009,9:46.
26. Araya-Anchetta A:A study of macro and micro-evolutionary factors
determining population genetics in ticks. Dissertation.Flagstaff: Northern
Arizona University; 2012.
27. Faircloth BC:MSATCOMMANDER: detection of microsatellite repeat arrays and automated, locus-specific primer design.Mol Ecol Resour2008,8(1):92–94. 28. Chigagure NN, Baxter GD, Barker SC:Microsatellite loci of the cattle tick
Boophilus microplus(Acari: Ixodidae).Exp Appl Acarol2000,24(12):951–956. 29. Koffi BB, Risterucci AM, Dominique J, Durand P, Barre N, De Meeus T,
Chevillon C:Characterization of polymorphic microsatellite loci within a youngBoophilus micropluspopulation.Mol Ecol Notes2006,6:502–504. 30. Cutulle C, Jonsson NN, Seddon J:Population structure of Australian
isolates of the cattle tickRhipicephalus(Boophilus)microplus.Vet Parasitol 2009,161(3–4):283–291.
31. Rousset F:GENEPOP'007: a complete re-implementation of the genepop software for Windows and Linux.Mol Ecol Resour2008,8(1):103–106. 32. Goudet J:FSTAT, a program to estimate and test gene diversities and
fixation indices (version 2.9.3.2).2002. Available from: http://www2.unil.ch/ popgen/softwares/fstat.htm.
33. Beaumont MA, Balding DJ:Identifying adaptive genetic divergence among populations from genome scans.Mol Ecol2004,13(4):969–980. 34. Van Oosterhout C, Hutchinson WF, Wills DPM, Shipley P:MICRO-CHECKER:
software for identifying and correcting genotyping errors in microsatellite data.Mol Ecol Notes2004,4(3):535–538.
35. Weir BS, Cockerham CC:Estimating F-statistics for the analysis of population structure.Evolution1984,38(6):1358–1370.
36. Bohonak AJ:IBD (Isolation by Distance): a program for analyses of isolation by distance.J Hered2002,93(2):153–154.
37. Evanno G, Regnaut S, Goudet J:Detecting the number of clusters of individuals using the software STRUCTURE: a simulation study.Mol Ecol 2005,14(8):2611–2620.
38. Peakall ROD, Smouse PE:GENALEX 6: genetic analysis in Excel. Population genetic software for teaching and research.Mol Ecol Notes2006,
6(1):288–295.
39. Rousset F:Genetic differentiation and estimation of gene flow from F-statistics under isolation by distance.Genetics1997,145(4):1219–1228. 40. De Meeus T, Koffi BB, Barre N, De Garine-Wichatitsky M, Chevillon C:Swift sympatric adaptation of a species of cattle tick to a new deer host in New Caledonia.Infect Genet Evol2010,10(7):976–983.
41. Rosario-Cruz R, Guerrero FD, Miller RJ, Rodriguez-Vivas RI, Dominguez-Garcia DI, Cornel AJ, Hernandez-Ortiz R, George JE:Roles played by esterase activity and by a sodium channel mutation involved in pyrethroid resistance in populations ofBoophilus microplus(Acari: Ixodidae) collected from Yucatan.
Mexico J Med Entomol2005,42(6):1020–1025.
42. Chevillon C, Koffi BB, Barre N, Durand P, Arnathau C, De Meeus T:Direct and indirect inferences on parasite mating and gene transmission patterns. Pangamy in the cattle tickRhipicephalus(Boophilus)microplus.
Infect Genet Evol2007,7(2):298–304.
43. Angus BM:The history of the cattle tickBoophilus microplusin Australia and achievements in its control.Int J Parasitol1996,26(12):1341–1355. 44. George JE, Davey RB, Pound JM:Introduced ticks and tick-borne diseases:
the threat and approaches to eradication.InThe Veterinary Clinics of North
America Food Animal Practice.vol. 18, 2002/11/22nd edition; 2002:401–406.
45. Ascunce MS, Yang CC, Oakey J, Calcaterra L, Wu WJ, Shih CJ, Goudet J, Ross KG, Shoemaker D:Global invasion history of the fire antSolenopsis invicta.Science2011,331(6020):1066–1068.
46. Saenz VL, Booth W, Schal C, Vargo EL:Genetic analysis of bed bug populations reveals small propagule size within individual infestations but high genetic diversity across infestations from the eastern United States.J Med Entomol2012,49(4):865–875.
47. Ellis D:Texas fever tick program update.InAnnual Meeting of the National
Institute for Animal Agriculture: 2008; Indianapolis.Indiana: National Institute
for Animal Agriculture; 2008.
48. Fernandez-Salas A, Rodriguez-Vivas RI, Alonso-Diaz MA:Resistance of
Rhipicephalus microplusto amitraz and cypermethrin in tropical cattle farms in Veracruz, Mexico.J Parasitol2012,98(5):1010–1014.
49. Fernandez-Salas A, Rodriguez-Vivas RI, Alonso-Diaz MA, Basurto-Camberos H: