Open Access
Research
Comparison of proteomic profiles of serum, plasma, and modified
media supplements used for cell culture and expansion
Saleh Ayache, Monica C Panelli, Karen M Byrne, Stefanie Slezak,
Susan F Leitman, Francesco M Marincola and David F Stroncek*
Address: Department of Transfusion Medicine, Warren G. Magnuson Clinical Center National Institutes of Health, Bethesda, Maryland, USA
Email: Saleh Ayache - Saleh.Ayache@mail.tju.edu; Monica C Panelli - MPanelli@cc.nih.gov; Karen M Byrne - kbyrne@cc.nih.gov; Stefanie Slezak - sslezak@cc.nih.gov; Susan F Leitman - sleitman@cc.nih.gov; Francesco M Marincola - fmarincola@cc.nih.gov; David F Stroncek* - dstroncek@cc.nih.gov
* Corresponding author
Abstract
Background: The culture and expansion of human cells for clinical use requires the presence of human serum or plasma in culture media. Although these supplements have been extensively characterized in their chemical composition, only recently it has been possible to provide by high throughput protein analysis, a comprehensive profile of the soluble factors contributing to cell survival. This study analyzed and compared the presence of 100 proteins including chemokines, cytokines and soluble factors in six different types of media supplements: serum, plasma, recalcified plasma, heat inactivated serum, heat inactivated plasma and heat inactivated recalcified plasma.
Methods: Serum, plasma, recalcified plasma, and heat inactivated supplements were prepared from ten healthy subjects. The levels of 100 soluble factors were measured in each sample using a multiplexed ELISA assay and compared by Eisen hierarchical clustering analysis.
Results: A comparison of serum and plasma levels of soluble factors found that 2 were greater in plasma but 18 factors were greater in serum including 11 chemokines. The levels of only four factors differed between recalcified plasma and plasma. Heat inactivation had the greatest effect on soluble factors. Supervised Eisen hierarchical clustering indicated that the differences between heat inactivated supplements and those that were not were greater than the differences within these two groups. The levels of 36 factors differed between heat inactivated plasma and plasma. Thirty one of these factors had a lower concentration in heat inactivated plasma including 12 chemokines, 4 growth factors, 4 matrix metalloproteases, and 3 adhesion molecules. Heat inactivated decalcified plasma is often used in place of heat inactivated serum and the levels of 19 soluble factors differed between these two supplements.
Conclusion: Our report provides a comprehensive protein profile of serum, plasma recalcified plasma, and heat inactivated supplements. This profile represents a qualitative and quantitative database that can aid in the selection of the appropriate blood derived supplement for human cell cultures with special requirements.
Published: 04 October 2006
Journal of Translational Medicine 2006, 4:40 doi:10.1186/1479-5876-4-40
Received: 08 August 2006 Accepted: 04 October 2006
This article is available from: http://www.translational-medicine.com/content/4/1/40
© 2006 Ayache et al; licensee BioMed Central Ltd.
Background
There is a growing interest in the in vitro generation of large numbers and varieties of cell types for clinical appli-cations including dendritic cells (DCs) to improve the effectiveness of immune therapies [1-4], cytotoxic T cell therapy of cancer [5], EBV induced lymphoma [6], and CMV infection [7,8], and to expand hematopoietic stem cells to provide greater quantities of transplantable cells [9,10]. The culture and expansion of cells usually involves the addition of cytokines and/or growth factors. In addi-tion, serum or plasma is often added to the culture media [1,3,6-8].
Although fetal calf serum has often been the standard media supplement for in vitro research studies, fetal calf serum is not suitable for the production of cells for clinical use. The use of bovine serum exposes patients to the potential risk of transmission of pathogens such as Creut-zfeldt-Jakob disease (CJD) [11] and the development of a humoral or cellular response to bovine proteins [4]. In spite of these issues, some clinical protocols use fetal calf serum [3,6], but often human serum is used in place of fetal calf serum [1,7,8]. In some cases human plasma [1] or no media supplement is used [2,4,9,10].
While human serum is likely the best substitute for fetal calf serum, human plasma is more readily available than serum. Plasma is regularly produced by blood centers fol-lowing good manufacturing practices from donors screened and tested for transfusion transmitted diseases. The plasma is stored frozen and is used for transfusion. In contrast, serum is not used for transfusion and is not rou-tinely manufactured by blood centers.
The use of human plasma rather than serum in cell cul-ture, however, presents some problems. Citrate, a calcium chelator, is the standard plasma anticoagulant used in the process of plasma collection. When plasma is added to culture media which usually contains calcium, fibrin or clots may form. This can be prevented by adding thrombin and calcium to plasma to induce clot formation and defibrination. Recalcified plasma is used in place of fetal calf serum in some clinical protocols.
When serum or plasma is used as a culture media supple-ment, it is often modified by heat inactivation which involves heating at 56°C for 1 hour to inactivate ment components and prevent the occurrence of comple-ment mediated lysis in cell cultures [1]. However, heating has a large spectrum of denaturing effects and hence affects other serum and plasma factors.
Although serum, plasma, recalcified plasma, and heat inactivated serum and plasma are used to supplement cul-ture media little is known about the differences in the
composition of these supplements. The goal of this study was to determine if differences in the levels of soluble fac-tors among these media supplements might contribute to the differences in their efficacy. Results from this study may assist in determining which plasma or plasma-derived components would be more appropriate for human cell cultures with special requirements.
Methods
Study design
A total of 450 mL of whole blood was collected from each of 10 healthy research donors. The blood was collected in two aliquots: one of 375 mL and the other 125 mL. The larger aliquot was collected in CP2D (citrate-phosphate-2dextrose) anticoagulant and was used to prepare plasma. One third of plasma prepared from the CP2D blood was processed to make recalcified plasma, one third to make heat inactivated plasma, and one third was not further processed. The 125 mL aliquot of blood was collected in a bag without anticoagulant and was used to make serum. One and one-half mL aliquots from all components were frozen at -80°C. Aliquots from each of the 10 subjects were tested for 100 soluble factors using a multiplex ELISA. In the first part of the study serum, plasma, recali-fied plasma and heat inactived plasma were tested. In the second part of the study samples of serum, plasma, and recalcified plasma stored at -80°C were thawed, heat inac-tivated and tested.
Blood collection
Whole blood was collected using a specially assembled set of blood collection bags consisting of a dry bag from a Pall collection bag system (Leukotrap WB system, CP2D/AS-3 double blood bag unit, Pall Corporation, East Hills, NY 11548, USA) and Baxter, 150 mL transfer bag (Baxter Health Corporation, Fenwal division, Deerfield, IL 60015, USA). The blood collection bags were assembled using a sterile connecting device (SCD 312, Terumo Medical Corp, Elkon, MD). The seven bag set included a phlebot-omy needle tubing which was connected to a Y anastomo-ses tubing with one side connected to a collecting bag labeled (A), which contained 55 mL of CP2D as anticoag-ulant. Bag A was connected to a dry satellite bag labeled B, which in turn was connected to three 150 mL transfer bags labeled C, D, and E. The second end of Y blood with-drawal tubing was connected to a dry CLX satellite bag (Pall) labeled F, which was connected to second dry bag labeled G.
blood in bag A was used to prepare plasma and plasma products, while blood in bag F was used to prepare serum.
Plasma and serum preparation and storage
To prepare plasma the whole blood in bag A was centri-fuged at 4000 rpm for 6.5 minutes (RC3C, Sorval Instru-ments, Newton, CT). Plasma was expressed into bag B which was then divided equally between the three satellite bags (C, D, and E) with a final volume of 60 to 75 mL in each bag. Plasma bag E was not processed further.
To prepare recalcified plasma calcium chloride (CaCl2)
and thrombin were added to bag C and the plasma was incubated at 37°C for one hour and then stored at 4°C overnight. The bag was then centrifuged at 4000 rpm for 6.5 minutes at room temperature and supernatant, recal-cified plasma was expressed into a satellite bag.
Heat inactivated plasma was prepared by incubating plasma in bag D at 56°C for one hour. The bag was then centrifuged at 4000 rpm for 6.5 minutes and the expressed supernatant, heat inactivated plasma, was transferred into satellite bag.
To prepare serum, the whole blood in bag F was stored on ice for one hour. It was then centrifuged at 4000 rpm for 6.5 minutes and the supernatant was transferred into bag G.
Immediately after the preparation of each component was complete, 1.5 mL aliquots were placed into cryovials (1.8 mL Nunc) and snap frozen on dry ice and ethanol. After freezing, all samples were then transferred to -80°C for storage.
Analysis of plasma and serum proteins
The levels of 100 soluble factors were assessed on an ELISA-based platform (Pierce Search Light Proteome Arrays, Boston, MA) consisting of multiplexed assays that measured up to 16 proteins per well in standard 96 well plates[12]. The arrays were produced by spotting 2 × 2, 3 × 3, or 4 × 4 patterns of different monoclonal antibodies into each well of a 96-well plate. Following a typical sand-wich ELISA procedure, signal was generated using a chemiluminescent substrate. The light produced at each spot in the array was captured by imaging the entire plate with a commercially available cooled CCD camera. The data was reduced using image analysis software that calcu-lated exact values (pg/mL) based on standard curves. The 100 factors included: interferon alpha (IFN-α), IFN gamma (IFN-γ), interleukin 1 alpha (IL-1α), IL-1β, IL-1Rα, 2, 3, 4, 5, 6, 7, 8, 9, 10, IL-11, IL-12p40, IL-12p70, IL-13, IL-15, IL-16, IL-18, tumor necrosis factor alpha (TNF-α), epithelial cell-derived neu-trophil activating protein 78 (ENA-78), eotaxin/CCL11,
eotaxin II/CCL24, exodus II, growth related oncogene alpha (GRO-α/CXCL1), inducible 309 (I-309/CCL1), interferon inducible protein 10 (IP-10/CXCL10), inter-feron-inducible T-cell alpha chemoattractant (ITAC/ CXCL11), lymphotactin (LTN), monocyte chemoattract-ant protein 1(MCP-1/CCL2), MCP-2/CCL8, MCP-3/ CCL7, MCP-4/CCL13, macrophage-derived chemokine (MDC/CCL22), monokines induced by interferon (MIG/ CXCL9), macrophage inflammatory protein 1α (MIP-1α/ CCL3), MIP-1β/CCL4, MIP-3α/CCL20, MIP-3β/CCL19, myeloid progenitor inhibitory factor (MPIF-1), neu-trophil chemoattractant peptide 2 (NAP-2/CXCL7), stro-mal-derived factor 1β (SDF-1β/CXCL12), regulated on activation normal T cell-expressed and secreted (RANTES/ CXCL5), thymus and activation regulated chemokine (TARC/CCL17), granulocyte colony-stimulating factor (G-CSF), granulocyte macrophage-colony stimulating fac-tor (GM-CSF), angiogenesis facfac-tors, angiopoietin-2 (ANG-2), fibroblast growth factor-α (FGF-α) fibroblast growth factor basic (FGF-b), keratinocyte growth factor (KGF), hepatocyte growth factor (HGF), heparin binding epidermal growth factor (HB-EGF), platelet derived growth factor BB (PDGF-BB), vascular endothelial growth factor (VEGF), human growth hormone (HGH), TGF-α, matrix metalloproteinase 1 (MMP-1), MMP-2, MMP-3, MMP-8, MMP-9, MMP-10, MMP-13, tissue inhibitor of metalloprotease 1 (TIMP-1), TIMP-2, brain-derived neu-rotrophic factor (BDNF), nerve growth factor-beta (β -NGF), ciliary neurotrophic factor (CNTF), neurotrophin-3 (NTneurotrophin-3), leukemia inhibitory factor (LIF), serum amyloid A (SAA), pregnancy associated plasma protein-A (PAPP-A), amphiregulin (AR), leptin, adiponectin (ACRP-30) adipocytes secreted proteins, Apo-A1, ApoB-100, soluble CD14 (sCD14), CD40 ligand (CD40L), C reactive protein (CRP), myeloperoxidase (MPO), fibrinogen, osteoprote-grin (OPG), osteopontin (OPN), plasminogen activator inhibitor-1 Active (PAI-1), PAI-1Total, aminoterminal proBNP (NT-proBNP), receptor activator of nuclear fac-tor-kappa B (RANK), receptor activator of nuclear factor-kappa B ligand antibodies (RANK-L), vascular cell adhe-sion molecule (VCAM-1), intracellular adheadhe-sion molecule (ICAM-1), L-Selectin, E-Selectin, TNF receptor-1 and 2 (TNFR1, TNFR2), IL-1 receptor (IL-2R), and IL-6R.
Statistical analysis
fac-tors were sorted, but not the samples. Twenty of the 100 factors were excluded from the analysis since their levels were under the assay's limits of detection. Those factors were: TGF-β, IL-1β, 4, 5, 10, 12p70, 13, IL-15, IL-17, LIF, NT-proBNP, RANK, RANK-L, PAPPA, MMP-8, B-NGF, VEGF, HB-EGF, IL-3, B-NGF, and FGF-α.
Results
Proteomic profiles of serum, plasma, recalcified plasma and heat inactivated plasma
Analysis of the levels of the 80 factors using unsupervised hierarchical clustering among serum, plasma, recalcified plasma components and heat inactivated plasma pre-pared from 10 subjects yielded three groups of factors. The first group was made up predominantly of heat inacti-vated plasma components (Figure 1, black bar), the sec-ond of serum components (Figure 1, red bar), and the third of plasma and recalcified plasma components
(Fig-ure 1, blue bar). The heat inactivated group contained 11 samples: all 10 heat inactivated plasma samples (P-HI-01, HI-02, HI-03, HI-04, HI-05, HI-06, HI-07, P-HI-08, P-HI-09, and P-HI-10) and one recalcified plasma sample (CP-9). The serum group contained 9 serum sam-ples (01, 02, 03, 04, 05, 06, 07, 09, and S-10). The plasma and recalcified plasma group was consti-tuted by 20 samples: 10 plasma (01, 02, 03, 04, P-05, P-06, P-07, P-08, P-09, and P-10), 9 recalcified plasma (01, 02, 03, 04, 05, 06, 07, CP-08, and CP-10) and one serum (S-08) samples. The mean levels of all 80 factors are shown in Additional file 1.
The most prominent dissimilarity among the 40 samples was a cluster of 15 factors whose levels were markedly lower in the 10 heat inactivated plasma than in the other samples (Figure 2). These factors were fibrinogen,
MIP-Unsupervised Hierarchical clustering (Eisen Kendall's) of 80 soluble factor levels among a total of 40 samples including 10 serum (S), 10 plasma (P), 10 recalcified plasma (CP), and 10 heat inactivated plasma (P-HI) samples prepared from whole blood from 10 healthy subjects (01 through 10)
Figure 1
Unsupervised Hierarchical clustering (Eisen Kendall's) of 80 soluble factor levels among a total of 40 samples including 10 serum (S), 10 plasma (P), 10 recalcified plasma (CP), and 10 heat inactivated plasma (P-HI) samples prepared from whole blood from 10 healthy subjects (01 through 10). The levels of the soluble factors were measured by multiplexed ELISA.
Heat inactivated plasma components
serum
1α, MIP-3α, MIP-3β, MDC, MMP-2, MMP-3, MMP-10, ICAM-1, VCAM, SDF-1β, ITAC, MPIF-1, IL-6R, and Ang2.
These results show that plasma and recalcified plasma are very similar in regards to the factors analyzed. However, serum and plasma are quite different as previously reported by our group [14] and heat inactivation affected the levels of several factors.
Comparison of serum and plasma
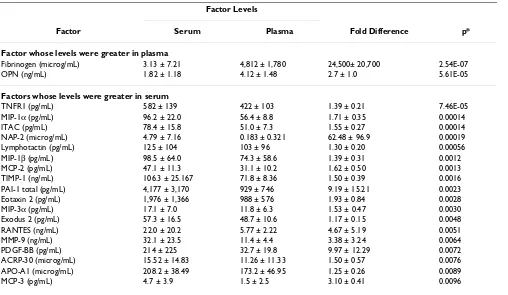
Previous studies have found that the levels of several fac-tors differed between serum prepared from blood col-lected in BD vacutainer serum collection tubes and plasma prepared from blood collected in vacutainers with EDTA [14]. A comparison of the soluble factors in the 10 plasma samples prepared in this study from citrated blood collected in bags and the 10 serum samples collected in
bags revealed that the levels of 20 factors differed between serum and plasma (Table 1). The levels of fibrinogen and OPN were greater in plasma and levels of 18 factors were greater in serum. Among the other 18 factors whose levels were greater in serum than in plasma were 11 chemokines (MCP-2, MCP-3, MIP-1α, MIP-1β, MIP-3α, NAP-2, ITAC, lymphotactin, eotaxin 2, exodus 2, and RANTES) and 4 factors normally found in platelets NAP-2, RANTES, PDGF-BB, and PAI-1 total.
Comparison of factor levels in recalcified plasma, regular plasma and serum
[image:5.612.77.532.118.446.2]To produce recalcified plasma thrombin and calcium were added to plasma. As expected, the levels of fibrinogen were lower in recalicified plasma than in plasma, (262 ± 38 microg/mL vs 4,810 ± 1,780 microg/L, p = 0.026). The levels of only 4 other factors differed between recalcified Factors that distinguish heat inactivated plasma from plasma, serum, and recalcified plasma
Figure 2
Factors that distinguish heat inactivated plasma from plasma, serum, and recalcified plasma. Hierarchical clustering analysis was applied to 80 soluble factors measured in a total of 40 serum, plasma, and plasma derived components (as per Figure 1). The ten heat inactivated plasma components separated into a single group with one recalcified plasma component. A cluster of 15 soluble factors best distinguished the heat inactivated group from the other 29 components.
Heat inactivated plasma components
serum
plasma and plasma (MDC, NAP-2, IL-16 and IFN-α) (Table 2). The levels of MDC, IL-16, and IFN-α were greater in plasma and the level of NAP-2 was greater in recalcified plasma.
There were more differences between recalcified plasma and serum than between recalcified plasma and plasma. The levels of 19 factors differed between recalcified plasma and serum (Table 3). Eighteen of the 19 factors
[image:6.612.57.565.99.394.2]were greater in serum and one of the factors was greater in recalcified plasma, OPN. Fourteen of the 19 factors that differed among plasma and serum also differed among recalcified plasma and serum (OPN, MIP-1β, MIP-3α, NAP-2, APO-A1, eotaxin 2, MCP-2, MCP-3, TIMP-1, Lym-photaxin, PDGF-BB, ITAC, PAI-1 total, and TNFR1). The 5 factors that differed among recalcified plasma and serum but not plasma and serum were MDC, MMP-2, L-selectin, APO-B100, and ENA-78.
Table 1: Factors Whose Levels Differed Between Serum and Plasma Components
Factor Levels
Factor Serum Plasma Fold Difference p*
Factor whose levels were greater in plasma
Fibrinogen (microg/mL) 3.13 ± 7.21 4,812 ± 1,780 24,500± 20,700 2.54E-07
OPN (ng/mL) 1.82 ± 1.18 4.12 ± 1.48 2.7 ± 1.0 5.61E-05
Factors whose levels were greater in serum
TNFR1 (pg/mL) 582 ± 139 422 ± 103 1.39 ± 0.21 7.46E-05
MIP-1α (pg/mL) 96.2 ± 22.0 56.4 ± 8.8 1.71 ± 0.35 0.00014
ITAC (pg/mL) 78.4 ± 15.8 51.0 ± 7.3 1.55 ± 0.27 0.00014
NAP-2 (microg/mL) 4.79 ± 7.16 0.183 ± 0.321 62.48 ± 96.9 0.00019
Lymphotactin (pg/mL) 125 ± 104 103 ± 96 1.30 ± 0.20 0.00056
MIP-1β (pg/mL) 98.5 ± 64.0 74.3 ± 58.6 1.39 ± 0.31 0.0012
MCP-2 (pg/mL) 47.1 ± 11.3 31.1 ± 10.2 1.62 ± 0.50 0.0013
TIMP-1 (ng/mL) 106.3 ± 25.167 71.8 ± 8.36 1.50 ± 0.39 0.0016
PAI-1 total (pg/mL) 4,177 ± 3,170 929 ± 746 9.19 ± 15.21 0.0023
Eotaxin 2 (pg/mL) 1,976 ± 1,366 988 ± 576 1.93 ± 0.84 0.0028
MIP-3α (pg/mL) 17.1 ± 7.0 11.8 ± 6.3 1.53 ± 0.47 0.0030
Exodus 2 (pg/mL) 57.3 ± 16.5 48.7 ± 10.6 1.17 ± 0.15 0.0048
RANTES (ng/mL) 22.0 ± 20.2 5.77 ± 2.22 4.67 ± 5.19 0.0051
MMP-9 (ng/mL) 32.1 ± 23.5 11.4 ± 4.4 3.38 ± 3.24 0.0064
PDGF-BB (pg/mL) 214 ± 225 32.7 ± 19.8 9.97 ± 12.29 0.0072
ACRP-30 (microg/mL) 15.52 ± 14.83 11.26 ± 11.33 1.50 ± 0.57 0.0076 APO-A1 (microg/mL) 208.2 ± 38.49 173.2 ± 46.95 1.25 ± 0.26 0.0089
MCP-3 (pg/mL) 4.7 ± 3.9 1.5 ± 2.5 3.10 ± 0.41 0.0096
*p values were calculated using Student's paired T tests and natural log transformed data. Values are mean ± one standard deviation.
Table 2: Factors Whose Levels Differed Between Plasma and Recalcified Plasma Components
Factor Levels
Factor Plasma Recalified Plasma Fold Difference p*
Factors whose levels were greater in plasma
MDC (pg/mL) 350 ± 71 271 ± 50.2 1.30 ± 0.18 0.00016
IL-16 (pg/mL) 711 ± 573 465 ± 513 2.11 ± 1.29 0.0033
IFN-α (pg/mL) 11.5 ± 11.2 4.0 ± 4.8 2.87 ± 1.13 0.0095
Factors whose levels were greater in recalcified plasma
NAP-2 (ng/mL) 183.8 ± 321.1 263.9 ± 305.9 1.92 ± 0.59 0.00033
[image:6.612.54.560.581.710.2]Comparison of factor levels between freshly collected plasma and heat inactivated plasma
Heat inactivation was performed on a selected set of sup-plement samples right after collection to make a prelimi-nary assessment of heat-induced protein levels variation. Plasma was selected as the candidate supplement for test-ing. A comparison of factor levels between heat inacti-vated plasma and plasma found that the levels of 36 factors changed with heat inactivation of plasma (Table 4). The levels of 5 factors, MPO, MCP-1, eotaxin 2, MIP-1, PAI-1 total, and TNFR1, were greater in heat inactivated plasma (Table 4). The 31 factors whose levels were greater in plasma than in heat inactivated plasma included sev-eral chemokines and growth factors.
Comparison of heat inactivated serum, plasma, and recalified plasma with untreated serum, plasma and recalcified plasma
Since heat inactivation changed the levels of many plasma factors, stored serum, plasma, and recalified plasma sam-ples from the 10 subjects were heat inactivated and solu-ble factor levels were measured. A comparison of levels of soluble factors between all heat inactivated and untreated products using supervised hierarchical clustering found that, in general, there were more differences in protein
lev-els between heat inactivated samples and those that were not heat inactivated than among samples that were heat inactivated or among samples that were not (Figure 3). Analysis using t tests found that the levels of 19 factors dif-fered between heat inactivated serum and heat inactivated recalcified plasma (Table 5).
Discussion
This study reports the protein profile of 80 factors in serum, plasma, recalcified plasma and heat inactivated components. Significant differences in soluble factor pro-files and concentrations were observed among these four supplements routinely utilized in clinical cell cultures. Serum and plasma showed very distinct profiles, recalcifi-cation of plasma had little affect on the levels of most sol-uble factors compared to non-recalcified plasma, and heat inactivation drastically changed plasma and serum pro-tein content
[image:7.612.58.556.98.381.2]Serum differs from plasma and recalcified plasma in many ways. The levels of 18 of the 80 factors were greater in serum than in plasma. The increase in factors in serum was likely due to the stimulation of platelets by the coag-ulation cascade and the release of platelet factors NAP-2, RANTES, and PPGF-BB. The chemokine NAP-2 likely
Table 3: Factors Whose Levels Differed Between Recalcified Plasma and Serum
Factor Levels
Factor Serum Recalcified Plasma Fold Difference p*
Factor whose levels were greater in recalcified plasma
OPN (pg/mL) 1.82 ± 1,18 3.92 ± 1.38 2.6 ± 1.0 5.25E-05
Factors whose levels were greater in serum
MIP-1β (pg/mL) 98.5 ± 64.0 60.2 ± 24.7 1.55 ± 0.34 0.00012
NAP-2 (microg/mL) 4.79 ± 7.16 0.264 ± 0.306 31.3 ± 43.9 0.00054
APO-A1 (microg/mL) 208.2 ± 38.49 173.6 ± 36.09 1.21± 0.15 0.00083
Eotaxin 2 (ng/mL) 1.98 ± 1.37 1.04 ± 0.747 1.89 ± 0.68 0.00094
MCP-2 (pg/mL) 47.1 ± 11.3 27.6 ± 10.5 1.92 ± 0.82 0.0010
TIMP-1 (ng/mL) 106.3 ± 25.2 71.3 ± 13.6 1.53 ± 0.44 0.0013
Lymphotactin (pg/mL) 125 ± 104 76.7 ± 51.0 1.73 ± 0.69 0.0014
MDC (pg/mL) 340 ± 56 271 ± 50 1.28 ± 0.24 0.0023
MMP-2 (ng/mL) 116.9 ± 20.18 105.5 ± 16.9 1.11 ± 0.09 0.0031
L-Selectin (microg/mL) 2.24 ± 0.35 2.00 ± 0.19 1.12 ± 0.09 0.0032
MIP-3α (pg/mL) 17.1 ± 7.0 9.1 ± 3.2 2.08 ± 1.34 0.0032
MCP-3 (pg/mL) 4.7 ± 3.9 0.5 ± 1.5 9.4 ± 1.62 0.0036
PDGF-BB (pg/mL) 213.8 ± 225.5 23.7 ± 22.2 9.2 ± 15.2 0.0036
ITAC (pg/mL) 78.4 ± 15.8 47.9 ± 17.9 1.97 ± 1.16 0.0043
PAI-1 total (ng/mL) 4.18 ± 3.17 1.12 ± 1.03 7.99 ± 11.57 0.0047 APO-B100 (microg/mL) 535.3 ± 213.6 358.9 ± 121.2 1.54 ± 0.48 0.0074
ENA-78 (pg/mL) 1,449 ± 787 718 ± 317 2.48 ± 1.89 0.0082
TNFR1 (pg/mL) 582 ± 139 485 ± 94 1.20 ± 0.21 0.0094
stimulates leukocytes leading to the production and release of cytokines, growth factors and other chemok-ines.
The levels of two factors were lower in serum than in plasma; fibrinogen and OPN. The lower levels of both fac-tors are likely a direct effect of thrombin generation in serum. Thrombin catalyzes the conversion of fibrinogen to fibrin and OPN has a thrombin-cleavage site and it is degraded during the activation of the coagulation cascade [15]. The presence of thrombin-cleaved OPN in serum is
likely to affect cells in culture since cleaved OPN promotes cell attachment and spreading to a greater extent than uncleaved OPN [15].
[image:8.612.60.553.99.560.2]Since recalcified plasma has lower levels of fibrinogen than plasma, clots are less likely to form in media supple-mented with recalcified plasma rather then plasma. How-ever, the levels of almost all other factors are similar in plasma and recalcified plasma and the behavior of cells cultured in media plus recalcified plasma is likely be sim-ilar to those cultured in media plus plasma.
Table 4: Factors Whose Levels Differed Between Heat Inactivated Plasma and Plasma
Factor Levels
Factor Plasma Heat Inactivated Plasma Fold Difference p*
Factors whose levels were greater in heat inactivated plasma
MPO (pg/mL) 359 ± 245 2,703 ± 1,171 9.29 ± 4.56 5.42E-07
Eotaxin 2 (pg/mL) 989 ± 576 2,352 ± 1,376 2.57 ± 1.04 0.00012
MCP-1 (pg/mL) 361 ± 97 425 ± 111 1.18 ± 0.10 0.00014
PAI-1 total (pg/mL) 929 ± 745 1,709 ± 183 1.62 ± 0.59 0.0026
TNFR1 (pg/mL) 422 ± 103 499 ± 116 1.19 ± 0.20 0.0093
Factors whose levels were greater in plasma
MIP-1α (pg/mL) 56.4 ± 8.8 0.0 ± 0 NA 2.76E-14
Ang 2 (pg/mL) 212 ± 95.2 0.0 ± 0 NA 8.61E-11
MDC (pg/mL) 350 ± 70.6 219.7 ± 36.3 1.58 ± 0.13 2.16E-08
IL-6R (ng/mL) 13.2 ± 4.45 0.043 ± 0.072 307 ± 563 6.67E-08
SDF-1β (pg/mL) 798 ± 137 336 ± 95.7 2.46 ± 0.47 1.86E-07
MMP-10 (pg/mL) 291 ± 183 3.3 ± 10.3 88.2 ± 10.2 2.03E-07
VCAM (ng/mL) 556 ± 133 113 ± 43.4 5.44 ± 2.23 5.36E-07
Fibrinogen (microg/mL) 4,812 ± 1,779 0.107 ± 0.300 45,029 ± 23,528 1.16E-06 PAI-1active (pg/mL) 4,192 ± 4,600 67.9 ± 89.0 61.7 ± 14.5 2.02E-06
MMP-2 (ng/mL) 114 ± 8.4 34.1 ± 21.4 4.01 ± 1.62 7.45E-06
ICAM-1 (ng/mL) 321 ± 37.9 201 ± 242 1.62 ± 0.3 1.33E-05
CRP (ng/mL) 1,749 ± 1,732 729 ± 921 2.75 ± 0.97 1.99E-05
MPIF-1 (pg/mL) 1,618 ± 368 483 ± 214 4.26 ± 3.18 2.12E-05
PDGF-BB (pg/mL) 32.7 ± 19.8 7.3 ± 17.7 4.48 ± 1.65 4.44E-05
MIP-3β (pg/mL) 88.2 ± 22.4 43.6 ± 11.7 2.11 ± 0.67 4.65E-05
MIP-3α (pg/mL) 11.8 ± 6.3 2.3 ± 2.1 5.13 ± 1.51 6.24E-05
ITAC (pg/mL) 51.0 ± 7.3 17.6 ± 9.9 3.78 ± 1.88 6.84E-05
MMP-3 (ng/mL) 13.86 ± 4.42 660 ± 610 20.99 ± 50.6 0.00057
RANTES (ng/mL) 5.77 ± 2.22 4.19 ± 1.76 1.42 ± 0.32 0.00066
MIP-1β (pg/mL) 74.3 ± 58.6 53.4 ± 36.0 1.38 ± 0.26 0.00087
HGF (pg/mL) 532 ± 159 353 ± 160 1.65 ± 0.48 0.00098
NAP-2 (ng/mL) 184 ± 321 152 ± 280 1.28 ± 0.23 0.0011
Lymphotactin (pg/mL) 103.1 ± 95.7 64.8 ± 66.6 2.11 ± 0.99 0.0013
G-CSF (pg/mL) 65.4 ± 46.6 24.7 ± 38.2 2.65 ± 3.80 0.0016
IL-16 (pg/mL) 711 ± 573 327 ± 447 5.66 ± 6.47 0.0018
Leptin (ng/mL) 9.23 ± 12.33 1.12 ± 1.24 8.25 ± 5.07 0.0023
TARC (pg/mL) 41.4 ± 11.8 34.5 ± 11.7 1.23 ± 0.20 0.0025
MMP-1 (pg/mL) 1,170 ± 636 248 ± 301 4.72 ± 2.13 0.0045
L-Selectin (microg/mL) 1.99 ± 0.32 1.71 ± 0.20 1.16 ± 0.14 0.0049
TNFR2 (pg/mL) 434 ± 74 295 ± 104 1.63 ± 0.68 0.0051
Eotaxin 2 (pg/mL) 104 ± 49 67.7 ± 40.7 1.94 ± 1.26 0.0099
Serum or plasma is often heat inactivated to prevent the activation of complement components during cell culture [1]. We found that heat inactivation affects the levels of many of the factors studied. The levels of almost one third, 31, of the plasma factors were reduced by heat inac-tivation. Heating denatures proteins and causes them to become insoluble and these results show that the effects of heat inactivation are very broad.
The levels of five factors increased with heat inactivation; MPO, eotaxin 2, MCP-1, PAI-1 and TNFR1. While plasma has marked reduced levels of cellular elements compared to whole blood, it does contain some platelets and leuko-cytes. The increase in the levels of these 5 factor levels fol-lowing heat inactivation may be the result of heat-induced cell disruption and release of intracellular contents. MPO is an abundant neutrophil secondary granule protein,
PAI-1 is found in platelets [16], TNFR1 is found on all leu-kocytes, eotaxin 2 in monocytes and macrophages [17] and MCP-1 in monocytes and T cells. Since the levels of many chemokines, growth factors and cell adhesion mol-ecules changed as a result of heat inactivation, the behav-ior of cells in media supplemented with heat inactivated plasma is likely to be much different than the behavior of cells in media plus plasma.
Our laboratory often uses heat inactivated recalcified plasma rather then heat inactivated serum. Our multiplex protein analysis revealed several differences between the two types of supplements. Since the levels of many chem-okines and cell adhesion molecules differed in heat inac-tivated serum and heat inacinac-tivated recalified plasma, the behavior of cells cultured in media plus heat inactivated serum may be different than from those cultured in media Supervised hierarchical clustering (Eisen Kendall's) of 80 soluble factors among 60 samples from 10 subjects
Figure 3
Table 5: Comparison of the Levels of 80 Soluble Factors in Heat Inactivated Serum and Heat Inactivated Recalcified Plasma
Factor Heat Inactivated Serum Heat Inactivated Recalcified Plasma P*
ACRP-30 (microg/mL) 15.9 ± 10.5 9.0 ± 5.8 0.000209
Amphiregulin (pg/mL) 7 ± 11 3 ± 5 N.S.
ANG-2 (pg/mL) 0 ± 0 0 ± 0 N.S.
Apo A-1 (microg/mL) 89.0 ± 16.6 70.0 ± 17.3 0.000433
ApoB-100 (microg/mL) 637 ± 147 544 ± 98 0.00831
A-SAA (microg/mL) 14.7 ± 4.80 11.4 ± 4.12 0.00228
BDNF (ng/mL) 7.23 ± 3.04 4.17 ± 1.54 N.S.
CD14 (pg/mL) 998 ± 2,439 9,922 ± 11,223 N.S.
CD40L (pg/mL) 48 ± 81 70 ± 63 N.S.
CNTF (pg/mL) 0 ± 0 0 ± 0 N.S.
CRP (microg/mL) 3.52 ± 0.84 2.33 ± 4.71 N.S.
ENA-78 (pg/mL) 637 ± 392 343 ± 122 N.S.
Eotaxin (pg/mL) 16 ± 26 25 ± 14 N.S.
Eotaxin2 (ng/mL) 1.66 ± 1.24 3.13 ± 2.33 0.000712
E-Selectin (ng/mL) 73.1 ± 16.7 70.0 ± 15.0 N.S.
Exodus 2 (pg/mL) 53 ± 21 106 ± 55 0.00976
FGF Basic (pg/mL) 218 ± 175 160 ± 219 N.S.
Fibrinogen (ng/mL) 174 ± 44.2 217 ± 76.7 N.S.
G-CSF (pg/mL) 29 ± 22 41 ± 19 N.S.
GM-CSF (pg/mL) 555 ± 267 623 ± 311 N.S.
GRO-alpha (pg/mL) 67 ± 61 36 ± 12 N.S.
HGF (pg/mL) 206 ± 124 224 ± 43 N.S.
HGH (pg/mL) 164 ± 148 159 ± 159 N.S.
I-309 (pg/mL) 27 ± 64 21 ± 38 N.S.
ICAM-1 (ng/mL) 145 ± 44.3 183 ± 48.7 0.00518
IFN-α (pg/mL) 1 ± 1.3 0.8 ± 1.3 N.S.
IFN-γ (pg/mL) 3 ± 9 3 ± 9 N.S.
IL-11 (pg/mL) 0 ± 0 0 ± 0 N.S.
IL-12p40 (pg/mL) 7 ± 15 6 ± 10 N.S.
IL-16 (pg/mL) 62 ± 19 66 ± 21 N.S.
IL-1α (pg/mL) 12 ± 26 11 ± 25 N.S.
IL-1Ra (pg/mL) 183 ± 328 150 ± 283 N.S.
IL-2 (pg/mL) 22 ± 32 21 ± 27 N.S.
IL-2R (ng/mL) 1.21 ± 0.67 1.49 ± 0.78 N.S.
IL-2Rγ (pg/mL) 0 ± 0 0 ± 0 N.S.
IL-6 (pg/mL) 7 ± 13 7 ± 12 N.S.
IL-6R (pg/mL) 30 ± 13 40 ± 10 0.00451
IL-7 (pg/mL) 5 ± 6 0.9 ± 2.6 N.S.
IL-8 (pg/mL) 7 ± 7 6 ± 9 N.S.
IL-9 (pg/mL) 771 ± 1,457 608 ± 1,259 N.S.
ITAC (pg/mL) 8 ± 10 8 ± 6 N.S.
KGF (pg/mL) 34 ± 17 26 ± 12 N.S.
LEPTIN (ng/mL) 2.15 ± 3.04 2.56 ± 3.06 N.S.
L-Selectin (microg/mL) 1.16 ± 0.32 1.06 ± 0.26 N.S.
Lymphotactin (pg/mL) 94 ± 107 86 ± 94 N.S.
MCP-1 (pg/mL) 456 ± 187 514 ± 153 N.S.
MCP-2 (pg/mL) 55 ± 15 47 ± 18 N.S.
MCP-3 (pg/mL) 0 ± 0 0 ± 0 N.S.
MCP-4 (pg/mL) 27 ± 19 30 ± 14 N.S.
MDC (pg/mL) 504 ± 127 463 ± 92 N.S.
MIG (pg/mL) 113 ± 61 119 ± 59 N.S.
MIP-1α (pg/mL) 60 ± 22 43 ± 32 N.S.
MIP-1β (pg/mL) 61 ± 35 69 ± 37 N.S.
MIP-3α (pg/mL) 6 ± 1 7 ± 2 N.S.
MIP-3β (pg/mL) 37 ± 13 56 ± 15 0.00714
MMP-1 (ng/mL) 3.17 ± 2.19 0.68 ± 0.46 0.00612
MMP-10 (pg/mL) 34 ± 45 0 ± 0 N.S.
MMP-13 (pg/mL) 60 ± 114 0 ± 0 N.S.
MMP-2 (ng/mL) 205 ± 35.7 125 ± 31.2 1.09 × 10-05
MMP-3 (ng/mL) 5.58 ± 2.99 1.44 ± 0.92 5.09 × 10-07
MMP-9 (ng/mL) 48.0 ± 35.6 15.4 ± 9.2 0.00217
MPIF-1 (pg/mL) 599 ± 184 616 ± 199 N.S.
MPO (ng/mL) 45.8 ± 13.6 32.0 ± 6.3 0.00206
NAP-2 (microg/mL) 2.80 ± 2.03 0.21 ± 0.20 8.47 × 10-05
NT3 (pg/mL) 10 ± 9 5 ± 8 N.S.
OPG (pg/mL) 3 ± 2 7 ± 4 0.00276
OPN (ng/mL) 2.13 ± 1.50 2.91 ± 2.68 N.S.
PAI-1 Active (pg/mL) 211 ± 179 97 ± 93 N.S.
PAI-1 Total (ng/mL) 4.33 ± 2.72 1.67 ± 1.54 0.00585
PDGF-BB (pg/mL) 165 ± 171 85 ± 198 N.S.
RANTES (ng/mL) 10.8 ± 12.2 3.9 ± 1.5 N.S.
SDF-1β (pg/mL) 173 ± 156 237 ± 172 N.S.
TARC (pg/mL) 74 ± 41 39 ± 10 N.S.
TIMP-1 (ng/mL) 121 ± 56.4 82.3 ± 17.1 N.S.
TIMP-2 (ng/mL) 109 ± 25.8 94.0 ± 16.2 N.S.
TNF-α (pg/mL) 46 ± 35 48 ± 38 N.S.
TNF-RI (pg/mL) 433 ± 115 413 ± 111 N.S.
TNF-R2 (pg/mL) 150 ± 46 584 ± 136 6.63 × 10-07
VCAM-1 (ng/mL) 46.5 ± 13.6 69.1 ± 12.0 0.000540
N.S. = Not Significant
[image:11.612.58.554.90.681.2]*p values were calculated using Student's paired T tests and natural log transformed data. Values are mean ± one standard deviation.
Publish with BioMed Central and every scientist can read your work free of charge "BioMed Central will be the most significant development for disseminating the results of biomedical researc h in our lifetime."
Sir Paul Nurse, Cancer Research UK
Your research papers will be:
available free of charge to the entire biomedical community
peer reviewed and published immediately upon acceptance
cited in PubMed and archived on PubMed Central
yours — you keep the copyright
Submit your manuscript here:
http://www.biomedcentral.com/info/publishing_adv.asp
BioMedcentral plus heat inactivated recalcified plasma. These differences
do not preclude the use of heat inactivated recalcified plasma, but when it is used in place of heat inactivated serum the cells must be carefully analyzed to ensure the final product has not changed.
Media without serum or plasma supplements have been used to culture a number of cell types including hemat-opoietic progenitor cells, dendritic, neutrophils, and leukemia cells [2,4,9,10,18,19]. However, when media with serum or plasma must be used, our report provides a useful characterization of serum/plasma components which can aid in selecting the most appropriate blood supplement for a particular type of cell culture or clinical hematological procedure. Additionally it can shed light on the soluble factors that are missing when investigators subject cultures to serum free media conditions
Additional material
References
1. Wong EC, Maher VE, Hines K, Lee J, Carter CS, Goletz T, Kopp W, Mackall CL, Berzofsky J, Read EJ: Development of a clinical-scale method for generation of dendritic cells from PBMC for use in cancer immunotherapy. Cytotherapy 2001, 3:19-29.
2. Pullarkat V, Lau R, Lee SM, Bender JG, Weber JS: Large-scale monocyte enrichment coupled with a closed culture system for the generation of human dendritic cells. J Immunol Methods
2002, 267:173-183.
3. Tuyaerts S, Noppe SM, Corthals J, Breckpot K, Heirman C, De Greef C, Van RI, Thielemans K: Generation of large numbers of den-dritic cells in a closed system using Cell Factories. J Immunol Methods 2002, 264:135-151.
4. Reichardt VL, Milazzo C, Brugger W, Einsele H, Kanz L, Brossart P:
Idiotype vaccination of multiple myeloma patients using monocyte-derived dendritic cells. Haematologica 2003,
88:1139-1149.
5. Rosenberg SA: The emergence of modern cancer
immuno-therapy. Ann Surg Oncol 2005, 12:344-346.
6. Bollard CM, Aguilar L, Straathof KC, Gahn B, Huls MH, Rousseau A, Sixbey J, Gresik MV, Carrum G, Hudson M, Dilloo D, Gee A, Brenner
MK, Rooney CM, Heslop HE: Cytotoxic T lymphocyte therapy
for Epstein-Barr virus+ Hodgkin's disease. J Exp Med 2004,
200:1623-1633.
7. Peggs KS, Mackinnon S: Augmentation of virus-specific
immu-nity after hematopoietic stem cell transplantation by adop-tive T-cell therapy. Hum Immunol 2004, 65:550-557.
8. Einsele H, Roosnek E, Rufer N, Sinzger C, Riegler S, Loffler J, Grigoleit U, Moris A, Rammensee HG, Kanz L, Kleihauer A, Frank F, Jahn G, Hebart H: Infusion of cytomegalovirus (CMV)-specific T cells for the treatment of CMV infection not responding to antivi-ral chemotherapy. Blood 2002, 99:3916-3922.
9. Shpall EJ, Quinones R, Giller R, Zeng C, Baron AE, Jones RB, Bearman SI, Nieto Y, Freed B, Madinger N, Hogan CJ, Slat-Vasquez V, Russell
P, Blunk B, Schissel D, Hild E, Malcolm J, Ward W, McNiece IK:
Transplantation of ex vivo expanded cord blood. Biol Blood Marrow Transplant 2002, 8:368-376.
10. McNiece I, Jones R, Bearman SI, Cagnoni P, Nieto Y, Franklin W, Ryder J, Steele A, Stoltz J, Russell P, McDermitt J, Hogan C, Murphy J, Shpall EJ: Ex vivo expanded peripheral blood progenitor cells provide rapid neutrophil recovery after high-dose chemo-therapy in patients with breast cancer. Blood 2000,
96:3001-3007.
11. Johnson RT, Gibbs CJJ: Creutzfeldt-Jakob disease and related transmissible spongiform encephalopathies. N Engl J Med
1998, 339:1994-2004.
12. Panelli MC, White R, Foster M, Martin B, Wang E, Smith K, Marincola FM: Forecasting the cytokine storm following systemic inter-leukin (IL)-2 administration. J Transl Med 2004, 2:17.
13. Eisen MB, Spellman PT, Brown PO, Botstein D: Cluster analysis and display of genome-wide expression patterns. Proc Natl Acad Sci U S A 1998, 95:14863-14868.
14. Stroncek D, Slezak S, Khuu H, Basil C, Tisdale J, Leitman SF, Marincola FM, Panelli MC: Proteomic signature of myeloproliferation and neutrophilia: analysis of serum and plasma from healthy sub-jects given granulocyte colony-stimulating factor. Exp Hema-tol 2005, 33:1109-1117.
15. Senger DR, Perruzzi CA, Papadopoulos-Sergiou A, Van de WL:
Adhesive properties of osteopontin: regulation by a naturally occurring thrombin-cleavage in close proximity to the GRGDS cell-binding domain. Mol Biol Cell 1994, 5:565-574. 16. Brogren H, Karlsson L, Andersson M, Wang L, Erlinge D, Jern S:
Platelets synthesize large amounts of active plasminogen activator inhibitor 1. Blood 2004, 104:3943-3948.
17. Watanabe K, Jose PJ, Rankin SM: Eotaxin-2 generation is differ-entially regulated by lipopolysaccharide and IL-4 in mono-cytes and macrophages. J Immunol 2002, 168:1911-1918. 18. Bruserud O, Glenjen N, Ryningen A, Ulvestad E: In vitro culture of
human acute lymphoblastic leukemia (ALL) cells in serum-free media; a comparison of native ALL blasts, ALL cell lines and virus-transformed B cell lines. Leuk Res 2003, 27:455-464. 19. Bruserud O, Gjertsen BT, von Volkman HL: In vitro culture of
human acute myelogenous leukemia (AML) cells in serum-free media: studies of native AML blasts and AML cell lines.
J Hematother Stem Cell Res 2000, 9:923-932.
Additional File 1
Table comparing the levels of 80 soluble factors among serum, plasma, recalcified plasma, and heat inactivated plasma. This table provides the levels of soluble factors in the 40 serum, plasma, recalcified plasma, and heat inactivated plasma shown in figure 1.
Click here for file