On What Scale Can We Predict the Agronomic Onset of the West
African Monsoon?
RORYG. J. FITZPATRICK
University of Leeds, Leeds, United Kingdom
CAROLINEL. BAIN
Met Office, Exeter, United Kingdom
PETERKNIPPERTZ
Karlsruhe Institute of Technology, Karlsruhe, Germany
JOHNH. MARSHAM ANDDOUGLASJ. PARKER
ICAS, University of Leeds, Leeds, United Kingdom
(Manuscript received 10 August 2015, in final form 8 January 2016)
ABSTRACT
Accurate prediction of the commencement of local rainfall over West Africa can provide vital information for local stakeholders and regional planners. However, in comparison with analysis of the regional onset of the West African monsoon, the spatial variability of the local monsoon onset has not been extensively explored. One of the main reasons behind the lack of local onset forecast analysis is the spatial noisiness of local rainfall. A new method that evaluates the spatial scale at which local onsets are coherent across West Africa is pre-sented. This new method can be thought of as analogous to a regional signal against local noise analysis of onset. This method highlights regions where local onsets exhibit a quantifiable degree of spatial consistency (denoted local onset regions or LORs). It is found that local onsets exhibit a useful amount of spatial agreement, with LORs apparent across the entire studied domain; this is in contrast to previously found results. Identifying local onset regions and understanding their variability can provide important insight into the spatial limit of monsoon predictability. While local onset regions can be found over West Africa, their size is much smaller than the scale found for seasonal rainfall homogeneity. A potential use of local onset regions is presented that shows the link between the annual intertropical front progression and local agronomic onset.
1. Introduction
Accurate forecasting of the West African monsoon (WAM) is a topic of great importance for local stake-holders and the wider forecasting community. More than 65% of the West African workforce works in the agricultural sector providing about 32% of gross do-mestic product (Fitzpatrick 2015). The majority of
farmland in West Africa is not irrigated, meaning that the success of a harvest is strongly dependent on con-tinuous and sufficient rainfall suitable for crop growing (Ingram et al. 2002;Ewansiha and Singh 2006).
In addition to agricultural impacts, previous work has linked the seasonal cessation of meningitis infections to the advancement of monsoon-related moisture (Molesworth et al. 2003;Sultan et al. 2005b); there is also a link between seasonal increase in malaria and dengue fever cases and precipitation increase during boreal spring and summer (Mera et al. 2014). Com-pounding the risk of disease is the clear link between Corresponding author address: Rory Fitzpatrick, School of Earth
and Environment, University of Leeds, Leeds LS2 9JT, United Kingdom.
E-mail: [email protected] Denotes Open Access content.
This article is licensed under aCreative Commons Attribution 4.0 license.
DOI: 10.1175/MWR-D-15-0274.1
malnutrition and mortality rates of common diseases (measles, cholera, mumps, etc.; West Africa Regional Health Working Group 2012). The need to provide so-cieties across West Africa with accurate, relevant, and usable information on the local and regional monsoon condition is evident.
Of particular interest to local stakeholders is the timing of the WAM onset (Ingram et al. 2002;Sultan et al. 2005a), as well as the timing of societally useful local precipitation [defined as more than 4 mm day21by
Lélé and Lamb (2010)]. Over 17 definitions for the WAM onset have been published (Fitzpatrick et al. 2015, their Tables 1 and 2). Definitions have been cre-ated over different length scales, using different metrics and analyzed with different datasets over various time periods (see, e.g.,Sultan and Janicot 2003;Fontaine and Louvet 2006;Marteau et al. 2009;Gazeaux et al. 2011). Local agronomic onset definitions such as that pro-posed by Marteau et al. (2009) can provide the most relevant information for local and national planners in West Africa. The agronomic onset definition (AOD) given inMarteau et al. (2009), henceforth AODM, was made in conjunction with local and regional stake-holders in Senegal, Mali, and Burkina Faso. The AODM requires a predetermined and relevant set of rainfall thresholds to be met in order to be triggered.
There exists a particular disparity in the literature between the timing and interannual variability of re-gional onsets (onsets calculated on a supernational scale following the zonal maximum of precipitation and con-vection) and local onsets (threshold-based onsets eval-uated at the subnational scale). In particular, there appears to be little to no correlation between the annual transition of the zonal maximum rain belt and agro-nomic onsets across West Africa at the local scale [see
section 2herein; see alsoFitzpatrick et al. (2015)]. This presents an interesting conundrum for forecasters and stakeholders when trying to disseminate how useful re-gional onset forecasts are for more localized needs. Here focus is given exclusively to local onset variability.
In the current literature on WAM dynamics, the effect of dynamical drivers on local onsets has been vastly underresearched. Over West Africa there is research into how seasonal precipitation totals or the annual shift of the maximum precipitation belt are affected by many drivers. These include but are by no means limited to sea surface temperatures (e.g.,Caniaux et al. 2011;Rowell 2013), the Saharan heat low (Lavaysse et al. 2009) and associated modulation in forcing by midlatitude Rossby waves (Roehrig et al. 2011), the phase and intensity of the Madden–Julian oscillation (Maloney and Shaman 2008;
Lavender and Matthews 2009), dry-air intrusions from the Mediterranean tied to the Rossby wave response of the
Indian monsoon onset (Flaounas et al. 2012a,b), or African easterly waves (Berry and Thorncroft 2005; Bain et al. 2014), among other examples. However, how these drivers affect local onset variability has rarely been explored.
The most likely reason for the dearth in local onset variability studies is that local precipitation and local onsets are deemed too spatially and interannually vari-able to warrant detailed study (alluded to in several pa-pers; e.g.,Maloney and Shaman 2008). Indeed,Marteau et al. (2009)conclude that their local onset definition does not seem to be driven on a large scale by any coherent mesoscale, synoptic-scale, or planetary-scale features. There is little spatial or interannual agreement in onset date variability found across their study region. However, given thatMarteau et al. (2009)also find a clear increase in mesoscale convective activity over rain gauges after local onset is triggered, it seems natural that local onset has some larger scale mode of variability. Here we hy-pothesize that there is some degree of spatial coherence present that can be measured using a different approach to those used inMarteau et al. (2009). It is not possible to begin assessment of the interannual variability of local onsets before quantification of the spatial limits of local onset predictability is known.
In this paper we attempt to answer the question ‘‘On what spatial scale can the commencement of local pre-cipitation onset be viewed as sufficiently homogeneous for practical purposes?’’ Clearly if local variability in precipitation dominates over regional coherence across all West Africa, the predictability of local onsets is likely to be poor and of little use to forecast users. Once the spatial limit of local onset homogeneity is known, it may be possible to assess the causes for local onset variability over clearly defined boundaries. This will provide the most useful data for local forecast users and regional planners directly affected by the timing of local onset.
To achieve our aims, a new approach to quantifying onset coherence is introduced. To quantify the spatial limit of temporal homogeneity of local onset, subregions of West Africa are sought for which either the year-to-year timing of, or interannual variability of, local onsets is consistent. It is desired that a representative time se-ries of onsets, such as annual median onset over the subregion, can be used to describe interannual vari-ability across the subregion. This allows for local onsets to be represented within defined boundaries, much the same way that current research constructs regional onset (e.g., Sultan and Janicot 2003; Fontaine et al. 2008;
Vellinga et al. 2013). The homogeneous regions found are termed local onset regions (LORs) and all grid cells within an LOR are termed the LOR’s constituents.
extensively. One potential predictor is the seasonal ad-vancement of moist cool monsoon winds into continental West Africa (Ilesanmi 1971;Hastenrath 1991;Léléand Lamb 2010). The northernmost extent of the southwest-erly monsoon winds is characterized by the intertropical front [ITF; also referred to as intertropical discontinuity (ITD) in the literature], sometimes thought of as the northernmost extent of the monsoon (Walker 1957;Lélé and Lamb 2010). An assessment of the potential link between ITF advancement and local onset variability is offered in this article, providing information on a poten-tial necessary condition for monsoon onset to occur.
Section 2will give a brief overview of the onset defi-nitions used and datasets employed withsection 3 high-lighting the methods for identifying LORs and for the ITF onset.Sections 4and5will give results for the spa-tially uniform (year-to-year onset date homogeneity) and interannual (year-to-year onset variability coherence) methods, respectively.Section 6highlights the use of in-terannual LORs in finding a link between the ITF and local precipitation onset. Section 7 summarizes the identification of LORs for use in analyzing the WAM.
2. Data and definitions used
To identify and appreciate the level of spatial homo-geneity of local onset, the definition chosen has to be applicable across the whole West African domain (taken here as 88–168N, 208W–208E) and identify an important time in the local precipitation time series. For this study, the AODM is used, although the methods employed in this paper are also valid for other local onset definitions (e.g.,Omotosho et al. 2000;Yamada et al. 2013). a. Data
Daily rainfall totals for the season April–August have been taken from the high-resolution (0.258 30.258) Trop-ical Rainfall Measuring Mission 3B42 v7 precipitation dataset for the period 1998–2014 (TRMM v7; Huffman et al. 2007). To study the seasonal ITF movement, 2-m dewpoint temperatures for 0600 UTC have been taken from the ERA-Interim dataset for the months March–July of 1998–2014 (Dee et al. 2011). To use data on a compar-ative length scale to precipitation observations, the in-terpolated 0.258 3 0.258 dataset from ERA-Interim was chosen as opposed to the native T255 horizontal grid. The earlier period for dewpoint observations allows for identi-fication of whether the ITF is a climatological precursor to local agronomic onset with pragmatic lead time for local and regional planners. Hence, the ITF is observed prior to the local agronomic onset of rain for this assessment.
One potential issue with using the TRMM v7 dataset is the relative briefness of available data compared to more
coarse datasets (such as the Global Precipitation Clima-tology Project or a rain gauge network). The decision to use TRMM v7 data was made due its higher resolution com-pared to other datasets, which was considered sufficiently advantageous for analyzing the spatial variability of local onset over West Africa. An assessment of whether the results presented can be considered representative of longer-term AODM homogeneity is provided insection 3c. b. Local West African monsoon onset definition
(Marteau et al. 2009)
The AODM is defined as the first rainy day (pre-cipitation greater than 1 mm) of two consecutive rainy days (with total precipitation greater than 20 mm) and no 7-day dry spell with less than 5 mm of rainfall during the subsequent 20 days.
Figure 1 shows the mean onset dates and local vari-ability of the AODM across West Africa for the period 1998–2012. The mean onset date for the AODM ranges from early May in the southernmost parts of our observed region to mid-to-late July farther north (Fig. 1a). The AODM is triggered every year across most locations in West Africa except toward northern West Africa (148– 168N). Interannual variability in the AODM is high over much of continental West Africa with local standard de-viations of more than two weeks being common (Fig. 1b). Conversely, in the longitude bound 108–208W, local standard deviation of the AODM is generally lower than elsewhere within our studied region. The high variability of the AODM found over much of West Africa suggests that climatological local onset dates are not useful for local stakeholders in these regions. A clear understanding of the limits of predictability is therefore sought.
A considerable issue for local and regional planners is the lack of interannual agreement between local and regional WAM onset dates at the local scale. The most popular regional onset definition applied comes from
Sultan and Janicot (2003).Fitzpatrick et al. (2015) ex-amine the interannual correlation at the local scale be-tween the AODM across West Africa and the regional onset date (averaged across 108W–108E), from Sultan and Janicot (2003)for the years 1998–2012 using TRMM v7 data. It is found that there is minimal significant correlation at the 80% level across West Africa between the two definitions. This result implies that un-derstanding the interannual variability of regional on-sets will have minimal use for understanding local onset variability. This result provides the motivation for this paper to exclusively focus on the AODM.
c. Intertropical front onset
defined here following Lélé and Lamb (2010) by ob-serving the northward extent of the 158C 2-m dewpoint temperature isodrosotherm. We wish to establish whether there is a link between the median AODM date of a LOR and the progression of the ITF toward and beyond that LOR. Therefore, a local ITF onset metric measured for every LOR (denoted ITFL) is given as follows:
d ITFL at LOR L occurs when the zonally averaged
(across the longitudinal limit ofL), 10-day averaged 2-m dewpoint temperature at a given distance (de-notedD) northward ofLis equal to 158C.
The distanceDis readily modifiable in order to assess the spatial difference in the link between the ITF and local onsets. The results shown here are figurative of the general link between local onsets and the ITF. A re-gional version of the local preonset (ITFL) has also been computed. This regional definition (denoted ITFR) follows the same method as the ITFL, but it zonally averages the 2-m dewpoint temperature across 108W– 108E prior to computation of the onset date.
The definition of the ITFL has spatial limitations. As the 158C isodrosotherm is representative of the location where cool moist winds from the Gulf of Guinea meet dry warm air from the continent, this definition is not valid over the western extent of the region studied
(roughly 108–208W). Therefore the ITFL analysis is done on the shortened longitudinal range 108W–208E. As the ITFR is defined between 108W and 108E, such a restriction is not required.
There is a need to distinguish the timing at which dewpoint temperature data are taken. During the day, sensible heating allows for vertical mixing of the boundary layer across West Africa giving a well-established ITF, suggesting that 1200 UTC data are preferable. By contrast, cooling overnight allows for the ITF to penetrate farther northward near the surface, partially due to the influence of gravity currents (Flamant et al. 2007;Bou Karam et al. 2008). Forecast centers often track the ITF location at 0600 UTC, when the convergence line is sharpest. The link between the ITF and local onset has been assessed using both 0600 and 1200 UTC dewpoint data. As results for both times are similar, only 0600 UTC is presented here.
3. Method for identifying local onset regions
Regions are sought where there is spatial coherence of local onset variability (LORs). These LORs can provide practical forecast skill for local and regional stake-holders. Two general modes of variability are assessed. For regional planners, it is useful to identify regions where local onsets consistently occur around the same
time each year (or where local onset anomalies are consistently bounded). These regions allow for forecast users to give a window when local onsets occur across the LOR with a reasonable amount of confidence given knowledge of what affects local onset variability within the LOR. The first LOR method is termed thespatially uniformLOR method.
Additionally, regions are sought where regardless of the range of onset dates within the LOR the interannual variability of onsets is consistent. This information would allow regional planners and forecast users to gain insight as to whether an onset will be relatively early or late across a defined region for a given year. This second LOR method is henceforth referred to as theinterannual LOR method. The two methods should be treated independently.
The main advantage of the interannual LOR method is the ability to identify regions where onsets occur over a wide temporal range. The location of an LOR where variability is consistent despite a wide temporal range of AODM onset dates along topographic or climate gradi-ents gives the potential for inherent prediction of onset within an LOR. In effect, observing the variability of the earliest onset dates within a LOR could give insight into the variability of later onsets across the LOR.
To identify LORs, we have devised a relatively simple method designed to be repeatable and practical for de-pendent stakeholders in contrast to more statistically complex methods such as cluster analysis. The methods used to identify spatially uniform and interannual LORs follow the same pattern with different criteria. For each grid cell in the tested domain we first take the onset dates and spatial median of those dates within a 333 grid point LOR centered about the chosen grid cell. The LOR is tested using the spatially uniform or interannual criterion (see sections 3a and 3b, respectively). In principle, a given grid cell can have both types of LORs centered about it. Upon passing the chosen criterion, the LOR is expanded and tested again. If the criterion is not met, the LOR size and location are recorded. Expansion of LORs is done first by testing whether the LOR would pass the criterion with latitudinal extension (one row of grid cells added to the north and the south) and longi-tudinal extension (one column added to the east and west). If this new LOR does not pass the criterion, we test whether a latitudinal or longitudinal extension would provide a valid LOR. Failing this, the LOR is allowed to extend along any of the four axes. The order of testing chosen for this analysis is to add from the north, east, south, then west of the LOR. Reordering of these criteria has nominal effects on the results (not shown). If any of the above extensions pass the criterion tested, we repeat the process from the start.
It is inherently implied that a grid cell can belong to multiple LORs. Intuitively if a grid cell has coherent onset variability with its neighbors, then some of the neighbors will also have coherent variability with the original grid cell. We therefore note the largest LOR each grid cell is contained within as well as the location of all LORs. Using the method presented here, there is opportunity for LORs to overlap (this is in contrast to other methods such as cluster analysis). General grouping of LORs gives insight into the level of spatial homogeneity and provokes further discussion and analysis as opposed to the exact locations of single LORs, which may be too isolated to have a substantial impact for forecast users.
For both methods presented, there is an inherent requirement for LORs to be identified over regions where onset frequently occurs. Therefore it is required for both spatially uniform and interannual LORs to have at least 80% of grid cells exhibit an AODM onset date for at least 10 of the 15 years assessed. Comparing LORs found with and without this restriction shows that many of the LORs over the region 148–168N are not present when one demands that onsets frequently occur (not shown). Outside of this area, there is mini-mal difference between the LORs found (not shown). For the rest of this paper, the restriction is therefore applied.
a. Spatially uniform LOR methods
Spatially uniform LORs identify subregions of West Africa where the timing of onset is largely in agreement across the LOR each year. Two potential methods are provided for spatially uniform LORs, one using absolute onset dates and one using onset anomaly data.
First, we highlight regions where the absolute onsets dates are consistently bounded (i.e., onset dates across the LOR occur within a preset range of each other year to year). The exact timing of onsets is allowed to vary interannually as long as the range of onset dates remains consistent.
Second, we highlight regions where the onset anom-alies across the LOR are bounded (i.e., removal of the local mean onset date prior to LOR assessment). In some circumstances it will be more important to assess consistency of relative onset dates (anomalies) rather than absolute dates and thus both methods are considered.
maximizing the trustworthiness of spatially uniform LOR formation for stakeholders in West Africa, while not being too restrictive in creating LORs, is important in making practical advances for onset comprehension. While in an idealized setting there would be clear re-gions where all onset dates lie within a strict threshold for all years, in reality this is not the case (seesection 4a). Here we investigate the variability of spatially uniform LOR coverage over West Africa for different values of RandY.
b. Interannual LOR method
1) OUTLINE OF GENERAL METHOD
The spatially uniform LOR methods presented in
section 3a focus specifically on the absolute range of LOR constituent onset dates or anomalies each year. By contrast, the interannual method finds regions where LOR constituent onset dates share similar interannual variability. The interannual method can therefore be thought of as a natural extension to the spatially uniform method using anomaly data.
For each grid cell across the observation region we identify the largest possible LOR centered at that lo-cation for which the following criterion is met:
d The onset time series of at leastncrit% of all grid cells
show correlation (at the xconfidence level) with the median onset date time series of the LOR.
The parameterncritis a modifiable percentage of the total number of grid cells within the LOR (denoted as N). The thresholdxis also modifiable.
Interannual LORs are allowed to expand even if the test criterion is not passed as long as a larger LOR containing all the grid cells currently included passes. This allows for LORs up to 1.58larger to be considered when assessing whether LORs can be found. The num-ber of LORs affected by this added level of complexity is approximately 10%, which tend to be smaller in-terannual LORs (not shown).
2) SENSITIVITY OF PROBABILISTICLORS TO CONFIDENCE INTERVAL SELECTION
The probability that two random time series correlate at a given confidence level, x (e.g., the 80%, 90%, or 95% level), isp5(12x). However, given the criterion presented insection 3b(1), the creation of an LOR en-compassing many random time series is much less likely. Taking an LOR containingNgrid points each with as-sumed random and independent time series of AODM and assessing the probabilityPthat this LOR would pass our criterion, it can be shown using the binomial distri-bution that
P5
å
N
r5ncrit NC
r(p)
r(12p)N2r, (1)
wherencritis rounded up to the nearest integer.Table 1 shows a comparison of the expected number of random LORs for differingNandxwithncritfixed at 80% if we accept the assumption that all grid cells have in-dependent AODM triggering. For reference there are approximately 5500 grid cells in the studied domain. The number of expected random LORs is dwarfed by the total number of LORs found insection 5a.
For regional planners the existence of an LOR implies that at least a given percentage of locations have in-terannual variability consistent with the median AODM variability with confidencex. Pragmatically this means that for every grid cell within an interannual LOR, a regional planner is able to give a probability that onset will occur later than, or earlier than average given knowledge of the median onset date variability (which can be attained through future research into local onset variability including oursection 6).Table 2gives some example probabilities (here again we presume that the probability for each grid cell is independent).
While it would be preferable to maximizexandncrit, in reality it is reasonable to expect some leeway. We therefore compare the size and coverage of LORs found using three different confidence intervals: 95%, 90%, and 80%. For these three confidence intervals the probability of the AODM variability at each LOR constituent grid cell following the median AODM var-iability is still greater than 0.5, meaning LORs can pro-vide relative skill over a random forecast. Section 5b
considers the variation of interannual LORs with re-spect to the parameterncrit.
c. Suitability of TRMM v7 as precipitation dataset for analysis of LORs
Precipitation over West Africa is known to have large decadal variability [see Fig. 1 inLéléand Lamb (2010)
and further references]. Given the relative briefness of the TRMM v7 dataset, it is fair to ask whether TRMM
TABLE1. Probability of getting a random interannual LOR of sizeN.
No. of grid cells in LOR (N)
Confidence intervalx ncrit (%) Probability of random LOR Expected No. of random LORs
9 80% 80 0.0003 2
9 90% 80 3.031026 0.02
9 95% 80 2.631028 0.0001
v7 can be considered a sufficiently representative data-set from which to infer the variability of the AODM.
To test the robustness of dataset choice, the spatially uniform and interannual methods were applied on two 7-yr subperiods of TRMM v7 data. LORs were found in the same locations using the shorter time periods and the full TRMM v7 dataset, although the size of LORs is often smaller for the former (not shown). We therefore posit that the results of this paper give a realistic rep-resentation of the spatial variability of the AODM, al-beit with the restriction of observational biases.
4. Spatially uniform LORs across West Africa
a. LORs found using absolute onset dates
Figure 2shows the number of spatially uniform LORs identified using absolute onset dates against different values ofY.The large number of LORs is consistent with the fact that each grid cell may have its own LOR. As expected, increasing Y decreases the number of
LORs found. For example, whenR57, the first large numerical decrease in the quantity of spatially uniform LORs occurs betweenY58 andY59 years. Afterward the number of LORs identified roughly decreases by 500 with each additional year Y. When R 5 7, there are relatively few LORs for which onsets lie within a close range for many years (i.e., Y514), even at the 333 gridcell scale.
The number of LORs found is also affected by the size of the observation window R. As would be expected, fewer LORs are identified when the variable R is re-duced. In addition, the size of LORs is generally smaller for lowerR(not shown). For higher values ofR(such as R510 orR514 shown inFig. 2), there appears to be little change in the number of LORs found for in-creasingY, suggesting that the LORs found for highR values are resistive to the impact ofYfound forR57. The question must be asked whether LORs with such high values ofRcan be pragmatic.
In addition, the proportionate variablePalso impacts the amount and size of LORs found. The number of LORs found for givenRandYroughly halves fromP5 50% to P 5 80% (not shown). The AODM across subregions of West Africa may exhibit some level of spatial coherence, but is evidently not universally coherent.
Figures 3a and 3bshow scatter distributions of the spatial scale of LORs found for Y57 andY59, re-spectively, with R 5 7 days and P 5 50%. Spatially uniform LORs found using absolute onset dates tend to
TABLE2. Confidence of LOR constituent having similar variability to median onset date for varying confidence intervals.
Confidence levelx ncrit(%)
Confidence for each grid cell in LOR
0.95 80 0.76
0.9 80 0.72
0.8 80 0.64
0.8 100 0.8
FIG. 2. Decrease in number of spatially uniform LORs for increasingYand decreasingR. Plot measures the number of grid cells for which at least a 333 (0.758 30.758) spatially uniform LOR can be found against the number of years for which at least 50% of onset dates must lie withinRdays of the median LOR onset date (denotedY). Different columns for each value of
[image:7.567.53.279.86.157.2]be ‘‘wide and short’’ (i.e., longitudinal scale . lat-itudinal scale). Given the latlat-itudinal gradient of the AODM, as well as the geographical constraints of the study domain, this result is to be expected (seeFig. 1a).
Figure 3also shows that the distribution of LOR sizes remains roughly consistent between Y59 andY57 despite the different quantity of LORs. This is due to the existence of a group of LORs, which consistently pass the spatially uniform LOR criterion for almost all years. The understanding of how convective rainfall is trig-gered within these LORs could provide insight into practical prediction of the AODM. Given the findings of
Marteau et al. (2009), this research may distill into de-termining the cause of early season mesoscale convec-tive system genesis and development over LORs.
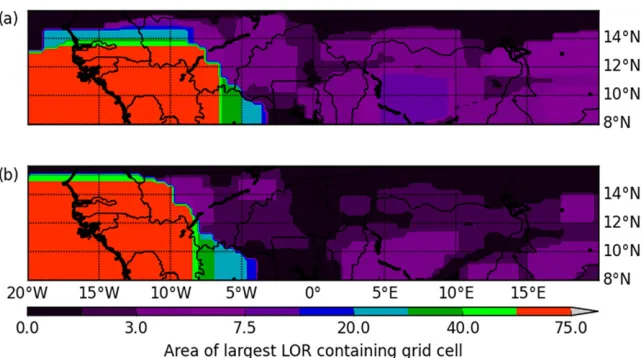
Figures 4a and 4bshow the spatial scale of the largest LOR containing each grid cell for Y 57 and Y 5 9, respectively. The spatial distribution of LORs drasti-cally changes with the increase of Y outside of a few ‘‘stable’’ regions. Large LORs are typically spatially restricted to the eastern Atlantic and coastal regions as well as low latitudes around Benin and western/central Nigeria (green and yellow LORs in Fig. 4). It can be concluded that these regions have the highest level of spatial uniformity in absolute onset date. Local vari-ability in the AODM over the eastern Atlantic and Senegal is generally less than two weeks (seeFig. 1b).
Therefore the most significant highlight of spatially uniform LORs in terms of potential impact is over the longitude range 08–108E.
Over the rest of West Africa there is minimal cov-erage of spatially uniform LORs for largeY. This is particularly apparent around the region;88W–08and over the eastern extent of our study region (Fig. 4b). As the coverage of large spatially uniform LORs within the monsoon region is minimal, regional aver-aging of precipitation for onset formation potentially overlooks natural localized subseasonal variability in precipitation.
b. LORs found using onset anomaly data
As discussed insection 3, it is possible to construct spatially uniform LORs using local onset anomaly data instead of absolute onset dates.Figure 5highlights the dimensions of the largest spatially uniform LOR con-taining each grid cell for the anomaly method and is directly comparable to Fig. 4. Over the West African coast and the eastern Atlantic Ocean, there is a much larger region of spatial coherence for the anomaly method compared to the findings ofFig. 3. This result is not surprising given Fig. 1b. Large spatially uniform LORs found with the anomaly method exist where there is low standard deviation of onset.Figure 5shows that the largest LORs occur where local standard deviation
of onset is lowest over a large area (namely;208–108W; see Fig. 1b). Probability density functions of onset anomalies over subregions of West Africa validate this fact (not shown). It is found that this region of high spatial coherence over Senegal and Guinea is not solely dependent on high agreement over the ocean (not shown).
There are broad similarities between both spatially uniform methods over the rest of West Africa. As seen inFig. 4,Fig. 5highlights relatively large areas of co-herence over the eastern parts of Benin and Nigeria. The consistency betweenFigs. 4 and5 suggests that there exist regions where onset dates are bounded but also have consistent anomalies. However, there exist large regions where the size of spatially uniform LORs is small for both methods presented, suggesting that there are regions where local variability dominates absolute onset timings and relative anomalies. This information is important for forecaster users, as it identifies where local onsets may be less predictable.
The distribution of spatially uniform LOR shapes found using the anomaly method is similar to that found when using absolute onset dates (not shown). There are larger LORs present when using the anomaly method; however, the LORs are still typically wide and short. This similarity is present despite the removal of the latitudinal difference in mean onset dates when calcu-lating LORs using the anomaly method.
Figures 4and5show that spatially uniform LORs can be diagnosed over West Africa using different funda-mental methods. This work does not stress a preference of method. Instead we highlight different techniques to identify spatial coherence of local onset for planners and
forecast users in West Africa. The most suitable LOR method should therefore be decided on a case-by-case basis by forecast users. For example, local agronomic stakeholders may prefer the information given by the absolute onset date method over information on onset anomalies.
Spatially uniform LORs provide information on the year-to-year agreement of onset timing. While there is not continentwide agreement in onset date on an in-terannual basis, local onsets do show some level of spatial homogeneity. This challenges the conclusion of
Marteau et al. (2009)that local onsets are too spatially variable for application on a wider scale although the difference in data used inMarteau et al. (2009)and this work must be considered.
5. Interannual local onset regions over West Africa
a. Local onset region coverage for different confidence intervals
Figure 6shows the location of all interannual LORs identified at three confidence intervals: 95% (Fig. 6a), 90% (Fig. 6b), and 80% (Fig. 6c), where 80% of grid cells are required to correlate with the median onset time series. It is noticeable many interannual LORs exist in contrast to the expected findings from Marteau et al. (2009).
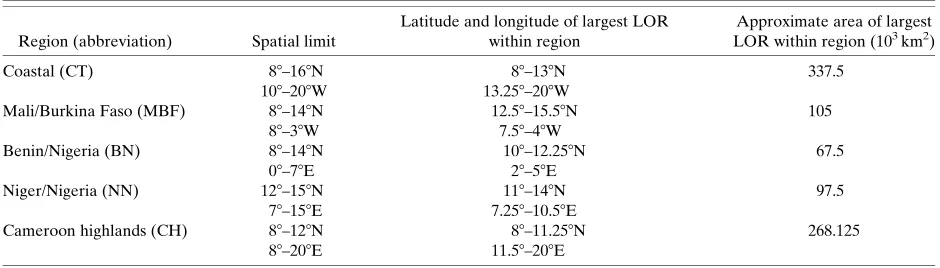
The number of interannual LORs found is inversely proportional to the confidence level tested (cf.Figs. 6a and 6c). There are five distinct regions where LORs are clustered. These five regions, their spatial limits, and the largest LOR within each region at the 80% confidence
level are given inTable 3. Outside of the five regions found, the lack of LORs implies that local variability of the AODM dominates over any regional coherence. It can be seen that even at 80% confidence, LORs are not found within the region 88–108N, 18W–18E (Fig. 6c). In this region we reason that it is currently not possible to give reliable information on the cause of AODM vari-ability, as local noisiness of precipitation dominates onset variability. The same conclusion can be proposed for other areas where few or no LORs are present in
Fig. 6.
The majority of interannual LORs inFig. 6acover less than 30 000 km2and so are relatively small in size com-pared to the range used for regional onset assessment. At lower confidence intervals the quantity and scale of LORs increase.Figure 6bshows that at the 90% confi-dence interval large (blue) LORs are present over the coastal (CT), Niger/Nigeria (NN), and Cameroon highland (CH) regions defined inTable 3. This is more pronounced inFig. 6cwhere large (blue) LORs are also found over the Mali/Burkina Faso (MBF) and Benin/ Nigeria (BN) regions (also inTable 3). The existence of large regions where local onset exhibits homogeneity suggests that the interannual variability of local onsets can be reliably assessed with regard to regional and synoptic-scale processes using representative onset dates across predefined regions. These processes may include sea surface temperature teleconnections, Afri-can easterly wave activity modulating rainfall, and the impact of the Madden–Julian oscillation, among other features.
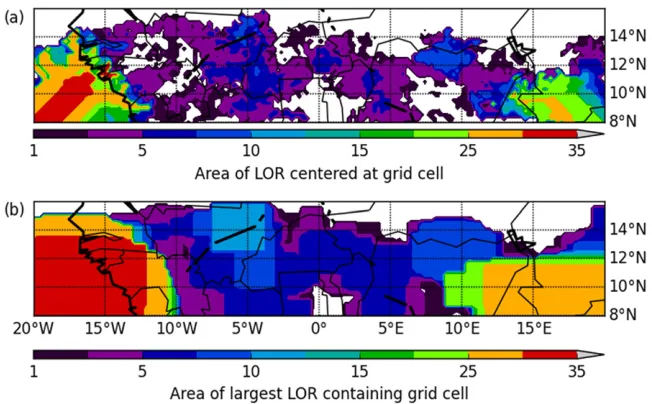
Figure 7a shows the area covered by interannual LORs, found at the 80% confidence interval, for every point across the study domain. It is possible to distin-guish the five main regions inTable 3as the locations
where the largest interannual LORs are centered.
Figure 7bhighlights the largest LOR that each grid cell is contained within. Given the findings of Fig. 7b, we suggest that the spatial homogeneity of local onset is sufficiently large to be analyzed on a wider scale than previously thought.
The existence of LORs across much of West Africa at the 80% confidence interval suggests that some drivers operating over hundreds of kilometers or greater are affecting local onset across the entire region. The exact processes responsible for local onset variability are not currently confirmed; however, interannual LORs give a method by which these processes can be identified and analyzed.
Using interannual LORs, it is pragmatic to give rele-vant information on agronomic onsets across the entire West African domain studied given clear understanding of the spatial constraints of local onset agreement. Local onset regions allow for regional planners to give relevant information on onset timing to people dependent on such information with a built-in threshold of risk. Likewise, local stakeholders are able to know with a certain probability, expressed in Table 2, the relative timing of onset at their location (here correct to a1/48
square limit) compared to the local climatological mean. This is a large advantage over current regional onset forecasts.
b. Dependency of interannual LORs to restrictions in their formulation
Figure 8shows the scatter distribution of interannual LORs found for the three confidence levels (95%, 90%, and 80%) for four values ofncrit. It is apparent that ei-ther an increase in confidence interval tested or ncrit leads to smaller and fewer interannual LORs identified
[image:10.567.123.444.60.239.2](compare across rows inFig. 8for the variability due to ncritor down columns for the variability due to confi-dence interval). It is seen that interannual LORs exist even with the most stringent restrictions tested here (Fig. 8d). It can therefore be concluded that the AODM does exhibit spatial coherence in local interannual var-iance over West Africa even at the highest levels of specification presented here. With the exception of a few wide and short LORs, interannual LORs tend to be more ‘‘square’’ (similar longitudinal and latitudinal scales) compared to the spatially uniform LORs (Fig. 3). Given the latitudinal variability of the AODM seen in
Fig. 1a, this leads to the conclusion that interannual
LORs are capable of capturing variability over a greater range of onset dates than spatially uniform LORs. This is an advantage of interannual LORs, indicative of their ability to capture the general variability of early soon flow instead of one specific moment in the mon-soon season. For the remainder of this paper, unless stated otherwise, analysis is done on LORs found at the 80% confidence interval withncrit580%.
c. Consistency of interannual LOR existence for 2013 and 2014
To verify the interannual LOR results, we have assessed whether the LORs found for the time period
FIG. 6. Location of interannual LORs found at different confidence levels. Locations of local homogeneity of the AODM onset found at (a) the 95% confidence interval, (b) the 90% in-terval, and (c) the 80% interval. Color of LOR signifies the size of LOR. LORs of area less than roughly 30 000 km2 are colored yellow, green LORs cover an area between 30 000 and
60 000 km2, and blue LORs cover area greater than 60 000 km2.
TABLE3. Location of five main regions of interannual LORs.
Region (abbreviation) Spatial limit
Latitude and longitude of largest LOR within region
Approximate area of largest LOR within region (103km2)
Coastal (CT) 88–168N 88–138N 337.5
108–208W 13.258–208W
Mali/Burkina Faso (MBF) 88–148N 12.58–15.58N 105
88–38W 7.58–48W
Benin/Nigeria (BN) 88–148N 108–12.258N 67.5
08–78E 28–58E
Niger/Nigeria (NN) 128–158N 118–148N 97.5
78–158E 7.258–10.58E
Cameroon highlands (CH) 88–128N 88–11.258N 268.125
[image:11.567.125.446.61.293.2] [image:11.567.51.521.559.693.2]1998–2012 also display onset variability for the years 2013 and 2014. To test this, we consider each LOR found for the period 1998–2012 individually and ana-lyze whether the interannual criterion would hold for 2013 and/or 2014. In practice, if the median onset date for an LOR for 2013 is later than the climatological median onset date of that LOR, we assess whether the constituent onset dates are also later than their re-spective local long-term mean onset dates and vice versa.Figures 9a and 9bshow the LORs that validate for 2013 and 2014, respectively. The majority of LORs found for the period 1998–2012 are validated in 2013 and 2014 with LORs in four of the five main regions highlighted in Table 3 present in Figs. 9a and 9b.
Figure 9ahighlights that variability in the NN region in 2013 does not follow the pattern found for 1998–2012 with the entire region absent of LORs. The fact that all NN LORs disappear shows the stability of the method (it is expected that for 20% of years the LOR would not be validated). This is also true for the MBF region in 2014. In both years the reason for this lack of homo-geneity is a high spatial variability of AODM anoma-lies within the regions (not shown).
In conclusion, interannual LORs appear to have some usefulness in highlighting areas where onset variability is consistent each year. Understanding what causes the modulation of LOR median onset in a given year will allow for predictability of local onsets across defined parts of West Africa. Identification of the drivers behind local onset variability within the regions highlighted in Table 3 should be an area of key im-portance for West African research.
d. Cross correlation of interannual local onset regions
Figure 6candTable 3show that there are large-scale LORs found in the five distinct regions. We investigate here how independent the interannual variability of each region is relative to the other regions.
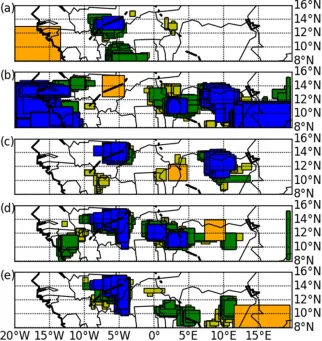
Figure 10shows the level of cross correlation pres-ent between LORs across West Africa. Each of the five regions identified previously have been assessed separately. Figure 10a shows all LORs that cross correlate at the 95% confidence level with the largest LOR in the CT region; Figs. 10b–e show the same correlations for the largest LOR within the MBF, BN, NN, and CH regions, respectively. The interannual LORs between the CT and MBF regions tend to cor-relate, suggesting a connection between the dynamical effects on monsoon onset variability across these two regions (Figs. 10a,b). The exact reason for this link is currently unknown, but there are indications that westerly moisture flux from the eastern Atlantic coast and other factors could play a role (Léléet al. 2015). Likewise, there appears to be a link between onset variability over the NN region and the variability over the MBF and BN regions (Figs. 10b–d). This again sug-gests that there is a possible underlying connecting driver or combination of drivers of local onset vari-ability across a large section of West Africa. A poten-tial explanation of the connection between the MBF and NN regions is the development and westward mi-gration of fast-moving squall lines generated over the Jos Plateau. There does, however, appear to be a dis-connection between variability of onset across the NN
[image:12.567.120.446.61.263.2]FIG. 8. Comparison of interannual LORs found for differentncritvalues at different confidence intervals. Scatter
distribution of the spatial dimensions for interannual LORs found at all confidence intervals and values ofncrit
tested. Shown are LORs at the (a)–(d) 95%, (e)–(h) 90%, and (i)–(l) 80% level. Columns are sorted by values of
ncritwritten above the top row. The color of each circle represents the number of LORs found at each dimensional
and CH regions, suggesting that the factors that control onset variability are different. This is likely due to the topographical features in the CH region governing local onset.
Cross-correlating LORs highlight that there may be large-scale underlying causes for local onset variability across sections of West Africa. For example, it may be that the connection between the CH and MBF regions is due to the African easterly jet and associated African easterly waves bringing intense precipitation toward the MBF region. This link has not been explicitly proven with regard to local onset, but it has in a more climato-logical sense (e.g., Fink and Reiner 2003; Bain et al. 2014).
6. Correlation between local onset regions and the intertropical front
Figure 11shows the location of interannual LORs that correlate (at the 90% level) with the ITFR onset date at 1.58latitude north of the northernmost latitude of the LOR (i.e., ITFR at 148N for an LOR with northernmost extent at 12.58N;Fig. 11a) and the point when the ITF reaches 158N (i.e., ITFR at 158N; Fig. 11b). Both
Figs. 11a and 11bshow that the majority of LORs that correlate with the ITFR onset are within the longitude band 108W–108E, which coincides with the region where the ITFR is calculated. The ITFR at 158N primarily correlates with LORs across the MBF region (Fig. 11b). This could highlight the fact that different dynamics modulate agronomic onset within the five distinct re-gions highlighted inTable 3. The link between the ITFR at other distances north of each LOR have also been investigated. It is found that the link between the ITFR
and local onsets in the MBF, BN, and NN regions is stable; however, there is a more variable link found across the CT and CH regions (not shown).
Later-than-average ITFR advancement is typically concurrent with later-than-average AODM. Given that a link between the ITF advancement and socie-tally useful rainfall has already been found (Léléand Lamb 2010), the apparent link between ITFR and the AODM across West Africa provides a potential nec-essary condition for local onset to occur.Figure 11b
may also provide a missing link between local and regional onset variability in the MBF region. Sultan and Janicot (2003) define monsoon preonset across the region 108W–108E as the date when the ITF rea-ches 158N. The authors find minimal correlation (0.01) between the timing of the preonset and their regional onset date. This result, coupled with the findings of
Fitzpatrick et al. (2015)andFig. 11b, suggests that the timing of the monsoon preonset is a better indicator for local onset variability than the timing of regional monsoon onset within correlating LORs shown in
Fig. 11b.
Finally, inFig. 11a, a link between the AODM and the ITFR can be seen over the coastal region. The potential for a teleconnection between local precipitation over the coast and the advancement of moisture into continental West Africa is intriguing. The dynamical understanding of this link across all regions warrants further in-vestigation [with the work ofLéléet al. (2015)providing motivation].
Figure 12acompares the median onset of the AODM within each LOR with the timing of the ITFL at 1.58 north of the northernmost latitude of that LOR (i.e., ITFL at 158N for an LOR with northernmost latitude of
13.58N). As for the ITFR, different latitudinal gaps be-tween the ITFL and LORs have been examined with consistent results (not shown). As mentioned insection 2c, the definition of the ITFL over the CT region is not calculated. Over the four regions analyzed, there exists a link between the interannual variability of the AODM and the advancement of the ITFL. This result suggests that measurements of dewpoint temperature over clearly defined regions can give meaningful insight for local planners into the variability of monsoon rains with sufficient lead time for practical purposes.
Figure 12bshows that the lead time between the ITFL onset and the AODM onset across LORs is frequently much larger than two weeks, although the lead time may differ even across overlapping LORs. The standard de-viation of this link is generally between 7 and 14 days (Fig. 12c). There are, however, LORs where the
variability in the lag can exceed three weeks. Never-theless, the standard deviation inFig. 12cis often lower than the high local variability of the AODM (Fig. 1b). It can be proposed that the ITFL onset date can be used as a predictor of local onset variability of the AODM with sufficient lead time for practical purposes. Given the variability in lead time seen inFig. 12ccoupled with the existence of neighboring regions where the lead time can differ, the ITFL may not be suitable for explicit onset date prediction. Conversely, for probabilistic or tercile analysis the link shown here would be of practical use. The fact that a link exists between the ITFL and AODM dates for many LORs is an improvement over using regional onset dates to predict local onsets.
Apparently (and intuitively), the movement of mois-ture toward and beyond correlating LORs is a necessary condition for local onset to occur, however it is unclear
[image:15.567.125.447.65.406.2]whether the ITFL or ITFR onset is a sufficient condition for onset. The dynamical link between the deepening of the continental monsoon layer across West Africa and local agronomic onset requires further study. This find-ing gives precedent for assessment of local onset pre-dictability across most of West Africa.
7. Summary
The local onset of the West African monsoon is un-derused by both the science community and in forecast practices due to the complexity and inhomogeneity of local rainfall. It is shown here that local onsets have spatial coherence across sections of West Africa. These areas are termed local onset regions (LORs).
There exist several local onset definitions applicable over West Africa (Omotosho et al. 2000;Marteau et al. 2009;Yamada et al. 2013). The definition proposed by
Marteau et al. (2009)was selected for analysis here. Local onset regions have been identified using two methods, one focused on absolute onset dates or local anomalies (spatially uniform LORs) and one centered on local interannual variability of onsets (interannual LORs). Both methods identify subcontinental regions of local onset consistency across West Africa but also highlight a distinct lack of widespread spatial agreement in onset. The fact that so little of the monsoon region [108W–108E from Sultan and Janicot (2003)] can be captured within large LORs suggests that there are po-tentially multiple combinations of dynamical and topo-graphical factors affecting local onset within this region. This is in contrast to, but does not contradict nor con-trovert, earlier findings for regional onset variability.
Local and regional onsets occur over different regions and over different observational time periods and should be considered as separate entities.
There are clear advantages and disadvantages to the spatially uniform LOR method. The identification of regions where onsets occur at a similar time highlights locations where a temporal trigger of onset may exist. However, by setting a strict limit for proximity to the median value of an LOR, the method inherently limits LOR coverage and size across regions of high local variability and where the gradient of local onsets is high. As a result, spatially uniform LORs tend to be ‘‘wide and short’’ (longitudinal length scale . latitudinal length scale). Computing spatially uniform LORs using onset anomaly data does not change the size or location of LORs found with the exception of the region 208– 108W. By contrast, interannual LORs cover larger lat-itudinal length scales than spatially uniform LORs and therefore can give a useful view of homogeneity of onset not observed in spatially uniform LORs.
LORs have been constructed to allow the median onset date for each year to be considered as a repre-sentative onset across the LOR. This makes practical sensitivity assessment of local onset possible using a fi-nite set of locations (e.g., a rain gauge network). This is one of the main advantages of identifying LORs.
It is suggested here that the level of spatial agreement between onset dates gives some insight into the nature of potential dynamical or topographical onset triggers. In theory, processes occurring on the synoptic scale (such as the response to the Indian monsoon onset) will affect onset dates over a large region if indeed they have any effect on local onsets. By contrast, more localized
processes (such as topographic triggering of convection) will control coherence of onsets over a smaller area. The interaction of different local onset triggers occurring over varying scales (both temporal and spatial) needs further investigation for accurate prediction of local agronomic onset over West Africa to be feasible. The location and size of LORs might give insight into the features that modulate onset.
The interannual LORs found using precipitation data from 1998–2012 are also verified using local onset dates for 2013 and 2014 with the exception of one region in each year. This suggests that despite the high temporal and interannual variability of local onset dates, LORs have much more consistent interannual variability.
Finally, the seasonal progression of the ITF, taken here as the northward extent of the 158C isodrosotherm, is shown to be directly linked to onset dates across West Africa. Across almost all correlating LORs the average lead time between the localized ITF advancement and median local onset date is greater than two weeks, al-though the exact dynamics for this link are not currently understood. This result provides a link between local agronomic onset and a readily measurable metric that occurs prior to agronomic onset. The seasonal transition of the ITF is less spatially and temporally noisy than
local precipitation and also less dependent on dataset choice [cf. Fig. 5 inRoberts et al. (2015)to the findings of
Fitzpatrick et al. (2015)]. The link shown here supports the findings ofIlesanmi (1971), who shows that station rainfall totals are well correlated with the positioning of the ITF. The identification of other similar links could help improve local onset prediction.
The work presented here provides a first step in bridging the gap between regional climate dynamics and local onset variability. A better understanding of the limits of predictability of local onset as well as the cause of interannual variability of local onset will provide relevant information for local stakeholders across the region and help provide a platform on which future re-search into local onset variability can be performed.
Acknowledgments.This work has been completed as part of the CASE studentship Grant NE/J017345/1 in conjunction with the Met Office. The sponsoring body is the Natural Environment Research Council (NERC). In addition, the research leading to these results has received partial funding from the NERC/DFID Fu-ture Climate for Africa program under the AMMA-2050 project; Grant NE/M020126/1. Parker and Marsham were also partially supported by the IMPALA
(NE/M017176/1) and VERA (NE/M003574/1) projects with Marsham receiving additional support by the SWAMMA project (NE/L005352/1). The authors would like to express their deep gratitude to the reviewers and editors of this journal for their valuable contributions to the work, in particular the suggestions made regarding
section 4, which led to more impactful research.
REFERENCES
Bain, C. L., K. D. Williams, S. F. Milton, and J. T. Heming, 2014: Objective tracking of African easterly waves.Quart. J. Roy. Meteor. Soc.,140, 47–57, doi:10.1002/qj.2110.
Berry, G., and C. D. Thorncroft, 2005: Case study of an intense African easterly wave. Mon. Wea. Rev., 133, 752–766, doi:10.1175/MWR2884.1.
Bou Karam, D., C. Flamant, P. Knippertz, O. Reitebuch, J. Pelon, M. Chong, and A. Dabas, 2008: Dust emissions over the Sahel associated with the West African monsoon intertropical dis-continuity region: A representative case-study.Quart. J. Roy. Meteor. Soc.,134, 621–634, doi:10.1002/qj.244.
Caniaux, G., H. Giordani, J.-L. Redelsperger, F. Guichard, E. Key, and M. Wade, 2011: Coupling between the Atlantic cold tongue and the West African monsoon in boreal spring and summer. J. Geophys. Res.,116, C04003, doi:10.1029/ 2010JC006570.
Dee, D. P., and Coauthors, 2011: The ERA-Interim reanalysis: Configuration and performance of the data assimilation sys-tem.Quart. J. Roy. Meteor. Soc.,137, 553–597, doi:10.1002/ qj.828.
Ewansiha, S. U., and B. B. Singh, 2006: Relative drought tolerance of important herbaceous legumes and cereals in the moist and semi-arid regions of West Africa.J. Food Agric. Environ.,4, 188–190.
Fink, A. H., and A. Reiner, 2003: Spatiotemporal variability of the relation between African easterly waves and West African squall lines in 1998 and 1999. J. Geophys. Res.,108, 4332, doi:10.1029/2002JD002816.
Fitzpatrick, R. G. J., 2015: RMetS national meeting—Forecasting in Africa.Weather,70, 176–177, doi:10.1002/wea.2487. ——, C. L. Bain, P. Knippertz, J. H. Marsham, and D. J. Parker,
2015: The West African monsoon onset: A concise compar-ison of definitions. J. Climate,28, 8673–8694, doi:10.1175/ JCLI-D-15-0265.1.
Flamant, C., and Coauthors, 2007: Airborne observations of the impact of a convective system on the planetary boundary layer thermodynamics and aerosol distribution in the inter-tropical discontinuity region of the West Africa monsoon. Quart. J. Roy. Meteor. Soc.,133, 1175–1189, doi:10.1002/qj.97. Flaounas, E., S. Janicot, S. Bastin, and R. Roca, 2012a: The West
African monsoon onset in 2006: Sensitivity to surface albedo, orography, SST, and synoptic scale dry-air intrusions using WRF.
Climate Dyn.,38, 685–708, doi:10.1007/s00382-011-1255-2. ——, ——, ——, ——, and E. Mohino, 2012b: The role of the
In-dian monsoon onset in the West African monsoon onset: Observations and AGCM nudged simulations.Climate Dyn.,
38, 965–983, doi:10.1007/s00382-011-1045-x.
Fontaine, B., and S. Louvet, 2006: Sudan-Sahel rainfall onset: Definition of an objective index, types of years, and experi-mental hindcasts.J. Geophys. Res.,111, D20103, doi:10.1029/ 2005JD007019.
——, ——, and P. Roucou, 2008: Definitions and predictability of an OLR-based West African monsoon onset.Int. J. Climatol.,
28, 1787–1798, doi:10.1002/joc.1674.
Gazeaux, J., E. Flaounas, P. Naveau, and A. Hannart, 2011: In-ferring change points and nonlinear trends in multivariate time series: Application to West African monsoon onset tim-ings estimation.J. Geophys. Res.,116, D05101, doi:10.1029/ 2010JD014723.
Hastenrath, S., 1991: Climate Dynamics of the Tropics. Kluwer Academic, 488 pp.
Huffman, G. J., and Coauthors, 2007: The TRMM Multi-Satellite Precipitation Analysis: Quasi-global, multi-year, combined-sensor precipitation estimates at fine scale.J. Hydrometeor.,8, 38–55, doi:10.1175/JHM560.1.
Ilesanmi, O. O., 1971: An empirical formulation of an ITF rainfall model for the tropics: A case study of Nigeria.J. Appl. Me-teor., 10, 882–891, doi:10.1175/1520-0450(1971)010,0882: AEFOAI.2.0.CO;2.
Ingram, K. T., M. C. Roncoli, and P. H. Kirshen, 2002: Opportu-nities and constraints for farmers of west Africa to use sea-sonal precipitation forecasts with Burkina Faso as a case study.
Agric. Syst.,74, 331–349, doi:10.1016/S0308-521X(02)00044-6. Lavaysse, C., C. Flamant, S. Janicot, D. J. Parker, J.-P. Lafore, B. Sultan, and P. Pelon, 2009: Seasonal evolution of the West African heat low: A climatological perspective.Climate Dyn.,
33, 313–330, doi:10.1007/s00382-009-0553-4.
Lavender, S. L., and A. J. Matthews, 2009: Response of the West African monsoon to the Madden–Julian oscillation.J. Climate,
22, 4097–4116, doi:10.1175/2009JCLI2773.1.
Lélé, I. M., and P. J. Lamb, 2010: Variability of the intertropical front (ITF) and rainfall over the West African Sudan–Sahel zone.J. Climate,23, 3984–4004, doi:10.1175/2010JCLI3277.1. ——, L. M. Leslie, and P. J. Lamb, 2015: Analysis of low-level
at-mospheric moisture transport associated with the West Afri-can monsoon. J. Climate, 28, 4414–4430, doi:10.1175/ JCLI-D-14-00746.1.
Maloney, E. D., and J. Shaman, 2008: Intraseasonal variability of the West African monsoon and Atlantic ITCZ.J. Climate,21, 2898–2918, doi:10.1175/2007JCLI1999.1.
Marteau, R., V. Moron, and N. Philippon, 2009: Spatial coherence of monsoon onset over western and central Sahel (1950–2000).
J. Climate,22, 1313–1324, doi:10.1175/2008JCLI2383.1. Mera, R., A. G. Laing, and F. Semazzi, 2014: Moisture
vari-ability and multiscale interactions during spring in West Africa. Mon. Wea. Rev., 142, 3178–3198, doi:10.1175/ MWR-D-13-00175.1.
Molesworth, A. M., L. E. Cuevas, S. J. Connor, A. P. Morse, and M. C. Thomson, 2003: Environmental risk and meningitis epidemics in Africa. Emerg. Infect. Dis., 9, 1287–1293, doi:10.3201/eid0910.030182.
Omotosho, J. B., A. A. Balogun, and K. Ogunjobi, 2000: Predicting monthly and seasonal rainfall, onset and cessation of the rainy season in West Africa using only surface data.Int. J. Climatol.,
20, 865–880, doi:10.1002/1097-0088(20000630)20:8,865:: AID-JOC505.3.0.CO;2-R.
Roberts, A. J., J. H. Marsham, and P. Knippertz, 2015: Disagree-ments in low-level moisture between (re)analyses over sum-mertime West Africa. Mon. Wea. Rev., 143, 1193–1211, doi:10.1175/MWR-D-14-00218.1.
Rowell, D. P., 2013: Simulating SST teleconnections to Africa: What is the state of the art? J. Climate, 26, 5397–5418, doi:10.1175/JCLI-D-12-00761.1.
Sultan, B., and S. Janicot, 2003: The West African monsoon dynamics. Part II: The ‘‘preonset’’ and ‘‘onset’’ of the summer monsoon.J. Climate,16, 3407–3427, doi:10.1175/ 1520-0442(2003)016,3407:TWAMDP.2.0.CO;2.
——, C. Baron, M. Dingkuhn, B. Sarr, and S. Janicot, 2005a: Ag-ricultural impacts of large-scale variability of the West African monsoon. Agric. For. Meteor., 128, 93–110, doi:10.1016/ j.agrformet.2004.08.005.
——, K. Labadi, J.-F. Guegan, and S. Janicot, 2005b: Climate drives the meningitis epidemics onset in West Africa.PLoS Med.,2(1), e6, doi:10.1371/journal.pmed.0020006.
Vellinga, M., A. Arribas, and R. Graham, 2013: Seasonal forecasts for regional onset of the West African monsoon.J. Climate Dyn.,40, 3047–3070, doi:10.1007/s00382-012-1520-z. Walker, H. O., 1957: Weather and climate of Ghana. Ghana
Me-teorological Department.
West Africa Regional Health Working Group, 2012: Sahel Food and Health Crisis: Emergency Health Strategy. WHO, 28 pp. [Available online at http://www.who.int/hac/sahel_health_ strategy_21june2012rev.pdf.]