This is a repository copy of Banking reforms, performance and risk in China. White Rose Research Online URL for this paper:
http://eprints.whiterose.ac.uk/109761/ Version: Accepted Version
Article:
He, L., Chen, L. and Hong Liu, F. (2017) Banking reforms, performance and risk in China. Applied Economics. ISSN 0003-6846
https://doi.org/10.1080/00036846.2016.1273501
eprints@whiterose.ac.uk https://eprints.whiterose.ac.uk/
Reuse
Items deposited in White Rose Research Online are protected by copyright, with all rights reserved unless indicated otherwise. They may be downloaded and/or printed for private study, or other acts as permitted by national copyright laws. The publisher or other rights holders may allow further reproduction and re-use of the full text version. This is indicated by the licence information on the White Rose Research Online record for the item.
Takedown
If you consider content in White Rose Research Online to be in breach of UK law, please notify us by
1
Banking reforms, performance and risk in China
Liangliang He a, Lei Chen b, Frank Hong Liu c,
a
Nanjing University of Information Science & Technology, China
b
University of Sheffield, United Kingdom
c
University of Glasgow, United Kingdom
29 November 2016
Abstract
We investigate the impact of the banking reform started from 2005 on ownership structures in China on commercial banks’ profitability, efficiency and risk over the period 2000-2012, providing comprehensive evidence on the impact of banking reform in China. We find that banks on average tend to have higher profitability, lower risk and lower efficiency after the reforms, and the results are robust with our difference-in-difference approach. Our results also show that the Big 5 state-owned banks underperform banks with other types of ownership when risk is measured by non-performing loans (NPLs) over the entire study period, but tend to have fewer NPLs than other banks during the post-reform period. Our results provide some supporting evidence on the ongoing banking reforms in China, suggesting that attracting strategic foreign investors and listing state-owned banks on stock exchanges appear to be effective ways to help state-owned banks deal with the problem of NPLs and manage their risk.
Key words: Bank reforms, performance, efficiency, risk, ownership structure
JEL classification: G21, G28, G32
Corresponding author: Frank Hong Liu, University of Glasgow, Adam Smith Business School, Room 471,
2
1. Introduction
The Chinese economy has global significance, and the banking system in China plays a
crucial role in maintaining a healthy economy. Since 1978, the Chinese banking sector has
undergone significant reforms to transform the sector into a modern banking system based on
market and profitability functions (García-Herrero, Gavilá, and Santabárbara 2009). The
process of reform has been accelerated after China joined the WTO at the end of 2001.
Differing from banking reforms in transition economies in Central and Eastern
Europe, where new banking systems were created, Chinese banking reform tends to be more
gradual (Jiang, Yao, and Feng 2013). Because the banking reform in China appears to have
tremendous success in risk management and performance and efficiency improvement (e.g.,
Wang et al. 2014; Allen et al. 2014), experiences and lessons from China will be of particular
interest to other transition economies (Jiang, Yao, and Feng 2013).
A number of studies have examined how Chinese banks’ performance has responded
to banking reforms. However, most of them used data prior to the great financial crisis of
2007. Since 2005, remarkable changes of ownership structure (e.g., encouraging foreign
investments and public listing) have been seen in major Chinese banks, but little is known
about the impact of such reform. Although a few studies have investigated how Chinese
banks performed after 2005, they tend to focus on large, either state-owned or joint-stock
commercial banks (e.g., Allen et al. 2014; Wang et al. 2014). This paper attempts to address
the changes in the performance and risk levels of different types of Chinese banks over the
period of 2000-2012, with particular interest in the year of 2005 when radical reform
measures were adopted. It contributes to the literature in several ways.
First, previous studies of banking reforms focus mainly on the profitability and/or
efficiency of Chinese banks (e.g., Heffernan and Fu 2010; Deng, Guo, and Kong 2011; Jiang,
3
significant problems for the Chinese banking sector is the state-owned banks’ level of
non-performing loans (NPLs), which has been largely overlooked until very recently (Allen et al.
2014; Jiang, Yao, and Feng 2013). This paper addresses this under-researched area and
assesses Chinese banks’ risk-taking by using the measures of NPLs and Z-score.
Second, our study provides comprehensive and up-to-date evidence on the impacts of
banking reforms in China. It uses a bigger sample of more Chinese commercial banks than
previous empirical studies, and also takes into consideration the effect of the 2007-09
financial crisis to which little attention has been paid. This study, therefore, enriches our
understanding of the impacts of banking reforms and offers important implications for policy
makers in China and other developing countries. Our results indicate that the banking reforms
in 2005 had a significant impact on Chinese banks’ performance. Specifically, banks tend to
have improved profitability and lower risk, but have lower efficiency scores after 2005,
suggesting that the reform measures adopted since 2005 are steps in the right direction of
Chinese banking reform, but further reforms should be taken to improve the efficiency of
Chinese banks.
Third, we provide further evidence on bank ownership reform. Our results show that
the Big 5 state-owned banks outperform banks with joint-stock ownership and city
commercial banks in terms of overall risk as measured by Z-score, but underperform them
over the entire study period when risk is measured by the NPLs. However, employing the
difference-in-difference approach (DiD), we find that the Big 5 have lower NPLs than other
banks during the post-reform period. This suggests that the “Chinese model” (Allen et al.
2014) of banking reforms, which attracts strategic foreign investors and lists state-owned
banks on stock exchanges yet keeps control ultimately in the hands of the government,
4
The remainder of the paper is organized as follows. Section 2 reviews the process of
Chinese banking reform, and Section 3 discusses the literature related to the study. Our data,
empirical models and variables used in the regression analysis are presented in Section 4.
Section 5 reports the empirical results. Section 6 concludes the paper.
2. The reform of the Chinese banking sector
Established in 1949, the Chinese banking system initially followed a mono-bank model, in
which the central bank, the People’s Bank of China (PBOC), also played the role of
commercial banking to serve the nation’s centrally-planned economy (Berger, Hasan, and
Zhou 2009; Zhang et al. 2013). In order to transform a policy-driven and monopolistic
banking system into a competitive, market-oriented one (Dong et al. 2014), China has
adopted a gradual reform approach since 1978.1 Four state-owned banks (SOCBs), namely the Bank of China (BOC), the China Construction Bank (CCB), the Agricultural Bank of
China (ABC) and the Industrial and Commercial Bank of China (ICBC), were split from the
PBOC,2 and took over the commercial bank business, such as lending functions.
From 1985 to 1992, a more intensely competitive environment was created by
allowing the entry of new domestic banks and the expansion of the business sector of the four
SOCBs. A number of joint-stock commercial banks (JSCBs) were established, and Rural
Credit Cooperatives (RCCs) and Urban Credit Cooperatives (UCCs) were launched to serve
individuals and small and medium-sized rural/urban enterprises. In 1994, three policy banks
were established to separate policy lending from commercial lending, and the role of SOCBs
as ‘commercial banks’ were clearly defined by the Commercial Bank Law of China. The
government took several steps to help the SOCBs clean up their deteriorated balance sheets
and promote commercial lending, e.g., establishing four state-owned asset management
5
Since joining the WTO in December 2001, China has committed to opening up its
banking sector to foreign competitors. The process of reform has been accelerated since 2003,
and several significant policies have been implemented in order to improve the corporate
governance and capital structure of state-owned banks, as well as to encourage foreign
investment. The year 2005 is particularly remarkable, as it marked further opening up to
foreign investors and the accelerated privatization of the SOCBs.
In December 2005, China Bohai Bank was established, the first Chinese bank to be
set up with a foreign minority stake. Around this time, foreign strategic investors also made
deals to take on minority foreign ownership in SOCBs. For instance, in October 2005, a
US$3.1 billion investment in the BOC was announced by the Royal Bank of Scotland, which
accounted for approximately 10% of the BOC’s ownership. By the end of 2006, about 30
foreign financial institutions had purchased stakes in 21 Chinese commercial banks, with a
total investment of US$19 billion (Okazaki 2007). Moreover, foreign banks have been treated
similarly to domestic banks in many aspects since 2006, and the number of foreign bank
entities has grown rapidly, almost doubling from 2004 to 2012 (Luo et al. 2015).
The Chinese government encouraged the privatization of SOCBs not only by
attracting foreign institutional investors as minority shareholders but also by listing them on
stock exchanges. The Bank of Communications (BOCOM)3 was the first to take this route, issuing an IPO in Hong Kong in June 2005 (Berger, Hasan, and Zhou 2009). After that, all
SOCBs undertook successful IPOs and were listed on stock exchanges by 2010.4 By opening to foreign investors and going public, the wholly state-owned Chinese banks diversified their
ownership and became joint-stock commercial banks.
At present, the Chinese banking sector is dominated by the five largest SOCBs: ABC,
BOC, CCB, ICBC and BOCOM. Apart from the Big 5 (previously the Big 4), 12 national
6
RCBs)5 comprise the domestic commercial banking system, which also includes newly established foreign banks, including Chinese-foreign joint-equity banks and banks with
exclusively foreign ownership.
A number of studies have examined how Chinese banks’ performance was affected by
financial reforms, though most have used data prior to 2005 (e.g., Ariff and Can 2008;
García-Herrero, Gavilá, and Santabárbara 2009; Berger, Hasan, and Zhou 2009; Lin and
Zhang 2009; Jiang, Yao and Zhang 2009; Yao et al. 2007). Although banking reform in
China is happening gradually, more radical reform measures have been adopted since 2005,
such as further opening up to foreign investors and accelerated privatization of SOCBs. This
paper attempts to fill this research gap by examining how different types of Chinese banks
performed in terms of profitability, efficiency and risk before and after 2005, providing
important evidence that is of interest to both academics and policy makers.
This paper also attempts to assess the impact of the 2007-2009 financial crisis on the
performance impact of banking reforms, for which there is very little evidence in China.
Wang et al. (2014) argue that the "Chinese model" of banking reform shows its positive
impact on maintaining systemic stability during the global financial crisis. However, their
study focuses only on large state-owned banks in China and does not present a full picture of
how performance and risk in Chinese banks changed during periods of economic fluctuation.
This paper, therefore, attempts to provide more comprehensive evidence on the
impact of banking reforms in China by examining changes in the performance and risk of
banks with different ownership structures before and after the 2005 reforms, and
incorporating the effects of the 2007-2009 financial crisis.
3. Literature review
7
One of the main objectives of banking reform in both developed and developing countries is
to improve the efficiency and profitability of banks (Berger and Humphrey 1997).
Privatization of banks is expected to enhance the level of competition in the banking sector
and in turn improve overall performance (Clarke, Cull, and Shirley 2005). Literature on
whether banking reforms can achieve these initiatives has not, however, reached agreement.
Early research in the US reveals unchanged or even decreased bank efficiency post-reform
(e.g., Berger and Mester 1997), and similar results are found by several cross-county studies
(e.g., Boubakri et al. 2005).
On the other hand, Brissimis, Delis, and Papanikolaou (2008) find a positive impact
of banking reform on efficiency in newly acceded EU countries from 1994 to 2005. Improved
cost efficiency brought about by banking reforms has also been reported in other countries,
such as Australia (Sturm and Williams 2004). These results are consistent with the belief that
banking reforms should be able to help banks achieve efficiency gains. In a less competitive
market, banks are likely to behave inefficiently, as they can avoid minimizing cost without
being forced out of the market (Fu and Heffernan 2009). Privatization and foreign bank
penetration increase the level of competition in the banking sector and therefore encourage
banks to operate more efficiently. Demirguc-Kunt and Huizinga (1999) examine the effects
of the entry of foreign banks into different countries, and find that in most cases foreign entry
forces domestic banks to improve their efficiency.
Evidence on whether banking reform can improve profitability of banks is also
ambiguous. Humphrey and Pulley (1997) find that deregulation of interest rates reduced
profitability of US banks, while Boubakri et al. (2005) show that profitability of banks
increases during post-privatisation period in 22 developing countries. Chronopoulos, Liu,
McMillan, and Wilson (2015) examine how key regulatory events in the US affect the
8
Riegle–Neal IBBEA Act that eliminated federal restrictions on interstate banking resulted in
reduced profits persistence and bank profit levels, while the introduction of GLB Act which
allowed banks to diversify across business segments increased profits persistence and profit
levels.
Bank performance during the reform process appears to differ depending on its
ownership structure. State-owned banks are found to underperform private banks in many
countries (e.g., Cornett et al. 2010; Weintraub and Nakane 2005). Foreign-owned banks tend
to outperform domestically owned banks in general, as they have the advantages of serving
multinational customers, access to capital and use of technology (Berger 2007). However,
contradictory evidence is provided by Naaborg and Lensink (2008), who find a negative
relationship between foreign ownership and bank profitability in a cross-section study in
Central and Eastern Europe and Central Asia.
Whether the banking reforms in China have been an effective way to improve the
performance of Chinese commercial banks remains doubtful, as empirical evidence tends to
be limited and the impact of recent reforms is unclear (Berger, Hasan, and Zhou 2009, Luo
and Yao 2010). Berger, Hasan, and Zhou (2009) argue that minority foreign ownership may
increase Chinese bank efficiency through improving corporate governance, technological
advancement and risk management. Listing on stock exchanges can place market pressure on
banks and encourage them to maximize value and improve information transparency, which
in turn will result in efficiency gains. The authors find a strong favourable effect on
efficiency from reducing state ownership of banks and increasing the role of foreign
ownership in China during the period of 1994 to 2003. Similarly, Luo and Yao (2010) find
that over 1999-2008, after listing, Chinese bank efficiency increased by almost 5%. Luo et al.
(2015) show that foreign bank penetration is associated with improved profitability and
9
find that the overall efficiency of the Chinese banking system improves over the period
2003-2011 because of the reforms. However, Fu and Heffernan (2009) provide contradictory
evidence, showing that the X-efficiency of Chinese banks on average declines significantly
during the period 1985 to 2002, and that most banks are operating below scale efficient levels.
Conclusions regarding the difference in performance between banks with different
ownership are also mixed (Wang et al. 2014). Lin and Zhang (2009) find that the Big 4
state-owned banks are less profitable than other types of banks in China, and banks undergoing a
foreign acquisition or public listing record better pre-event performance over the period of
1997-2004. Ariff and Can’s (2008) study shows that SOCBs on average are less cost- and
profit-efficient than JSCBs over the period of 1995-2004. Nevertheless, using data for
Chinese commercial banks from 1998 to 2007, Firth, Li, and Wang (2013) show that the
financial performance of the Big 4 is not inferior to other banks. Wang et al.’s (2014)
findings suggest that SOCBs appear to be overall more efficient than JSCBs, but such an
efficiency difference is only seen in the pre-reform period, and is reduced over the
post-reform period.
3.2 Reform and bank risk
The traditional structure-conduct-performance (SCP) hypothesis predicts that higher levels of
market concentration are likely to lead to an increase in the market power of banks, which
allows them to enjoy higher loan rates and lower deposit rates (Fu and Heffernan 2009). A
more competitive banking sector resulting from privatization could result in a decline of bank
chart value, which encourages bankers to take excessive risks and in turn increases banks’
default risk (Keeley 1990). Moreover, private shareholders are likely to engage in higher risk
activities so as to maximize the value of the option/share (Boubakri et al. 2005), and to lend
10
and Shirley 2005). The entry of foreign ownership will further enhance competition in the
banking sector and increase banks’ risk. The positive relationship between foreign ownership
and bank risk-taking has been confirmed by some empirical studies (e.g., Lee and Hsieh
2014).
Nevertheless, privatization is also likely to change banks’ risk-taking behaviour in a
favourable way, as new shareholders will be better at monitoring the management of
risk-taking (Boubakri et al. 2005). State-owned banks are argued to be associated with high risk
due to political interference (Clarke, Cull, and Shirley 2005; Dong et al. 2014), and the
privatization of state-owned banks is likely to limit harmful government interference and
improve the quality of lending through improved screening (Clarke, Cull, and Shirley 2005).
Some empirical evidence shows that state-owned banks tend to have higher default risk than
privately owned banks (e.g., Berger et al. 2005; Cornett et al. 2010). Moreover, foreign banks
may have a positive influence on the stability of emerging market banking systems, as the
entry of foreign investors is accompanied by advanced knowledge, skills and technology, and
therefore contributes to an improved control and risk management environment in the
domestic banking sector (Crystal, Dages, and Goldberg 2001).
Extant literature on the effect of Chinese banking reforms mainly focuses on
performance measures such as efficiency and profitability. Very few studies have
investigated the impact of ownership structure on Chinese banks’ risk-taking behaviour
during the reform process (e.g., Allen et al. 2014; Dong et al. 2014; Jia 2009), and their
findings are contradictory. Dong et al. (2014) find that government-controlled banks tend to
take more risks than other types of banks due to political intervention and weak risk
management practice. Allen et al. (2014), on the other hand, argue that the government can
impose non-profit goals via the state-owned banks, such as systemic stability of the financial
11
be of importance to the overall risk control of Chinese banking system. The authors suggest
that the privatization of Chinese state-owned banks via listing on stock exchanges has been
successful in improving their performance and risk management.
As can be seen from the above discussion, empirical evidence on the impact of
banking reforms in China is insufficient and inconclusive. Moreover, with the exception of
Allen et al. (2014), there is a lack of research on the changes in bank performance and risk
during and after the global financial crisis. We intend to add more evidence to this
under-researched issue, focusing on an examination of how banking reforms in China affect
Chinese banks’ performance and risk before and after 2005 and incorporating the 2007-2009
financial crisis. This paper, therefore, is intended to extend knowledge of banking reforms in
developing economies by providing comprehensive and up-to-date evidence.
4. Methodology
4.1 Data
The data used in this study is mainly collected from the BankScope database. It covers the
period of 2000 to 2012, with more than 1,200 observations for a sample of 184 Chinese
commercial banks. It includes data for 94 banks during the pre-regulation period (2000-2005)
and for 172 banks during the period of 2006 to 2012.
4.2 Model
We apply OLS regressions with clustered standard errors at the bank level to examine the
impact of banking reforms in 2005 on Chinese banks’ profitability, efficiency and risk-taking,
comparing banks with different types of ownership structure. Six bank ownership indicators
are used to differentiate Chinese banks, namely, the Big 5, joint-stock commercial banks
12
banks with minority foreign ownership. We also introduce a dummy variable to examine
whether listing on stock exchanges impacts bank performance and risk. Furthermore,
variables of bank-specific characteristics and macroeconomics are included in the models
since they are shown to be the determinants of bank performance and stability by previous
studies. The basic regression model is specified as below:
Bank performance/risk measure = Constant + 1* banking reform dummy
+ 2*ownership indicators
+ 3*bank-specific characteristics
+ 4*crisis dummy + Error term
Where the banking reform dummy is 1 for the years after 2005 and 0 otherwise.
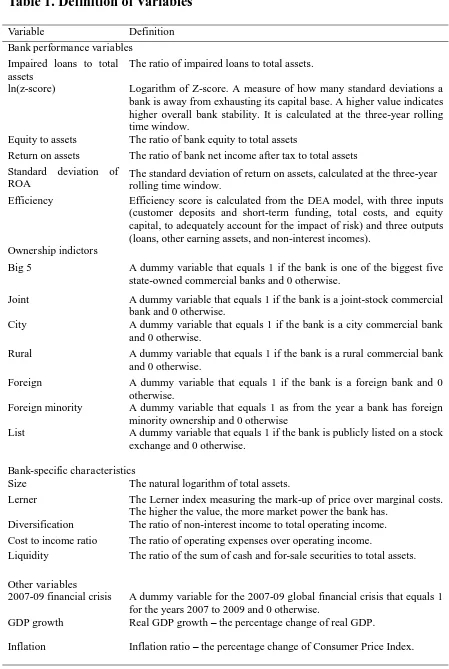
Detailed definitions of the variables used in the model are shown in Table 1.
[Insert Table 1 Here]
4.3 Bank performance measure
Bank efficiency is normally measured by the distance of the financial institutions from a
best-practice frontier (Berger and Humphrey 1997; Brissimis, Delis, and Papanikolaou 2008),
using various parametric or non-parametric approaches.6 One of the most widely used non-parametric methods is data envelopment analysis (DEA), which is based on a linear
programming input-output technique and yields a convex production possibility set (Berger
and Humphrey 1997; Brissimis, Delis, and Papanikolaou 2008). The advantage of DEA
approach is that it does not require the explicit specification of the functional form of the
production frontier (Berger and Humphrey 1997). In view of the characteristics of the dataset
such as the relatively small number of Chinese banks, the DEA approach is employed in our
study to estimate the efficiency score of Chinese banks. It is calculated by three inputs
13
account for the impact of risk) and three outputs (loans, other earning assets, and non-interest
incomes).
We use two measures of bank risk: the ratio of impaired loans to total assets and
Z-score. Z-score has been widely used in empirical literature to measure overall bank risk (e.g.,
Berger, Hasan, and Zhou 2009; Dong et al. 2014; Liu and Wilson 2013; Soedarmono,
Machrouh, and Tarazi 2013); it reflects the extent to which banks have enough capital to
absorb losses (Liu, Molyneux, and Wilson 2013). The higher the Z-score value, the lower a
bank’s risk and the greater its stability. In order to capture the dynamics of bank risk, we
follow the work of Liu and Wilson (2013), using a three-year rolling window to calculate the
standard deviation of return on assets. Because the Z-score is highly skewed (Laeven and
Levine 2009, Liu et al. 2013), the natural logarithm of it is used in our models. We also
employ the ratio of impaired loans to total assets to measure non-performing loans (NPLs).
The NPLs problem is a crucial issue in Chinese banking sector, but has been overlooked by
existing studies (Jiang, Yao, and Feng 2013). During the reform process, the Chinese
government has taken several steps to help SOCBs clean up deteriorated balance sheets. It
would be of interest to see whether the banking reforms have lowered the level of NPLs in
China.
Return on assets (ROA) and return on equity (ROE) are commonly used to measure
bank profitability. As ROE disregards the greater risks associated with high leverage (low
equity), which is determined to some extent by regulation (Athanasoglou, Brissimis, and
Delis 2005), ROA is used to measure the profitability of banks in this study.
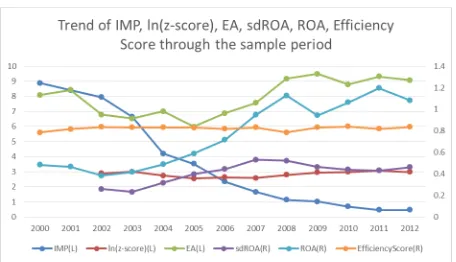
Figure 1 shows the trend of bank performance over the sample period.
14
We also employ a difference-in-difference approach (DiD) (Meyer 1995; Angrist and
Krueger 1999), which is widely used in applied economics to estimate the effect of policy
intervention (Athey and Imbens 2006). DiD estimation identifies a specific intervention or
treatment, and then compares the difference in outcomes before and after the intervention for
groups affected by the intervention with the corresponding difference for unaffected groups
(Bertrand, Duflo, and Mullainathan 2004). It has the potential to circumvent many of the
endogeneity problems that typically arise when making comparisons between heterogeneous
individuals (Bertrand, Duflo, and Mullainathan 2004; Meyer 1995). We use the year 2005 as
the intervention and the Big 5 as the affected group, because some radical reform measures
adopted in 2005 mainly applied to the privatization of SOCBs (see discussion in Section 2).
4.4 Other control variables
We consider a range of bank-specific characteristics that are likely to affect bank
performance and risk, including market power of banks, bank size, cost ratio, diversification
and liquidity.
The previous literature has shown that competition can affect banks’ risk-taking,
although the sign of the relationship is not agreed upon. One school of thought, which is
well-known as “competition-fragility”, argues that an increase in competition encourages
excessive risk-taking and a reduction in capital, thereby increasing the risk of bank failure
(Keeley 1990). On the other hand, the “competition-stability” view argues that declined
competition induces banks to offer loans at high rates and therefore increases the bankruptcy
risk for bank borrowers, which in turn increases the risk of banks through risk-shifting
mechanisms in the overall market (Soedarmono, Machrouh, and Tarazi 2013). Studies such
as Boyd, De Nicoló, and Jalal (2006) and Soedarmono, Machrouh, and Tarazi (2013) provide
15
that the link between competition and bank risk is more complicated than a linear positive or
negative relationship (e.g., Liu, Molyneux, and Wilson 2013).
Considering the aforementioned literature, we incorporate a proxy of bank
competition in our investigation. Following Liu and Wilson (2013), we use the Lerner index
to measure the market power of banks. The higher the Lerner index value, the more market
power a bank has and the lower the level of competition it faces.
Bank size is likely to affect bank profitability, but the direction of influence tends to
be ambiguous. Large banks have a competitive edge due to economies of scale and therefore
tend to be more profitable (e.g., Goddard, Molyneux, and Wilson 2004). However, large size
may be related to an aggressive growth strategy and may make it hard to manage the bank
(García-Herrero, Gavilá, and Santabárbara 2009). Likewise, literature on the risk effect of
bank size offers contradictory suggestions. Larger banks are likely to be more stable than
smaller banks due to the benefits of economies of scale and market power (Berger 1995), but
they may have an incentive to increase their risk of operations (O'Hara and Shaw 1990).
Cost-to-income (CI) ratio is expected to be negatively related to bank profitability and
efficiency, and positively related to bank risk (e.g., Liu and Wilson 2010, 2013; Berger 1995).
If managers choose less profitable assets and high-cost liabilities, profitability should
decrease with a high cost ratio, thereby leading to low managerial efficiency and encouraging
banks to take on more risk in order to increase returns (Boyd, De Nicoló, and Jalal 2006; Liu
and Wilson 2013). Nevertheless, profits would decrease if banks with higher operational
efficiency pass the low cost on to their customers in the form of lower loan rates and/or
higher deposit rates (Liu and Wilson 2010).
Diversification is argued to be associated with improved bank performance via
economies of scale and scope, as well as the reduction of idiosyncratic risk (Stiroh 2010).
16
from less traditional financial activities may offset the positive risk-spreading benefits of
diversification. Liu and Wilson (2013) find that diversified banks in Japan tend to be riskier
than their focused counterparts.
Bank liquidity may impact positively on bank profitability and efficiency, while
impacting negatively on bank risk. Banks with a lower level of liquidity tend to carry more
risk because they are more likely to make a fire-sale of their assets to meet demand for
liquidity (Liu and Wilson 2010). However, Berger et al. (2005) claim that bank liquidity is
affected to varying degrees by characteristics such as size and market power.
We also include several macro environmental variables. The first is inflation. Liu and
Wilson (2013) argue that higher inflation is likely to adversely affect the soundness of
financial systems by distorting decision-making, exacerbating information asymmetry and
introducing price volatility. GDP growth (GDPG) is another important determinant of bank
performance. Liu and Wilson (2010) suggest that high economic growth improves business
environment and lowers bank entry barriers, which may dampen banks’ profitability. With
regard to bank risk, improved economic conditions provide banks with more investment
opportunities. As a result, banks may have incentives to take on riskier investment projects
(Liu and Wilson 2013).
We introduce a dummy variable to capture the impact of the 2007-2009 financial
crisis on Chinese banks’ performance. Research shows that the performance of banks in some
developed countries is negatively affected by adverse economic conditions (e.g., Kanas,
Vasiliou, and Eriotis 2012). Compared with banks in developed countries, banks in China
were much more conservative in derivatives investment and therefore were less influenced by
the crisis (Luo et al. 2011). State-ownership may be also an advantage during the financial
crisis (Liu 2009; Allen et al. 2014). Liu (2009) argues that the health of the Chinese banking
17
strict restrictions on financial institutions from avoiding inferior investments and cutting
interest rates so as to encourage banks to expand lending. Allen et al. (2014) suggest that
government ownership of Chinese banks enabled better enforcement of some non-profit goals
(e.g., systemic stability and continued lending activity) in state-owned banks than in private
banks during the recession and crisis period.
4.5 Summary statistics and correlation
The summary statistics for the dependent and independent variables for all sample banks and
univariate tests of differences between pre-regulation and post-regulation periods are shown
in Table 2.
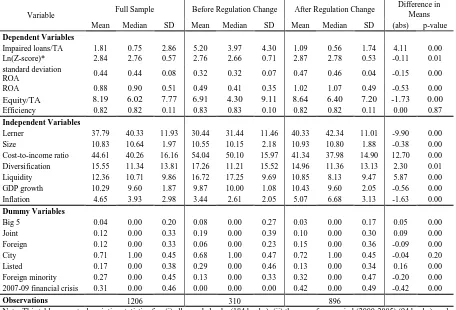
[Insert Table 2 Here]
The table shows that there were 94 banks in China during the pre-reform period
(2000-2005); this increased to 172 during the post-reform period (2006-2012), indicating that
banking reforms in 2005 and afterwards allowed more newly established domestic and
foreign banks to enter the sector, thereby boosting the level of competition. The ration of
mean Impaired Loans/TA is significantly higher before 2005 (5.20) than after (1.09),
suggesting that there was a decline in the level of NPLs in Chinese banks after the 2005
banking reforms. The overall profitability of Chinese banks as measured by ROA appears to
have improved after 2005, as the mean ROA increases from 0.49 to 1.02.
As for bank specific characteristics, the mean value of the Lerner index increases after
regulation change in 2005 (from 30.44 to 40.33). This may suggest that state-owned banks
gained more market power after the 2005 financial reform, and appears to be consistent with
Fungáčováa, Pessarossib, and Weilla (2013), who also find that the mean Lerner index
18
We also observe that the mean values of both cost-to-income ratio and liquidity
decrease after 2005, suggesting that Chinese banks in general have improved operational
efficiency but lowered their level of liquidity during the post-reform period.
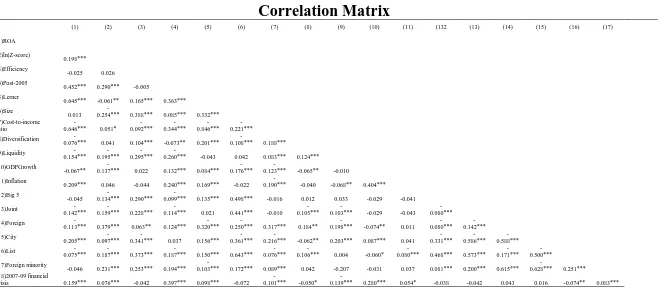
Table 3 reports the correlation matrix among all variables.
[Insert Table 3 Here]
5. Empirical results
5.1 Main results
We first examine the impact of the 2005 banking reforms on bank performance measures by
comparing the Big 5 with non-Big 5 banks.7 Dummy variables for banks with foreign minority ownership and listing on stock exchanges are also included in the regression model
to assess whether the strategy of encouraging foreign investments and public listing
significantly affected bank performance. Table 4 provides the baseline regression results.
[Insert Table 4 Here]
The coefficient on the post-2005 dummy variable is statistically significant at the 1%
level in all models, suggesting that the banking reforms in 2005 significantly affected
Chinese banks’ profitability, efficiency and risk. Chinese banks in general tend to have
improved profitability as measured by ROA, higher equity levels and lower risk as measured
by both NPLs and Z-score after 2005. Deng, Guo, and Kong (2011) observe that the overall
profitability of Chinese banks over the 2001-2007 period improved, due to the presence of
foreign banks. Our results show that the profitability for Chinese banks went up and stayed
up after the banking reform in 2005. This provides further evidence supporting the strategies
of attracting foreign investment and privatizing SOCBs to improve the profitability of
19
However, the efficiency of Chinese banks appears to decline significantly after 2005,
indicating that the privatization and foreign investment strategies did not achieve the
objective of improving the overall efficiency of Chinese banks. Similar findings are reported
by Fu and Huffernan (2009) for Chinese banks during earlier reform periods. They argue that
state lending policies and a lack of clarity about bankruptcy procedures contributed to rising
amounts of bad debt, thereby resulting in inefficient reform from 1985-2002. Our results
suggest that despite the radical reform measures adopted after 2005, the above problem seems
to have persisted within the Chinese banking sector, and the overall efficiency level of
Chinese banks failed to improve.
Regarding ownership structure, it is noteworthy that banks with foreign minority
ownership became more efficient and less risky than other banks. This is consistent with
Berger, Hasan, and Zhou (2009), who argue that minority foreign ownership may increase
Chinese bank efficiency through improving corporate governance, technological
advancement and risk management. We also find that public listing is associated with higher
profitability, greater equity level and lower risk as measured by Z-score, supporting the
argument that listing on stock exchanges can substantially reduce the adverse effects of
government ownership (Allen et al. 2014).
We then conduct bank performance analysis prior to and after 2005 by comparing
joint-stock, foreign, city and rural banks with the Big 5. Table 5 presents the results of the
analysis.
[Insert Table 5 Here]
Findings related to the post-2005 dummy variable, banks with foreign minority
ownership and public listing are consistent with previous analysis. There is no significant
20
banks and rural banks. The Big 5 appear to be more profitable than joint-stock banks, but no
difference is observed compared with other types of banks in terms of ROA. Our findings
contradict some previous empirical studies on Chinese banks (e.g., Lin and Zhang 2009; Ariff
and Can 2008), which observe a lower efficiency level for SOCBs than for other types of
banks. Although the Big 5 are adversely affected by government intervention, they may
benefit from government support (e.g., capital injection and non-performing loan removal)
and scale economies. After accepting strategical foreign investment and listing on stock
exchanges, the adverse impact of government intervention appears to be reduced. This may
partially explain why the Big 5 are not inferior to other banks in terms of their profitability
and efficiency.
With regard to risk, the Big 5 appear to have a higher risk than joint-stock, foreign
and city banks when risk is measured by NPLs during the entire study period. NPLs have
been one of the most significant problems for Chinese banks, especially SOCBs. The total
amount of NPLs within the Chinese banking sector was about 20-23% of GDP in 2000 and
2001, which is much higher than in other large economies (Allen et al. 2014). Although steps
have been taken to reduce the level of non-performing loans in state-owned banks (e.g., the
establishment of AMCs in 1999), the Big 5 tend to behave less prudently in lending due to
political intervention and low levels of accountability. The problem is more pronounced in
rural commercial banks, as government intervention tends to be even stronger in rural China.
Therefore, it is not surprising that rural commercial banks perform the worst in the
abovementioned risk measure compared with other banks.
However, the Big 5 tend to outperform joint-stock and city commercial banks in their
overall risk level as measured by Z-score, suggesting that the Big 5 have more capital to
absorb losses compared with joint-stock and city commercial banks. This can also be seen
21
We also observe that the dummy variable of the 2007-09 financial crisis is negatively
related to Z-score and efficiency, indicating that Chinese banks experienced higher levels of
overall risk and lower levels of efficiency during the period of the 2007-09 financial crisis
than they did in non-crisis periods. During the financial crisis, the Chinese government cut
interest rates twice and stimulated banks to expand their lending activities (Liu 2009),
resulting in a large amount of bad debts in Chinese domestic banks, especially state-owned
banks as they made most of the loans during the crisis. This may have worsened the overall
risk level of Chinese banks. However, the increase in loans issued may have enhanced banks’
capacity to earn more in the market and therefore resulted in higher levels of profitability
(Khan et al. 2011). This is confirmed by the positive relationship between the 2007-09
financial crisis dummy and the ROA in both models.
With regard to control variables, one notable observation is the impact of competition
on bank performance and stability. We observe that, in both the two models, the Lerner index
has a significant negative impact on NPLs and significant positive impacts on Z-score, ROA
and the efficiency measure. This suggests that the more market power a bank has, the more
profitable, more efficient and less risky it is. These results support the “competition-fragility”
view, and also provide evidence on the relation between competition and efficiency in the
Chinese context where only a few empirical studies being conducted (e.g., Fu and Heffernan,
2009; Fungáčováa et al. 2013).
5.2 Difference-in-Difference approach analysis
The year 2005 is considered an exogenous shock after which more radical reform measures
were adopted to accelerate the privatization of state-owned banks. We therefore expect the
impact of the 2005 banking reforms on bank performance to be higher for the Big 5 than for
22
approach, where the Big 5 are defined as the treatment group, and all other banks are defined
as the control group. To account for time trends unrelated to the intervention, the change
experienced by the treatment group is adjusted by the change experienced by the control
group (Athey and Imbens 2006). We introduce a new variable Post*Big 5, which is the cross
product of the two dummy variables of Post-2005 and Big 5. The coefficient of this
interaction term is the key interest of this analysis. It represents the difference in the
difference in outcome measures between the Big 5 and other banks before and after the 2005
banking reform. Results of the DiD analysis are reported in Table 6.
[Insert Table 6 Here]
The interaction term Post*Big 5 is negatively related to the ratio of impaired loans to
assets. It suggests that although the Big 5 have higher risk as measured by NPLs than other
non-state-owned banks during the entire time period of 2000-2012 (as discussed above), their
level of NPLs tends to be reduced after the 2005 banking reforms. This could be a
consequence of both government intervention and privatization of SOCBs. After first
transferring NPLs to AMCs in 1999, additional transfers eventually brought the total NPLs of
nearly 3.6 trillion yuan ($566 billion) off the SOCBs to the AMCs (Martin 2012). In addition,
the involvement of foreign investors and public listing in 2005 helped the SCOBs to
strengthen their corporate governance and risk management, thereby making their lending
activities more prudent. Our findings suggest that, as long as the government remain the
controlling shareholder of the SOCBs, attracting strategic foreign investors and going public
can help state-owned banks to better deal with the problem of NPLs.
The interaction term Post*Big 5 is also negatively related to the Z-score and the
equity to asset ratio, indicating that the differences in bank stability and equity ratio between
23
the impact of banking reform on bank outcome, as we observe reduced differences across
different outcome measures between Big 5 and other more privatized banks after the banking
reforms.
6. Conclusion
Over the past several decades, the Chinese banking sector has undergone significant reforms.
The year 2005 is remarkable in the process of reform; this year saw the adoption of some
radical reform measures, such as significant liberalization to foreign ownership, listing on
stock exchanges and other strategies. This paper aims to investigate the impact of banking
reforms in 2005 on Chinese banks’ profitability, efficiency and risk, comparing banks with
different ownership structures. It also takes into consideration the 2007-2009 financial crisis.
Our results suggest that Chinese banks in general have improved their profitability
and lowered their risk, but have also lowered their efficiency during the post-2005 period. It
implies that the steps taken in Chinese banking reform since 2005 appear to be the right
direction in terms of making banks more profitable and less risky, but that further reforms
should be adopted to improve bank efficiency.
We also provide evidence on the difference in performance and risk of Chinese banks
with different ownership structures, showing that the Big 5 state-owned banks are not inferior
to other types of banks in profitability and efficiency. One interesting finding is although the
Big 5 underperform other banks in terms of the level of NPLs during the entire study period,
they appear to perform better than their competitors over the post-reform period. This
suggests that the “Chinese model” of banking reform can help improve risk management for
state-owned banks. Compared with other developing countries, the Chinese banking sector is
experiencing more gradual reform. Even with the accelerated privatization of state-owned
24
By attracting strategic foreign investors and going public, state-owned banks are better able
to deal with their NPL problems and improve risk management. In addition, such a model
appears to work well in maintaining Chinese banks’ profitability during financial crisis,
though they might be riskier because of government intervention. Consistent with some
previous studies (e.g., Allen et al. 2014), our results provide supporting evidence of the
positive effects of the ongoing banking reforms in China and offer important suggestions for
policy makers in China and other developing countries.
References
Allen, F., J. Qian, S. C. Shan, and M. Zhao. 2014. “The IPO of Industrial and Commercial Bank of China and the ‘Chinese Model’ of privatizing large financial institutions.” The European Journal of Finance 20 (7-9): 599-624.
Angrist, J., and A. Krueger. 1999. “Empirical Strategies in Labour Economics.” Chapter 23 Handbook of Labour Economics, 3 (A): 1277-1366.
25
Athanasoglou, P. P., S. N. Brissimis, and M. D. Delis. 2008. “Bank-Specific, Industry-Specific and Macroeconomic Determinants of Bank Profitability.” Journal of International Financial Markets, Institutions and Money 18 (2): 121-136.
Athey, S., and G. W. Imbens. 2006. “Identification and Inference in Nonlinear Difference-in-Differences Models.” Econometrica 74 (2): 431-497.
Berger, A. N. 1995. “The Profit-Structure Relationship in Banking - Tests of Market-Power and Efficient-Structure Hypotheses.” Journal of Money, Credit, and Banking 27 (2): 404-431.
Berger, A. N. 2007. “International Comparisons of Banking Efficiency.” Financial Markets, Institutions and Instruments 16 (3): 119-144.
Berger, A. N., and D. B. Humphrey. 1997. “Efficiency of Financial Institutions: International Survey and Directions for Future Research.” European Journal of Operational Research 98 (2): 175-212.
Berger, A. N., I. Hasan, and M. Zhou. 2009. “Bank Ownership and Efficiency in China: What will Happen in the World’s Largest Nation?” Journal of Banking and Finance, 33 (1): 113-130.
Berger, A.N., Mester, L.J., 1997. "Inside the Black Box: What Explains Differences in the Efficiencies of Financial Institutions?" Journal of Banking and Finance 21 (7): 895-947. Berger, A. N., G. R. G. Clarke, R. Cull, L. Klapper, and G. F. Udell. 2005. “Corporate
Governance and Bank Performance: A Joint Analysis of the Static, Selection, and Dynamic Effects of Domestic, Foreign, and State Ownership.” Journal of Banking and Finance 29 (8-9): 2179-2221.
Bertrand, M., E. Duflo, and E. Mullainathan, S. 2004. "How Much Should We Trust Difference-in-Differences Estimates?" Quarterly Journal of Economics 119: 249-275. Boubakri, N., J. Cosset, K. Fischer, and O. Guedhami. 2005. “Privatization and Bank
Performance in Developing Countries.” Journal of Banking and Finance 29 (8-9): 2015-2041.
Boyd, J., G. De Nicoló, and A. M. Jalal. 2006. “Bank Risk Taking and Competition Revisited: New Theory and Evidence.” IMF Working Paper.
Brissimis, S. N., M. D. Delis, and N. I. Papanikolaou. 2008. “Exploring the Nexus between Banking Sector Reform and Performance.” Journal of Banking and Finance 32 (12): 2674-2683.
Chronopoulos, D. K., Liu, H., McMillan, F. J., and J. O. S. Wilson. 2015. “The Dynamics of US Bank Profitability.” The European Journal of Finance 21 (5): 426-443.
Clarke, G. R. G., R. Cull, and M. M. Shirley. 2005. “Bank Privatization in Developing Countries: A Summary of Lessons and Findings.” Journal of Banking and Finance 29 (8-9): 1905-1930.
Cornett, M. M., L. Guo, S. Khaksari, and H. Tehranian. 2010. “The Impact of State Ownership on Performance Differences in Privately-Owned versus State-Owned Banks: An International Comparison.” Journal of Financial Intermediation 19 (1): 74-94.
Crystal, J.S, B. Dages, and L.S. Goldberg. 2001. “Does Foreign Ownership Contribute to Sounder Banks? The Latin American Experience.” In: Litan, R.E., Masson, P. and M. Pomerleano, eds. 2001. Open Doors: Foreign Participation in Financial Systems in Developing Countries. Washington: Brookings Institution Press.
Demirguc-Kunt, A., and H. Huizinga. 1999. “Determinants of Commercial Bank Interest Margins and Profitability: Some International Evidence.” The World Bank Economic Review 13 (2): 379-408.
26
Dong, Y., C. Meng, M. Firth, and W. Hou. 2014. “Ownership Structure and Risk-Taking: Comparative Evidence from Private and State-Controlled Banks in China.” International Review of Financial Analysis 36: 120-130.
Firth, M., W. Li, and S. S. Wang. 2013. “The Growth, Determinants, and Profitability of Nontraditional Activities of Chinese Commercial Banks.” The European Journal of Finance DOI:10.1080/1351847X.2013.791632.
Fu, X., and S. Heffernan. 2009. “The Effects of Reform on China’s Bank Structure and Performance.” Journal of Banking and Finance 33 (1): 39-52.
Fungáčováa, Z., Pessarossib, P., and L. Weilla. 2013. “Is Bank Competition Detrimental to Efficiency? Evidence from China.” China Economic Review 27 (December): 121-134. García-Herrero, A., S. Gavilá, and D. Santabárbara. 2009. “What Explains the Low
Profitability of Chinese Banks?” Journal of Banking and Finance 33 (11): 2080-2092. Goddard, J., P. Molyneux, and J. Wilson. 2004. “Dynamics of Growth and Profitability in
Banking.” Journal of Money, Credit and Banking 36 (6): 1069-1090.
Heffernan, S. A., and X. Fu. 2010. “Determinants of Financial Performance in Chinese Banking Determinants of Financial Performance in Chinese Banking.” Applied Financial Economics 20 (20): 37-41.
Humphrey, D. B. and B. Lawrence. 1997. “Banks' Responses to Deregulation: Profits, Technology, and Efficiency.” Journal of Money, Credit and Banking 29 (1): 73-93.
Jia, C. 2009. “The Effect of Ownership on the Prudential Behaviour of Banks – The Case of China.” Journal of Banking and Finance 33 (1): 77-87.
Jiang, C., S. Yao, and Z. Zhang. 2009. “The Effects of Governance Changes on Bank Efficiency in China : A Stochastic Distance Function Approach.” China Economic Review 20 (4): 717-731.
Jiang, C., S. Yao, and G. Feng. 2013. “Bank Ownership, Privatization, and Performance: Evidence from A Transition Country.” Journal of Banking and Finance 37(9): 3364-3372. Kanas, A., D. Vasiliou, and N. Eriotis. 2012. “Revisiting Bank Profitability: A Semi-Parametric Approach.” Journal of International Financial Markets, Institutions and Money 22 (4): 990-1005.
Keeley, M. 1990. “Deposit Insurance, Risk, and Market Power in Banking.” American Economic Review 80 (5): 1183-1200.
Khan, F., M. A. Anuar, L. G. Choo, and H. Khan. 2011. “Determinants of Bank Profitability in Pakistan : A Case Study of Pakistani Banking Sector.” World Applied Sciences Journal 15 (10): 1484-1493.
Laeven, L., and R. Levine. 2009. “Bank Governance, Regulation and Risk Taking.” Journal of Financial Economics 93 (2): 259-275.
Lee, C., and M. Hsieh. 2014. “Bank Reforms, Foreign Ownership, and Financial Stability.” Journal of International Money and Finance 40: 204-224.
Lin, X., and Y. Zhang. 2009. “Bank Ownership Reform and Bank Performance in China.” Journal of Banking and Finance 33 (1): 20-29.
Liu, L. 2009. “Impact of the Global Financial Crisis on China: Empirical Evidence and Policy Implications.” China and World Economy 17 (6): 1-23.
Liu, H., P. Molyneux, and J.O.S. Wilson. 2013. “Competition and Stability in European Banking: A Regional Analysis.” Manchester School 81(2): 176-201.
Liu, H., and J.O.S. Wilson. 2010. “The Profitability of Banks in Japan.” Applied Financial Economics 20 (24): 1851-1866.
27
Luo, D., and S. Yao. 2010. “World Financial Crisis and the Rise of Chinese Commercial Banks: An Efficiency Analysis Using DEA.” Applied Financial Economics 20 (19): 1515-1530.
Luo, D., S. Yao, J. Chen, and J. Wang. 2011. “World Financial Crisis and Efficiency of Chinese Commercial Banks.” The World Economy 34 (5): 805-825.
Luo, D., Y. Dong, S. Armitage, and W. Hou. 2015. “The Impact of Foreign Bank Penetration on the Domestic Banking Sector: New Evidence from China.” The European Journal of Finance DOI: 10.1080/1351847X.2014.1003314.
Martin, M.F. 2012. China’s banking system: Issues for congress. Congressional Research Service.
Meyer, B. 1995. “Natural and Quasi-Experiments in Economics.” Journal of Business and Economic Statistics 13: 151-161.
Naaborg, I and R. Lensink. 2008. “Banking in Transition Economies: Does Foreign Ownership Enhance Profitability?” The European Journal of Finance 14 (7): 545-562. O'Hara, M., and W. Shaw. 1990. “Deposit Insurance and Wealth Effects: The Value of Being
‘Too Big to Fail’”. The Journal of Finance 45 (5): 1587-1600.
Okazaki, K. 2007. Banking System Reform in China: The Challenges of Moving toward a Market-Oriented Economy. RAND Corporation.
Soedarmono, W., F. Machrouh, and A. Tarazi. 2013. “Bank Competition, Crisis and Risk Taking: Evidence from Emerging Markets in Asia.” Journal of International Financial Markets, Institutions and Money 23: 196-221.
Stiroh, K. J. 2010. “Diversification in Banking.” In: A. N. Berger, P. Molyneux and J. O. S. Wilson eds., 2010. Oxford Handbook of Banking, Oxford: Oxford University Press.
Sturm, J. and B. Williams. 2004. “Foreign Bank Entry, Deregulation and Bank Efficiency: Lessons from the Australian Experience.” Journal of Banking and Finance 28 (7): 1775-1799.
Wang, K. W. Huang, J. Wu, and Y. Liu. 2014. "Efficiency Measures of the Chinese Commercial Banking System Using an Additive Two-stage DEA." Omega 44: 5-20. Weintraub, D.B. and M.I. Nakane. 2005. “Bank Privatization and Productivity: Evidence for
Brazil.” Journal of Banking and Finance 29 (8-9): 2259-2289.
Yao, S., C. Jiang, G. Feng, and D. Willenbockel. 2007. “WTO Challenges and Efficiency of Chinese Banks.” Applied Economics 39 (5): 629-643.
28
29
Table 1. Definition of Variables
Variable Definition
Bank performance variables Impaired loans to total assets
The ratio of impaired loans to total assets.
ln(z-score) Logarithm of Z-score. A measure of how many standard deviations a bank is away from exhausting its capital base. A higher value indicates higher overall bank stability. It is calculated at the three-year rolling time window.
Equity to assets The ratio of bank equity to total assets
Return on assets The ratio of bank net income after tax to total assets Standard deviation of
ROA
The standard deviation of return on assets, calculated at the three-year rolling time window.
Efficiency Efficiency score is calculated from the DEA model, with three inputs (customer deposits and short-term funding, total costs, and equity capital, to adequately account for the impact of risk) and three outputs (loans, other earning assets, and non-interest incomes).
Ownership indictors
Big 5 A dummy variable that equals 1 if the bank is one of the biggest five state-owned commercial banks and 0 otherwise.
Joint A dummy variable that equals 1 if the bank is a joint-stock commercial bank and 0 otherwise.
City A dummy variable that equals 1 if the bank is a city commercial bank and 0 otherwise.
Rural A dummy variable that equals 1 if the bank is a rural commercial bank and 0 otherwise.
Foreign A dummy variable that equals 1 if the bank is a foreign bank and 0 otherwise.
Foreign minority A dummy variable that equals 1 as from the year a bank has foreign minority ownership and 0 otherwise
List A dummy variable that equals 1 if the bank is publicly listed on a stock exchange and 0 otherwise.
Bank-specific characteristics
Size The natural logarithm of total assets.
Lerner The Lerner index measuring the mark-up of price over marginal costs. The higher the value, the more market power the bank has.
Diversification The ratio of non-interest income to total operating income. Cost to income ratio The ratio of operating expenses over operating income.
Liquidity The ratio of the sum of cash and for-sale securities to total assets.
Other variables
2007-09 financial crisis A dummy variable for the 2007-09 global financial crisis that equals 1 for the years 2007 to 2009 and 0 otherwise.
GDP growth Real GDP growth – the percentage change of real GDP.
30
Table 2
Summary Statistics for All Sample Banks and Univariate Tests of Differences between Pre-Reform and Post-Reform Periods
Variable Full Sample Before Regulation Change After Regulation Change
Difference in Means Mean Median SD Mean Median SD Mean Median SD (abs) p-value
Dependent Variables
Impaired loans/TA 1.81 0.75 2.86 5.20 3.97 4.30 1.09 0.56 1.74 4.11 0.00 Ln(Z-score)* 2.84 2.76 0.57 2.76 2.66 0.71 2.87 2.78 0.53 -0.11 0.01 standard deviation
ROA 0.44 0.44 0.08 0.32 0.32 0.07 0.47 0.46 0.04 -0.15 0.00 ROA 0.88 0.90 0.51 0.49 0.41 0.35 1.02 1.07 0.49 -0.53 0.00 Equity/TA 8.19 6.02 7.77 6.91 4.30 9.11 8.64 6.40 7.20 -1.73 0.00 Efficiency 0.82 0.82 0.11 0.83 0.83 0.10 0.82 0.82 0.11 0.00 0.87
Independent Variables
Lerner 37.79 40.33 11.93 30.44 31.44 11.46 40.33 42.34 11.01 -9.90 0.00 Size 10.83 10.64 1.97 10.55 10.15 2.18 10.93 10.80 1.88 -0.38 0.00 Cost-to-income ratio 44.61 40.26 16.16 54.04 50.10 15.97 41.34 37.98 14.90 12.70 0.00 Diversification 15.55 11.34 13.81 17.26 11.21 15.52 14.96 11.36 13.13 2.30 0.01 Liquidity 12.36 10.71 9.86 16.72 17.25 9.69 10.85 8.13 9.47 5.87 0.00 GDP growth 10.29 9.60 1.87 9.87 10.00 1.08 10.43 9.60 2.05 -0.56 0.00 Inflation 4.65 3.93 2.98 3.44 2.61 2.05 5.07 6.68 3.13 -1.63 0.00
Dummy Variables
Big 5 0.04 0.00 0.20 0.08 0.00 0.27 0.03 0.00 0.17 0.05 0.00 Joint 0.12 0.00 0.33 0.19 0.00 0.39 0.10 0.00 0.30 0.09 0.00 Foreign 0.12 0.00 0.33 0.06 0.00 0.23 0.15 0.00 0.36 -0.09 0.00 City 0.71 1.00 0.45 0.68 1.00 0.47 0.72 1.00 0.45 -0.04 0.20 Listed 0.17 0.00 0.38 0.29 0.00 0.46 0.13 0.00 0.34 0.16 0.00 Foreign minority 0.27 0.00 0.45 0.13 0.00 0.33 0.32 0.00 0.47 -0.20 0.00 2007-09 financial crisis 0.31 0.00 0.46 0.00 0.00 0.00 0.42 0.00 0.49 -0.42 0.00
Observations 1206 310 896
Note: This table presents descriptive statistics for: (i) all sample banks (184 banks); (ii) the pre-reform period (2000-2005) (94 banks); and (iii) the post-reform period (2006-2012) (172 banks). Mean, Median and SD stand for the cross-sectional mean, median and standard deviation values of the individual bank time-series averages, respectively. The last two columns report the comparison analysis of dependent and control variables between pre- and post-reform periods. Difference in means is calculated as the difference between two periods’ means in absolute (abs) values, with the p-values of the t-test on the equality of means reported in the last column.
31
Table 3
Correlation Matrix
(1) (2) (3) (4) (5) (6) (7) (8) (9) (10) (11) (132 (13) (14) (15) (16) (17)
(1)ROA
(2)ln(Z-score)
0.198*** (3)Efficiency
-0.025 0.026 (4)Post-2005
0.452*** 0.290*** -0.005 (5)Lerner
0.645*** -0.061** 0.165*** 0.363*** (6)Size
0.013
-0.254*** 0.388*** 0.085*** 0.332*** (7)Cost-to-income
ratio
-0.646*** 0.051* -0.092*** -0.344*** -0.846*** -0.221*** (8)Diversification
-0.076*** 0.041 0.104*** -0.073** 0.201***
-0.108*** 0.188***
(9)Liquidity
-0.154*** -0.195*** -0.295***
-0.260*** -0.043 0.042 0.083*** 0.124*** (10)GDPGrowth
-0.067**
-0.137*** 0.022 0.132*** 0.084*** -0.176***
-0.123*** -0.065** -0.010 (11)Inflation
0.209*** 0.046 -0.044 0.240*** 0.169*** -0.022
-0.190*** -0.040 -0.068** 0.404*** (12)Big 5
-0.045
-0.134*** 0.290***
-0.099*** 0.135*** 0.498*** -0.016 0.012 0.033 -0.029 -0.041
(13)Joint
-0.142***
-0.159*** 0.228***
-0.114*** 0.021 0.441*** -0.010 -0.105***
-0.103*** -0.029 -0.043 -0.080***
(14)Foreign
-0.113*** 0.379*** 0.063** 0.124*** -0.320***
-0.250*** 0.317*** 0.184**
-0.198*** -0.074** 0.011 -0.080*** -0.142*** (15)City 0.205*** -0.097***
-0.341*** 0.037 0.156*** -0.361***
-0.216*** -0.062** 0.203*** 0.087*** 0.041 -0.331*** -0.586*** -0.588***
(16)List
-0.075***
-0.187*** 0.373***
-0.187*** 0.150*** 0.643*** -0.076***
-0.106*** 0.004 -0.060*
-0.080*** 0.468*** 0.573*** -0.171***
-0.500*** (17)Foreign minority
-0.046 0.231*** 0.253*** 0.194***
-0.103*** 0.172*** 0.089*** 0.042 -0.207 -0.031 0.037 0.081*** 0.200*** 0.615***
-0.628*** 0.251*** (18)2007-09 financial
crisis 0.159*** 0.076*** -0.042 0.397*** 0.098*** -0.072
-0.101*** -0.050*
32
Table 4 Bank Performance Analysis Prior to and After China’s Banking Reforms in 2005, Comparing Big 5 and non-Big 5 banks
(1) (2) (3) (4) (5) (6)
Impaired
loan/TA ln Z-score
Std. Dev.
ROA ROA Equity/TA Efficiency
Post-2005 -3.268*** 0.218*** 0.114*** 0.267*** 3.811*** -0.034***
(-7.785) (3.932) (41.482) (7.447) (5.129) (-3.207)
Big 5 3.101*** 0.607*** -0.002 0.101* 8.548*** 0.028
(3.985) (4.522) (-0.738) (1.774) (5.315) (1.251)
Size 0.092 -0.241*** 0.002*** -0.078*** -3.323*** 0.016***
(0.730) (-9.718) (3.261) (-7.671) (-6.482) (3.276)
List 0.023 0.255*** -0.016*** 0.094* 4.538*** 0.024
(0.045) (2.604) (-5.751) (1.861) (2.849) (1.357)
Foreign minority -1.244*** 0.305*** 0.008*** -0.024 3.440*** 0.036***
(-4.270) (6.010) (4.132) (-0.698) (5.554) (3.989)
2007-09 financial crisis
0.095 -0.160*** 0.059*** 0.062*** -0.746** -0.014*** (0.742) (-6.084) (101.336) (2.698) (-2.059) (-2.655)
Lernert-1 -0.060*** 0.012*** -0.000** 0.017*** 0.096** 0.002***
(-3.751) (4.317) (-2.156) (7.836) (2.061) (3.486)
Cost-to-income ratiot-1 -0.001 0.008*** -0.001*** -0.010*** 0.116*** 0.001 (-0.110) (3.565) (-5.222) (-6.249) (3.296) (1.425)
Diversificationt-1 0.002 0.000 -0.000 0.002* 0.010 0.002***
(0.193) (0.281) (-0.555) (1.909) (0.564) (5.069)
Liquidityt-1 0.002 -0.006*** -0.000*** -0.002 -0.132*** -0.004***
(0.230) (-2.715) (-4.750) (-1.347) (-3.981) (-8.956)
GDP growtht-1 0.199*** -0.114*** 0.005*** -0.079*** -0.950*** 0.009*** (3.896) (-13.846) (16.909) (-10.875) (-9.255) (5.252)
Inflationt-1 -0.084*** 0.009*** 0.003*** 0.025*** 0.153*** -0.004***
(-5.110) (2.866) (24.109) (7.700) (3.447) (-5.407)
Constant 6.895*** 3.962*** 0.371*** 1.057*** 28.968*** 0.608***
(3.553) (12.116) (30.132) (5.480) (4.783) (9.445)
Obs. 912 1135 1135 1206 1206 1195
adj. R-sq 0.402 0.397 0.794 0.537 0.475 0.340