Electrolytic Capacitor Age Estimation Using PRBS-based Techniques
8
0
0
Full text
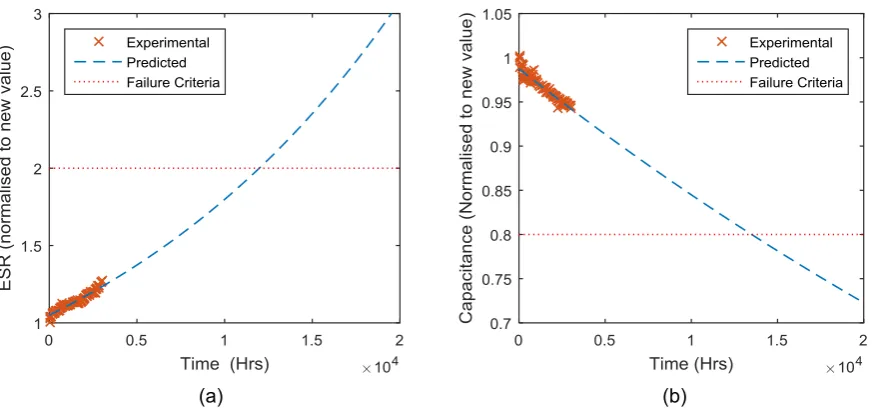
(2) PCIM Europe 2016, 10 – 12 May 2016, Nuremberg, Germany. (a) (b) Fig. 1 – Experimental ageing values for capacitor measured at 115 °C and 1 kHz. (a) ESR values; (b) capacitance values. The rate of ageing for a capacitor is proportional to the operating temperature [2] and the heat generation within an electrolytic capacitor is related to the power losses within it. The power loss can be calculated using (1) [4], where P is the power dissipated within the capacitor; IR is the RMS ripple current and ESR is the equivalent series resistance of the capacitor at the ripple frequency. (1) 𝑃 = 𝐼𝑅 2 𝐸𝑆𝑅 Consequently, as the capacitor ages the power losses within it increase due to the increase in ESR. This leads to an increased operating temperature within the capacitor, further expediting the ageing. A useful prognostic system would detect the rise in ESR and therefore reduce the magnitude of the ripple current counteracting the increase in P by reducing IR. The ESR and capacitance are temperature-dependent. The temperature dependency of these values, measured at 1 kHz, can be seen in Fig. 2. It is important that any system designed to predict the age of a capacitor possesses some method of accounting for the temperature dependency. From Fig. 2(a) the optimum ESR is approximately 80 °C.. (a) (b) Fig. 2 – Temperature dependency of capacitor properties (measured at 1 kHz). (a) ESR with respect to temperature; (b) capacitance with respect to temperature. ISBN 978-3-8007-4186-1. 1096. © VDE VERLAG GMBH · Berlin · Offenbach.
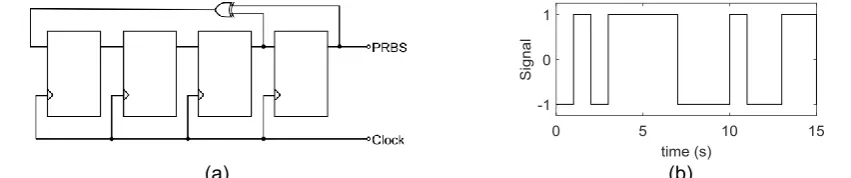
(3) PCIM Europe 2016, 10 – 12 May 2016, Nuremberg, Germany. 2. Pseudorandom binary sequences (PRBS) 2.1.. PRBS-based parameter estimation. PRBS signals can be used to excite a system with band-limited white noise. By measuring the system response, its impedance spectrum can be calculated. Similar approaches have been used for a variety of different applications including the thermal characterisation of systems [5]; parameter estimation in electrical generators [6] and the modelling of batteries [7]. Using this technique it is possible to determine the impedance of a system over a preselected range of frequencies using a single test sequence. An advantage of using PRBS techniques is that they are amenable to ‘on-line’ measurements, aiding the implementation of this prognostics into a functional drive system.. 2.2.. PRBS generation. A maximum length sequence PRBS can be generated using linear feedback shift registers. The sequence length (N) and clock rate (fc) of a PRBS sequence are determined by the desired bandwidth and frequency limits of the measurements. A longer sequence length will increase the usable bandwidth of the signal, but will also take an increased length of time to complete. The clock rate of the system determines the bandwidth covered. By way of example, a 4-bit PRBS generator is illustrated in Fig. 3(a), with its corresponding PRBS signal (generated with a 1 Hz clock frequency) shown in Fig. 3(b). It is possible to determine the bandwidth of a PRBS system by using (2) and (3) [5]; where n is the bit length of the shift register and BW is the bandwidth (with f1 being the minimum frequency and f2 being the maximum). In the example shown here n = 4, therefore N = 15 and the bandwidth of the system is 0.368 Hz (f1 = 0.067 Hz, f2 = 0.435 Hz).. (a) (b) Fig. 3 – (a) Example 4-bit PRBS generator constructed using shift registers; (b) Example 4 bit PRBS sequence. (2). 𝑁 = 2𝑛 − 1. 𝐵𝑊 = 𝑓2 − 𝑓1 ,. 2.3.. 𝑓1 =. 𝑓𝑐 𝑁. ,. 𝑓2 =. 𝑓𝑐. (3). 2.3. Use of PRBS to detect capacitor deterioration. To obtain the impedance spectrum of a capacitor, a bipolar current waveform in the form of a PRBS will be applied and the resulting voltage waveform on the capacitor terminals measured. The impedance spectrum is generated by taking the quotient of the Fourier transforms of the voltage and current. The whole process is summarised in Fig. 4. ISBN 978-3-8007-4186-1. 1097. © VDE VERLAG GMBH · Berlin · Offenbach.
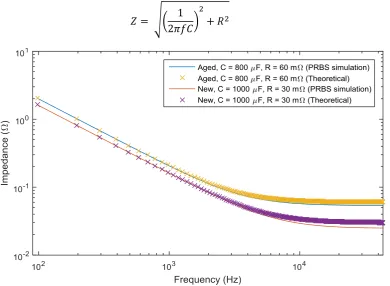
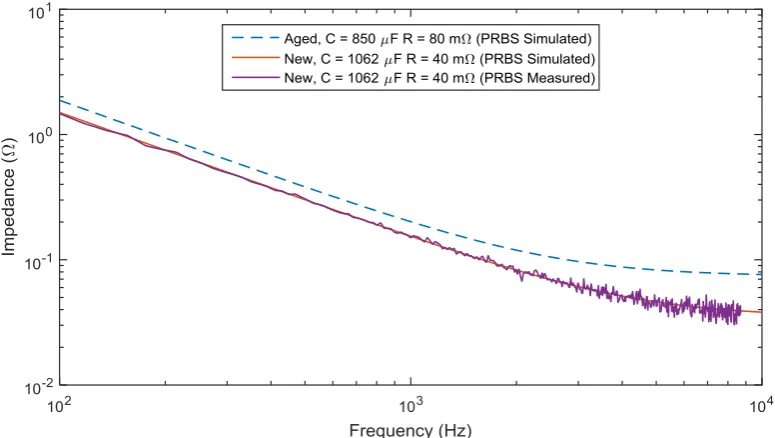
(4) PCIM Europe 2016, 10 – 12 May 2016, Nuremberg, Germany. Fig. 4 – Schematic of data processing steps to obtain component impedance from PRBS data. A Simulink model of the PRBS capacitor tester using the configuration shown in Fig. 5 was used to validate the measurements obtained using PRBS. Here the voltage across the capacitor is denoted as vc and the current is calculated from the voltage across a current sense resistor Rs.. Fig. 5 - Schematic of test procedure. Simulation results are shown in Fig. 6 and were obtained from the Simulink model which employed a 10-bit PRBS sequence and a clock frequency of 100 kHz. For the purpose of comparison, theoretical impedances, obtained using (4), are also included in the figure. The results obtained by using PRBS are in close agreement with the theoretical values. Here the values selected for the ‘New’ capacitor are those measured for the capacitor which will be used later in the paper to test the practical system and the ‘aged’ values are obtained by multiplying the ‘New’ capacitance value by 0.8 and the ESR by 2, mimicking the failure criteria discussed previously. This is done to illustrate the fact that the changes in these parameters during ageing are measurable using this technique. (4) 1 2 2 𝑍 = √( ) +𝑅 2𝜋𝑓𝐶. Fig. 6 - Simulated frequency spectrum for capacitor excited by 10-bit PRBS signal for aged and new capacitors compared to theoretical impedances. ISBN 978-3-8007-4186-1. 1098. © VDE VERLAG GMBH · Berlin · Offenbach.
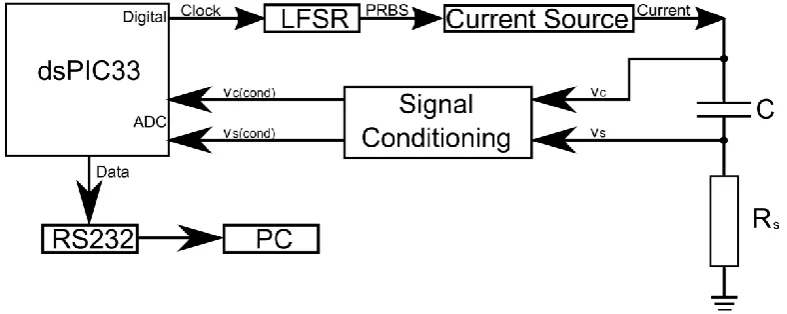
(5) PCIM Europe 2016, 10 – 12 May 2016, Nuremberg, Germany. Clearly the new and aged capacitors have a significant difference in impedance and so the impedance could be used to identify the failure of a capacitor. The complex impedance is obtained using this technique and therefore it is possible extract the resistive and reactive values and determine the ESR and capacitance values. This this technique will be demonstrated later in this paper, when the experimental results are considered.. 3. Practical implementation of system In the development of a practical system in order for a PRBS system to be effective there are three factors which must be considered. These are: the PRBS clock frequency; the PRBS bit length; the magnitude of the driving current. These parameters are interconnected and depend on the frequency range of interest. As f2 is determined solely by the clock frequency, the clock frequency should be selected so as to satisfy the upper bandwidth requirements of the system. Once this upper frequency has been set, the number of bits within the PRBS sequence can be selected to determine lower bandwidth frequency of the system. Excitation current level within a practical system is determined by a trade-off between two parameters: The maximum voltage the current source can provide The minimum voltage the analogue-to-digital converter (ADC) can resolve. It should also be noted that the capacitor voltage will vary proportionally to the magnitude of the current used, meaning that the signal to noise ratio of the measurements will be smaller for a smaller excitation current.. Fig. 7 – Block diagram of system implementation. A block diagram of the PRBS capacitor characterisation system is illustrated in Fig. 7. This system is based around a dsPIC33 microcontroller. This chip incorporates 4 sample-and-hold buffers and a 10-bit ADC. The availability of multiple sample-and-hold buffers is particularly useful for this application as it allows the two voltage signals to be sampled simultaneously thereby removing any ambiguities associate with time delays and phasing of signals. A 10-bit PRBS is generated using a discrete linear-feedback shift register (LFSR) driven by a clock generated by the dsPIC (fc = 20 kHz). The current source provides a PRBS signal amplitude of +/- 1A. The dsPIC ADC is designed to operate with inputs within its power supply rails (0 3.3 V). The current source is operated from a +/- 10 V supply however. To ensure that that the ADC is not damaged by excessive voltage a signal conditioning circuit scales the voltage. ISBN 978-3-8007-4186-1. 1099. © VDE VERLAG GMBH · Berlin · Offenbach.
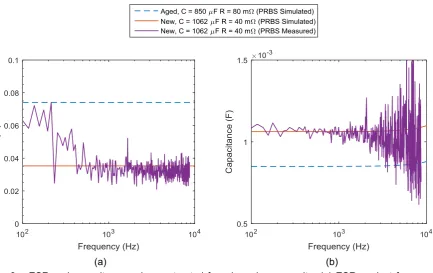
(6) PCIM Europe 2016, 10 – 12 May 2016, Nuremberg, Germany. appearing across the device under test, in response to the PRBS current signal, to 0 – 3.3 V. The ADC data is sent via RS232 to a PC where the data is processed to obtain the capacitor impedance.. 4. Experimental results To evaluate the performance of the PRBS system described previously a 1000 μF capacitor manufactured by Forever was selected as a test device. The capacitance of the test capacitor was measured using an LCR meter at 1 kHz. C = 1062 μF and ESR = 40 mΩ. The impedance plot obtained from PRBS testing this capacitor is shown in Fig. 8. The impedance shows a good correlation to the simulation results. Fig. 9 shows plots of the ESR and capacitance obtained by considering the real and imaginary components of the impedance using (5) and (6).. Fig. 8 – Experimentally obtained impedance of a 1062 μF capacitor with an ESR of 40 mΩ compared to new simulated results and aged simulated results measured at 25 °C. 𝐸𝑆𝑅 = ℜ(𝑍) 𝐶= −. 1 2𝜋𝑓 ℑ(𝑍). (5) (6). The PRBS results show reasonable agreement with the ‘New’ capacitor simulation results with the following exceptions. Firstly, the experimentally obtained ESR values shown here are higher than the predicted values for the capacitor at frequencies below 500 Hz. In simulation the ESR is assumed constant with no frequency dependence; this is not the case, especially at lower frequencies. Secondly, the capacitance data is noisy at frequencies above 2 kHz, meaning that distinguishing between a new and aged capacitor is difficult. The increase in noise is due to reactance becoming smaller as frequency increases, resulting in a falling signal to noise ratio with increasing frequency. Considering both the ESR and capacitance together, the most suitable frequency at which both parameters can be determined is approximately 1 kHz. If the system were to be used to characterise capacitors of different values the optimum frequency will vary. This highlights the importance of tuning the PRBS system parameters to ensure that it is possible to suitably measure the capacitor under test over its entire ageing range.. ISBN 978-3-8007-4186-1. 1100. © VDE VERLAG GMBH · Berlin · Offenbach.
(7) PCIM Europe 2016, 10 – 12 May 2016, Nuremberg, Germany. (a) (b) Fig. 9 – ESR and capacitance values extracted from impedance results. (a) ESR against frequency; (b) Capacitance against frequency. 5. Conclusions This paper proposed a PRBS-based method to measure the equivalent series resistance and bulk capacitance of electrolytic capacitors for state-of-health prediction. The PRBS technique generates impedance data over a range of frequencies from which the ESR and bulk capacitance are generated. The technique has been demonstrated in simulation and for practical devices, with both exhibiting good correlation with direct measurement of the parameters. The influence of capacitor temperature on the ESR and capacitance was also highlighted, stressing the importance of any system which determines capacitor age to account for measurement temperature. By comparing up-to-date ESR and bulk capacitance at a given temperature to nominal values, it is possible to determine the age of the capacitor. Therefore its remaining useful life can be estimated.. References [1] Department of Defence, Reliability prediction of electronic equipment, Military Handbook (MIL-HDBK-217F), Washington DC: US Department of Defence, 1995. [2] K. Harada, A. Katsuki and M. Fujiwara, “Use of ESR for deterioration diagnosis of electrolytic capacitor,” Power Electronics, IEEE Transactions on, vol. 8, no. 4, pp. 355361, 1993. [3] Emerson Network Power, “Capacitors age and capacitors have an end of life,” Emerson Network Power, Columbus, 2008. [4] Nichicon Corporation, “Technical Notes on Aluminum Electrolytic Capacitors /Cat. 8101E,” Nichicon Corporation. [5] J. Davidson, D. Stone, M. Foster and D. Gladwin, “Improved Bandwidth and Noise Resilience in Thermal Impedance Spectroscopy by Mixing PRBS Signals,” Power. ISBN 978-3-8007-4186-1. 1101. © VDE VERLAG GMBH · Berlin · Offenbach.
(8) PCIM Europe 2016, 10 – 12 May 2016, Nuremberg, Germany. Electronics, IEEE Transactions on, vol. 29, no. 9, pp. 4817 - 4828, 2014. [6] A. Saavedra-Montes and J. Ramirez-Scarpetta, “Identification of excitation systems with the generator online,” Electric Power Systems Research, vol. 87, pp. 1 - 9, 2012. [7] A. Fairweather, M. Foster and D. Stone, “Modelling of VRLA batteries over operational,” Journal of Power Sources, vol. 207, pp. 56-59, 2012.. ISBN 978-3-8007-4186-1. 1102. © VDE VERLAG GMBH · Berlin · Offenbach.
(9)
Figure
+3
Related documents
Your chip comes with a hardware peripheral and library that does all the data managing at high speed, collects samples, applies a filter and gives you an analog value (Ideal!)..
Genders at Work: Exploring the role of workplace equality in preventing men s violence against women
Workplace efforts to reduce gender inequalities and prevent men’s violence against women may address particular dimensions of these problems, from sexist and disrespectful
Moreover, as higher demand shocks result in larger market shares, the market share of OUS exporters should be higher than that of others, especially in nonwovens, where OEU firms
Whether you are just beginning to get more actively involved in Muslim community work or have been contributing for years and are keen to develop capacity, you will find our
Q> An Innovation in Film Cooling of Gas Turbine Blades Applying an Upstream Jet.
Delaying PEG administration by 2 hours produced a sta- tistically significant increase in the percent time spent exploring compared to injured yet untreated animals on day 1 (for
This study, which is based on an analysis of the Malaysian educators' responses, indicated that teaching ethics is important in the accounting curriculum and mostly preferred
Port let API Aggregation Modules (HTML, WML, VoiceXML, ...) Remote Portlet Web Services SOAP Router A uth ent icat ion Authorization WebSphere Portal Server Data Store
![Crystal structure of bis{2,4 di tert butyl 6 [(isopropylimino)methyl]phenolato κ2N,O}zinc dichloromethane monosolvate](data:image/gif;base64,R0lGODlhAQABAIAAAP///wAAACH5BAEAAAAALAAAAAABAAEAAAICRAEAOw==)