Search for top squarks in final states with one isolated lepton,
jets, and missing transverse momentum in
p
ffiffi
s
= 13
TeV
pp
collisions
with the ATLAS detector
M. Aaboudet al.* (ATLAS Collaboration)
(Received 14 June 2016; published 19 September 2016)
The results of a search for the top squark, the supersymmetric partner of the top quark, in final states with one isolated electron or muon, jets, and missing transverse momentum are reported. The search uses the 2015 LHC pp collision data at a center-of-mass energy of pffiffiffis¼13TeV recorded by the ATLAS detector and corresponding to an integrated luminosity of 3.2fb−1. The analysis targets two types of signal models: gluino-mediated pair production of top squarks with a nearly mass-degenerate top squark and neutralino and direct pair production of top squarks, decaying to the top quark and the lightest neutralino. The experimental signature in both signal scenarios is similar to that of a top quark pair produced in association with large missing transverse momentum. No significant excess over the Standard Model background prediction is observed, and exclusion limits on gluino and top squark masses are set at 95% confidence level. The results extend the LHC run-1 exclusion limit on the gluino mass up to 1460 GeV in the gluino-mediated scenario in the high gluino and low top squark mass region and add an excluded top squark mass region from 745 to 780 GeV for the direct top squark model with a massless lightest neutralino. The results are also reinterpreted to set exclusion limits in a model of vectorlike top quarks.
DOI:10.1103/PhysRevD.94.052009
I. INTRODUCTION
Supersymmetry (SUSY) [1–6] is a natural solution
[7,8]to the hierarchy problem[9–12]. The top squark (~t), which is the superpartner of the top quark, is expected to be relatively light due to its large contribution to the
Higgs boson mass radiative corrections [13,14]. For
reasons such as gauge unification [15] and the two-loop radiative corrections to the Higgs boson mass[16,17], one may also expect a TeV mass scale for the gluino (g~), the superpartner of the gluon. A common theoretical strategy for avoiding strong constraints from the nonobservation
of proton decay [18] is to introduce a multiplicative
quantum number calledRparity. IfR parity is conserved
[19], SUSY particles are produced in pairs and the
lightest supersymmetric particle (LSP) is stable. This analysis follows the typical assumption that the lightest neutralino1 (χ~01) is the LSP. Since the χ~01 interacts only weakly, it can serve as a candidate for dark matter [20,21].
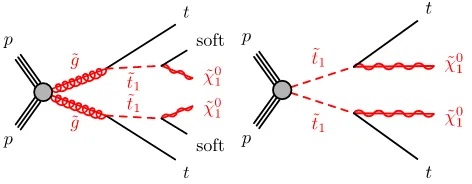
This paper presents a search targeting the lighter top squark2 (~t1) in two scenarios: gluino-mediated pair production of the ~t1 with a small ~t1-LSP mass splitting and direct pair production of the~t1, both illustrated by the diagrams in Fig. 1. The former scenario refers to pair production of gluinos, each decaying to the top quark and the ~t1. In this scenario, the mass difference between the gluino and the ~t1 is assumed to be well above the top quark mass, while the mass difference between the~t1and the LSP is assumed to be significantly smaller than theW
boson mass. As a result, the visible ~t1 decay products have low momentum, typically below the reconstruction and identification thresholds. This scenario is motivated by the dark matter relic density, which is generally too large in the Minimal Supersymmetric Standard Model
[22,23]but can be regulated by coannihilation of the top
squark and the neutralino[24]. In the second scenario, the two directly produced ~t1 are each assumed to decay to the top quark and the LSP. This model is interesting as it is independent of the gluino mass, which is more weakly constrained by naturalness arguments than the top squark mass.
Experimentally, the final states of the two scenarios are similar[25], and the detector signature consists of the decay
*Full author list given at the end of the article.
Published by the American Physical Society under the terms of the Creative Commons Attribution 3.0 License. Further distri-bution of this work must maintain attridistri-bution to the author(s) and the published article’s title, journal citation, and DOI.
1The charginos χ~
1;2 and neutralinos χ~01;2;3;4 are the mass
eigenstates formed from the linear superposition of the charged and neutral SUSY partners of the Higgs and electroweak gauge bosons (higgsinos, winos and binos).
2The superpartners of the left- and right-handed top quarks,~t L
and~tR, mix to form the two mass eigenstates~t1and~t2, where~t1is
products of a pair of top quarks3 and large missing transverse momentum (p~missT , where the magnitude is referred to as Emiss
T ) from the two LSPs: t¯tþEmissT . The
main difference between the two scenarios is that the production cross section for gluino pairs is about a factor 50 higher than for ~t1 pairs of the same mass due to the additional spin and color states. The results are also reinterpreted in a model of strong-interaction direct pair production of vectorlike top quarksT(referred to as VLQ) [26–28], for which the decay mode T→tZwith Z→νν¯
has a signature similar to that of direct top squark pair production with~t1→tχ~01.
The analysis presented here—which is based on previous ATLAS searches for the same signature [29,30]—targets the one-lepton final state where the W boson from one of the top quarks decays to an electron or muon (either directly or via aτlepton) and theWboson from the other top quark decays hadronically. The dominant Standard Model (SM) background processes are the production of t¯t; the asso-ciated production of a top quark and aWboson (single top
Wt); t¯tþZð→νν¯Þ; and the associated production of W
bosons and jets (Wþjets). The search uses the ATLAS data collected in proton-proton (pp) collisions in 2015 corresponding to an integrated luminosity of3.2fb−1 at a center-of-mass energy ofpffiffiffis¼13TeV. The ATLAS run-1 searches for gluino-mediated top squark production and direct top squark pair production are summarized in
Refs. [31,32], respectively. Run-1 searches for VLQ
production can be found in Refs. [33–35]. The CMS
Collaboration has performed similar searches for gluino-mediated top squark production[36], direct top squark pair production[37–42], and VLQ production[43].
This document is organized as follows. The ATLAS detector, data set, and trigger are described in Sec.II, and
the corresponding set of simulations are detailed in Sec.III. Section IV presents the reconstruction and selection of physics objects and the construction of discriminating variables. These variables are used in Sec.V to construct the signal event selections. The background estimation procedure (Sec.VI) and systematic uncertainties (Sec.VII) are described before the results are presented in Sec.VIII. SectionIX contains concluding remarks.
II. ATLAS DETECTOR AND DATA SET
The ATLAS detector [44] is a multipurpose particle
physics detector with nearly 4π coverage in solid angle around the collision point.4It consists of an inner tracking detector (ID), surrounded by a superconducting solenoid providing a 2 T axial magnetic field, a system of calorim-eters, and a muon spectrometer (MS) incorporating three large superconducting toroid magnets. The ID provides charged-particle tracking in the rangejηj<2.5using three technologies: silicon pixel and silicon microstrip tracking detectors and a transition radiation tracker. During the LHC shutdown between run 1 and run 2, a new innermost layer of silicon pixels was added, which improves the track impact parameter resolution and vertex position resolution [45]. High-granularity electromagnetic and hadronic calo-rimeters cover the region jηj<4.9. The central hadronic calorimeter is a sampling calorimeter with scintillator tiles as the active medium and steel absorbers. All the electro-magnetic calorimeters, as well as the end cap and forward hadronic calorimeters, are sampling calorimeters with liquid argon as the active medium and lead, copper, or tungsten absorber. The MS consists of three layers of high-precision tracking chambers with coverage up tojηj ¼2.7 and dedicated chambers for triggering in the region
jηj<2.4. Events are selected by a two-level trigger system: the first level is a hardware-based system and the second is a software-based system.
The 2015 LHC collision data used in this analysis have a
mean number of additional pp interactions per bunch
crossing (pileup) of approximately 14 and a bunch spacing of 25 ns. Following requirements based on beam and detector conditions and data quality, the data set corre-sponds to an integrated luminosity of 3.2fb−1 with an associated uncertainty of 5%. The uncertainty is derived following the same methodology as that detailed in Ref.[46]. Events used for this search were recorded using a trigger logic that accepts events withEmiss
[image:2.612.58.294.47.139.2]T , calibrated to
FIG. 1. Diagrams illustrating the two considered signal scenar-ios. Left: Gluino-mediated top squark pair production, where each top squark decays to a low momentum (“soft”) charm quark and the lightest neutralino. Right: Top squark pair production, where each top squark decays to the top quark and the lightest neutralino (χ~01). For simplicity, no distinction is made between particles and antiparticles.
3Due to the Majorana nature of the gluino, in the
gluino-mediated model, each of the two “visible” top quarks can independently be a top or an antitop quark. Hereafter, the term
t¯tcan be taken to refer to any combination oftand¯t.
4
ATLAS uses a right-handed coordinate system with its origin at the nominal interaction point (IP) in the center of the detector and the z axis along the beam pipe. The x axis points from the IP to the center of the LHC ring, and the y axis points upwards. Cylindrical coordinatesðr;ϕÞare used in the transverse plane, ϕ being the azimuthal angle around the z axis. The pseudorapidity is defined in terms of the polar angle θ as η¼−ln tanðθ=2Þ. Angular distance is measured in units of
the electromagnetic scale, above 70 GeV. The trigger is more than 95% efficient for events passing an offline-computed Emiss
T >200GeV requirement and is >99%
efficient for events passing all signal selections. An addi-tional data sample used to estimate one of the background processes was recorded with a trigger requiring a photon with transverse momentum pT>120GeV, which is > 99% efficient for the offline photon selection described in Sec. IV.
III. MONTE CARLO SIMULATIONS
Samples of Monte Carlo (MC) simulated events are used for the description of the background and to model the SUSY signals. Several matrix element (ME) generators are combined with parton shower (PS) and hadronization generators. Signal SUSY samples are generated at leading
order (LO) with MG5_AMC v2.2[47] while VLQ signal
samples are generated at LO with PROTOSv2.2[48,49]. All signal samples are interfaced with PYTHIA 8.186 [50].
Background samples use one of three setups:
(i) MG5_AMC v2.2 interfaced with PYTHIA 8 or
HERWIG++ using the CKKW-L [51] or the
MC@NLO method for matching a LO or next-to-leading-order (NLO) ME to the PS, respectively. (ii) POWHEG-BOX[52–56] interfaced to PYTHIA6 [57]
or HERWIG++ using the POWHEGmethod[58,59]for
matching the NLO ME to the PS.
(iii) SHERPA 2.1.1 [60] using Comix [61] and
Open-Loops [62] ME generators interfaced with the
SHERPAparton shower [63].
The CT10[64]NLO parton distribution function (PDF) set is used for ME calculations with SHERPAand POWHEG
-BOXand the NNPDF2.3[65]PDF set is used for samples
generated with MG5_AMC, except for the NLO samples,
which use either CT10 or NNPDF3.0 [66]. The CTEQ6L1
[67] LO PDF set along with the P2012 [68] set of
underlying-event tuned parameters (UE tune) is used for PYTHIA6; the NNPDF2.3 LO PDF set and the A14 UE tune [69]is used for PYTHIA8; and the CT10 PDF set with the
default UE tune provided by the authors of SHERPAis used
for the SHERPA samples. The samples produced with
MG5_AMC, POWHEG-BOX, and PROTOS all use EVTGEN
v1.2.0 [70] for the modeling of b-hadron decays. The
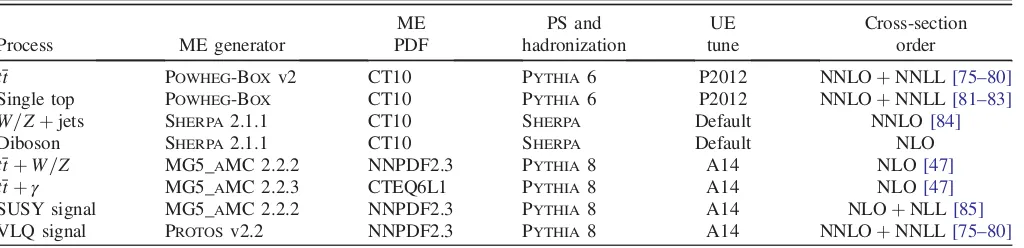
simulation setup is summarized in TableIand more details can be found in Refs. [71–74] for t¯t and single top,
W=Zþjets, dibosons, and t¯tþW=Z, respectively.
Additional samples aside from those shown in Table I
are used to assess theoretical modeling uncertainties and are discussed in Sec.VII.
In the gluino-mediated production the top squark is assumed to decay via~t1→cþχ~01with a 100% branching ratio and with a default mass splittingm~t1−mχ~0
1 ¼5GeV.
Alternative samples with larger mass splitting and/or replacing the two-body top squark decay by a four-body top squark decay ~t1→bff0χ~01, where ff0 is a fermion-antifermion pair, are produced for additional studies. The gluinos and top squarks are assumed to decay promptly. In the direct top squark pair production samples, the ~t1 is chosen to be mostly the partner of the right-handed top quark5 and the χ~01 to be a pure bino. This choice is consistent with a large branching ratio for the given ~t1
decay. Different hypotheses for the left-right mixing in the top squark sector and the nature of the neutralino lead to different acceptance values. The acceptance is affected because the polarization of the top quark changes as a function of the field content of the supersymmetric par-ticles, which impacts the boost of the lepton in the top quark decay. Signal grids are generated for both the gluino and direct top squark pair production models. The spacing between grid points in the gluino-top squark and top squark-neutralino mass planes vary between 25 and 100 GeV.
All the MC samples are normalized to the highest-order (in αS) cross section available, as indicated in the last
[image:3.612.54.566.64.188.2]column of TableI. The cross sections for the pair and single TABLE I. Overview of the nominal simulated samples.
ME PS and UE Cross-section
Process ME generator PDF hadronization tune order
t¯t POWHEG-BOXv2 CT10 PYTHIA6 P2012 NNLOþNNLL[75–80]
Single top POWHEG-BOX CT10 PYTHIA6 P2012 NNLOþNNLL[81–83]
W=Zþjets SHERPA 2.1.1 CT10 SHERPA Default NNLO[84]
Diboson SHERPA 2.1.1 CT10 SHERPA Default NLO
t¯tþW=Z MG5_AMC 2.2.2 NNPDF2.3 PYTHIA8 A14 NLO[47]
t¯tþγ MG5_AMC 2.2.3 CTEQ6L1 PYTHIA8 A14 NLO[47]
SUSY signal MG5_AMC 2.2.2 NNPDF2.3 PYTHIA8 A14 NLOþNLL [85]
VLQ signal PROTOSv2.2 NNPDF2.3 PYTHIA8 A14 NNLOþNNLL[75–80]
5The~t
Rcomponent is given by the off-diagonal entry of the top
squark mixing matrix. The~t1decays in the direct top squark pair production samples are performed by PYTHIA and produce
production of top quarks as well as for the signal processes also include resummation of soft gluon emission to next-to-logarithmic (NNLL) and next-to-leading-logarithmic (NLL) accuracy, respectively. As is described in Sec.VI A 3, it is important that the simulatedt¯tþγand
t¯tþZevents are as similar as possible. Therefore, a small 4% correction is applied to the t¯tþγ cross section to account for a different PDF set, factorization and renorm-alization scale, and number of partons from the matrix element.6The same NLO QCDKfactor is then applied to thet¯tþγ process as is used for thett¯þZð→νν¯Þprocess [47]. This choice is motivated by the similarity of QCD calculations for the two processes as well as empirical studies of the ratio ofKfactors computed as a function of the bosonpT. Further information about theKfactor and its
uncertainty is given in Sec.VII. The cross sections for the
t¯t, Wþjets, and Wt processes are used for cross-checks and optimization studies, while for the final results these processes are normalized to data in control regions.
All background samples, except for the t¯tþγ sample, are processed with the full simulation of the ATLAS detector[88]based on GEANT 4[89]. The signal samples
and thet¯tþγ sample are processed with a fast simulation [90]of the ATLAS detector with parameterized showers in the calorimeters. All samples are produced with varying numbers of simulated minimum-bias interactions generated with PYTHIA 8 overlaid on the hard-scattering event to
account for pileup from multiple pp interactions in the same or nearby bunch crossings. The average number of interactions per bunch crossing is reweighted to match the distribution in data. Furthermore, the simulated samples are reweighted to account for small differences in the efficien-cies of physics-object reconstruction and identification with respect to those measured in data.
IV. EVENT RECONSTRUCTION AND SELECTION
All events must satisfy a series of quality criteria before being considered for further use. The reconstructed primary vertex with the highest Ptracksp2T must have at least two associated tracks. In this analysis, physics objects are labeled as either baseline orsignal depending on various quality and kinematic requirements, where the latter label describes a tighter selection of the former. Baseline objects are used to distinguish between the physics objects in the event and to compute the missing transverse momentum. Baseline leptons (electrons and muons) are also used to apply a second-lepton veto to suppress dileptont¯tandWt
events.
Electron candidates are reconstructed from electromag-netic calorimeter cell clusters that are matched to ID tracks. Baseline electrons are required to have pT>7GeV,
jηj<2.47, and satisfy “VeryLoose” likelihood identifica-tion criteria that are defined following the methodology described in Ref. [91]. Signal electrons must pass all baseline requirements and in addition have pT>25GeV, satisfy the “Loose” likelihood identification criteria in Ref. [91], and have impact parameters with respect to the reconstructed primary vertex along the beam direction (z0) and in the transverse plane (d0) that satisfyjz0sinθj< 0.5mm and jd0j=σd0 <5, where σd0 is the uncertainty of
d0. Furthermore, signal electrons must be isolated, where the criteria use track-based information to obtain a 99% efficiency that is independent ofpT, as derived fromZ→
llMC samples and confirmed in data.
Muons are reconstructed from combined tracks that are formed from ID and MS tracks, ID tracks matched to MS track segments, standalone MS tracks, or ID tracks matched to an energy deposit in the calorimeter compatible with a minimum-ionizing particle (referred to as calo-tagged
muon) [92]. Baseline muons are required to have
pT>6GeV, jηj<2.7, and satisfy the “Loose” identifi-cation criteria described in Ref.[92]. Signal muons must pass all baseline requirements and in addition have
pT>25GeV, and have impact parameters jz0sinθj< 0.5mm andjd0j=σd0 <3. Furthermore, signal muons must be isolated according to isolation criteria similar to those used for signal electrons, yielding the same efficiency.
Photon identification is not used in the main event selection, and photons give rise to extra jet or electron candidates. Photons must be identified, however, for the
t¯tþγ sample that is used in the data-driven estimation of thet¯tþZbackground. In this case, photon candidates are reconstructed from calorimeter cell clusters and are required to satisfy the “Tight” identification criteria described in Ref.[93]. Furthermore, photons are required to have pT>125GeV and jηj<2.37, excluding the
barrel-end cap calorimeter transition in the range
1.37<jηj<1.52, so that the photon trigger is fully efficient. Photons must further satisfy isolation criteria based on both track and calorimeter information.
Jet candidates are built from topological clusters[94,95]in the calorimeters using the anti-ktalgorithm with a jet radius
parameterR¼0.4[96]. Jets are corrected for contamination from pileup using the jet area method [97–99] and then calibrated to account for the detector response[100,101]. Jets in data are further calibrated based onin situmeasurements of the jet energy scale. Baseline jets are required to have
pT>20GeV. Signal jets must have pT>25GeV and
jηj<2.5. Furthermore, signal jets with pT<50GeV are required to satisfy criteria, implemented in the jet vertex tagger algorithm[99], designed to reject jets originating from pileup. Events containing a jet that does not pass specific jet quality requirements are vetoed from the analysis in order to
6
Thet¯tþγ sample uses a fixed factorization and renormal-ization scale of2×mtop with no extra partons in the ME. The
t¯tþZsample uses the defaultPmTscale and is generated with
suppress detector noise and noncollision backgrounds
[102,103]. Jets resulting frombquarks (called bjets) are
identified using the MV2c20b-tagging algorithm, which is based on quantities such as impact parameters of associated tracks and reconstructed secondary vertices[104–106]. This algorithm is used at a working point that provides on average 77%b-tagging efficiency perbjet in simulatedt¯tevents. The choice of working point was optimized for this analysis and corresponds to a rejection factor of about 140 for light-quark flavors and gluons and about 5 for charm jets. Jets and associated tracks are also used to identify hadronically decayingτ leptons using the“Loose”identification criteria described in Refs.[107,108], which have a 60% and 50% efficiency for reconstructing τ leptons decaying into one and three charged pions, respectively. These τ candidates are required to have one or three associated tracks, with total electric charge opposite to that of the selected electron or muon, pT>20GeV, and jηj<2.5. This τ
candidatepTrequirement is applied after a dedicated energy
calibration[108].
The missing transverse momentum is reconstructed from the negative vector sum of the transverse momenta of baseline electrons, muons, jets, and a soft termbuilt from high-quality tracks that are associated with the primary vertex but not with the baseline physics objects[109,110]. For the event selections requiring photons, the calibrated photon is directly included in theEmiss
T calculation. In all
other cases, photons and hadronically decaying τ leptons are not explicitly included but enter as jets or electrons or via the soft term.
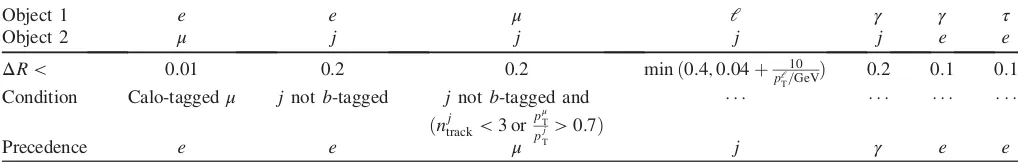
To avoid labeling the same detector signature as more than one object, an overlap removal procedure is applied. The procedure is tailored for this analysis and optimized using simulation. TableIIsummarizes the procedure. Given a set of baseline objects, the procedure checks for overlap based on a minimal distanceΔRbetween pairs of objects. For example, if a baseline electron and a baseline jet are found with ΔR <0.2, then the electron is retained (as stated in the “Precedence” row) and the jet is discarded, unless the jet isbtagged (as stated in the“Condition”row) in which case the electron is assumed to stem from a heavy-flavor decay and is hence discarded while the jet is retained.
If the“ΔR <”requirement in TableIIis not met, then both objects under consideration are kept. The order of steps in the procedure is given by the columns in TableII, which are executed from left to right. The second (ej) and the third (μj) steps of the procedure ensure that leptons and jets have a minimumΔRseparation of 0.2. Therefore, the fourth step (lj) only has an effect forΔR >0.2. The steps involving a photon are not applied in the main event selection but only for the event selection where photons are identified. For the remainder of the paper, all baseline and signal objects are those that have survived the overlap removal procedure.
Large-radius jets are clustered from all signal (small-radius R¼0.4) jets using the anti-kt algorithm with R¼1.0 or 1.2. To reduce the impact of soft radiation and pileup, the large-radius jets are groomed using reclus-tered jet trimming, where constituents withpTless than 5% of the ungroomed jetpTare removed[111–114]. Electrons
and muons are not included in the reclustering, since it was found that including them increases the background accep-tance more than the signal efficiency. Large-radius jets are not used in the overlap removal procedure; however, the signal jets that enter the reclustering have passed the overlap removal procedure described above. The analysis uses a large-radius jet mass, where the squared mass is defined as the square of the four-vector sum of the constituent (small-radius) jets’ momenta.
All events are required to haveEmissT >200GeV, exactly one signal lepton, and no additional baseline leptons, as well as at least four signal jets. In addition, the events must have a transverse mass7of the signal lepton and the missing transverse momentum satisfyingmT>30GeV and have
an azimuthal angle between each of the two leading jets and the missing transverse momentum of jΔϕðjeti; ~pmiss
T Þj> 0.4 with i∈f1;2g. The events must further pass an
Hmiss
T;sig>5 requirement, where HmissT;sig¼ðHmissT −100GeVÞ=
σHmiss
T . The variable H miss
[image:5.612.51.560.112.194.2]T is the magnitude of the negative
TABLE II. Overlap removal procedure. The first two rows list the types of overlapping objects: electrons (e), muons (μ), electron or muon (l), jets (j), photons (γ), and hadronically decayingτlepton (τ). All objects refer to the baseline definitions, except forγandτ where no distinction between baseline and signal definition is made. The third row specifies when an object pair is considered as overlapping, the fourth row describes an optional condition, and the last row lists which label is given to the ambiguous object. More information is given in the text.
Object 1 e e μ l γ γ τ
Object 2 μ j j j j e e
ΔR < 0.01 0.2 0.2 minð0.4;0.04þpl10
T=GeVÞ
0.2 0.1 0.1
Condition Calo-taggedμ jnotb-tagged jnotb-tagged and
ðnjtrack<3orpμT
pjT>0.7Þ
Precedence e e μ j γ e e
7The transverse mass m
T is defined as m2T¼2p lep T EmissT
vector sum of the transverse momenta of signal jets and the signal lepton; the resolution σHmiss
T is computed using the
per-event jet energy resolution uncertainties (more details are given in Refs.[29,115]). The latter three event selection criteria formT,jΔϕðjeti; ~pmissT Þj, andHmissT;sigsuppress
multi-jet processes with misidentified or nonprompt leptons and mismeasured Emiss
T to a negligible level. With the above
event selection, the dominant backgrounds are t¯t events with at least one leptonically decayingW boson andWþ
jets production. A powerful technique for suppressing these background processes is to requiremTto be greater than the W boson mass. For example, anmT>120GeV require-ment removes more than 90% oft¯tandWþjets events that pass the above event selection.
One of the dominant contributions to the residual background is from t¯t production where both W bosons decay leptonically or oneW boson decays leptonically and the other via a hadronic τ decay. A series of additional variables, described in detail in Ref. [29], are used to discriminate between these backgrounds and the signal processes. The asymmetricmT2(amT2)[116–119]andmτT2
are both variants of the variablemT2[120], a generalization of the transverse mass applied to signatures where two particles are not directly detected. Like the transverse mass,
mT2 is the minimum mass consistent with the observed
transverse momenta and is bounded by the parent particle mass for particular topologies. The amT2 variable targets dileptonict¯tevents where one lepton is not reconstructed. For these events, theamT2distribution has a kinematic end
point near the top quark mass. ThemτT2variable targetst¯t
events where one of the two W bosons decays via a
hadronically decaying τ lepton. In t¯t events where the hadronically decaying τ lepton is correctly identified,
mτT2≲mW. Due to the extra missing momentum from
neutralinos, signal events are characterized by large values of amT2 andmτT2.
To further suppress dileptonict¯tand other backgrounds, variables are constructed to tag the hadronic decays of top quarks. Themχtopvariable is the invariant mass of the three jets in the event most compatible with the hadronic decay products of a top quark, where the three jets are selected by aχ2fit to the lepton+jetst¯thypothesis, with one term for the mass of the hadronicWboson candidate and one term for the mass of the hadronic top quark candidate. The uncertainty on the multijet invariant masses is estimated from the jet-energy resolution. When the target top squark mass is large enough so that the resulting top quarks are significantly boosted in the lab frame, the mass of highpT
large-radius jets is a powerful tool that outperforms mχtop. Another kinematic variable that targets the dileptonic t¯t
background is topness [121]. As with mχtop, topness is
constructed by minimizing a χ2-type function. However, in contrast to mχtop, topness quantifies the kinematic compatibility with the dileptonic t¯t event topology where one lepton is not reconstructed. Low values of topness are
backgroundlike while high values of topness are kinemat-ically less consistent with dileptont¯tevents.
An important change from the run-1 suite of tools is the treatment of hadronically decayingτcandidates in themτT2
variable. To increase the efficiency and purity of selecting theτlepton, a reconstructed hadronicτcandidate is used as one of the two visible objects in themT2calculation. Events
are removed if one of the selected jets is additionally identified as a hadronicτ candidate, with a corresponding
mτT2<80GeV. For an event selection with a Emiss T >
200GeV requirement, this hadronic τ veto removes
approximately 40% of simulated t¯t events where one W
boson decays leptonically and the other decays via a hadronically decayingτ lepton. For the considered signal models, the veto removes 1% of the events. Theτ veto is applied in all following event selections except those defining the t¯tþZ control region (since the veto would remove only about 1% of the events in this region).
V. SIGNAL REGIONS
Three signal event selections (called signal regions, or SR1–3) are constructed using the set of discriminating variables described in Sec.IV. The three signal regions are optimized, before looking at the data, to maximize the discovery sensitivity using three benchmark signal models from the gluino-mediated top squark models, each represent-ing a distinct phenomenology. The benchmark models are defined by (g~,χ~01) masses of (1100, 800), (1250, 750), and (1400, 400) GeV for SR1, SR2, and SR3, respectively. The benchmark model for SR1 has a production cross section and kinematic properties similar to those of a direct top squark model with (~t1,χ~01) masses of about (600, 260) GeV, while the benchmark models for SR2 and SR3 cannot be directly mapped to have both the same cross sections and similar kinematic properties. As a consequence, SR2 and SR3 have reduced sensitivity to direct top squark models.
The three signal regions are characterized by increasing
Emiss
T requirements. The SR1 benchmark has the softest
Emiss
T spectrum and the momentum of the hadronically
decaying top quark is typically not sufficient to capture all of the decay products inside a single large-radius jet. As a result, the top quark mass computed using themχtopvariable
ΔR between the highest-pT b-tagged jet and the signal
lepton. The signal regions have additional requirements on the mT and Hmiss
T;sig variables to further exploit the large
genuineEmissT from undetected neutralinos. A requirement
of at least oneb-tagged jet is used in each of SR1–3 in order to reduce theWþjets and diboson backgrounds.
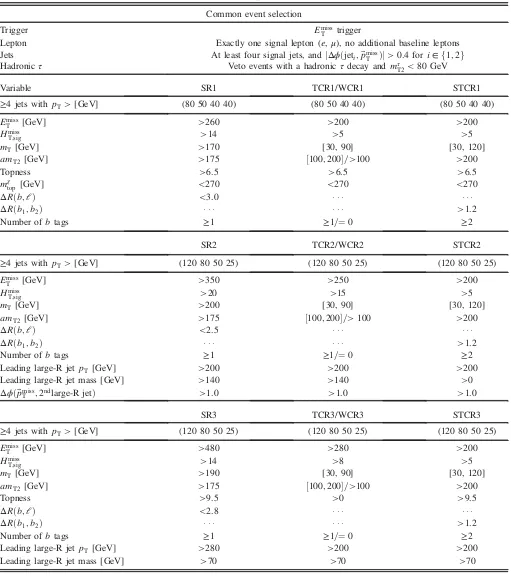
[image:7.612.52.563.72.650.2]The signal region definitions are summarized in TableIII. The signal regions are not mutually exclusive. TABLE III. Overview of the event selections for all SRs and the associated t¯t(TCR), Wþjets (WCR), andWt (STCR) control regions. Round brackets are used to describe lists of values and square brackets denote intervals.
Common event selection
Trigger Emiss
T trigger
Lepton Exactly one signal lepton (e,μ), no additional baseline leptons
Jets At least four signal jets, andjΔϕðjeti; ~pmissT Þj>0.4fori∈f1;2g
Hadronic τ Veto events with a hadronicτdecay andmτT2<80GeV
Variable SR1 TCR1/WCR1 STCR1
≥4jets withpT>[GeV] (80 50 40 40) (80 50 40 40) (80 50 40 40)
Emiss
T [GeV] >260 >200 >200
Hmiss
T;sig >14 >5 >5
mT [GeV] >170 [30, 90] [30, 120]
amT2 [GeV] >175 ½100;200=>100 >200
Topness >6.5 >6.5 >6.5
mχtop[GeV] <270 <270 <270
ΔRðb;lÞ <3.0
ΔRðb1; b2Þ >1.2
Number ofbtags ≥1 ≥1=¼0 ≥2
SR2 TCR2/WCR2 STCR2
≥4jets withpT>[GeV] (120 80 50 25) (120 80 50 25) (120 80 50 25)
Emiss
T [GeV] >350 >250 >200
Hmiss
T;sig >20 >15 >5
mT [GeV] >200 [30, 90] [30, 120]
amT2 [GeV] >175 ½100;200=>100 >200
ΔRðb;lÞ <2.5
ΔRðb1; b2Þ >1.2
Number ofbtags ≥1 ≥1=¼0 ≥2
Leading large-R jetpT [GeV] >200 >200 >200
Leading large-R jet mass [GeV] >140 >140 >0
Δϕðp~miss
T ;2ndlarge-R jetÞ >1.0 >1.0 >1.0
SR3 TCR3/WCR3 STCR3
≥4jets withpT>[GeV] (120 80 50 25) (120 80 50 25) (120 80 50 25)
Emiss
T [GeV] >480 >280 >200
Hmiss
T;sig >14 >8 >5
mT [GeV] >190 [30, 90] [30, 120]
amT2 [GeV] >175 ½100;200=>100 >200
Topness >9.5 >0 >9.5
ΔRðb;lÞ <2.8
ΔRðb1; b2Þ >1.2
Number ofbtags ≥1 ≥1=¼0 ≥2
Leading large-R jetpT [GeV] >280 >200 >200
VI. BACKGROUND ESTIMATES
The dominant background processes are t¯t, single top (Wt), t¯tþZð→νν¯Þ, andWþjets. Most of the t¯tandWt
events in the signal regions have both W bosons decay
leptonically (one of which is“lost”meaning it is either not reconstructed, not identified, or removed by the overlap
removal procedure) or one W boson decays leptonically
and the other via a hadronically decaying τ lepton. Other background processes considered are semileptonic t¯t, dibosons (denoted by VV in figure legends), t¯tþW,
Zþjets, and multijet events. Thet¯tbackground is shown separately in the three decay components discussed above, which are referred to as 2L,1L1τ, and 1L respectively.8The combined t¯tþW and t¯tþZ background is referred to as t¯tþV.
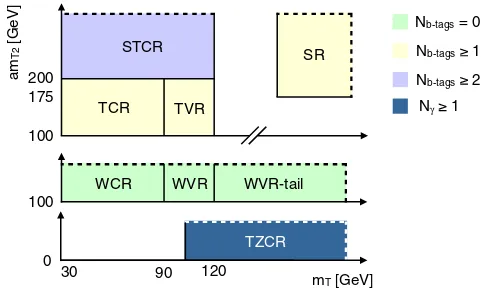
The main background processes are estimated by iso-lating each of them in a dedicated control region (CR), described in Sec. VI A, normalizing simulation to match data in a simultaneous fit. The fit is performed separately for each SR with the associated CRs. The background modeling as predicted by the fits is tested in a series of validation regions (VRs), discussed in Sec.VI B. Figure2 schematically illustrates the setup for one example SR and its associated CRs and VRs. The CRs forWtandt¯tþZare new with respect to the run-1 analysis.
The multijet background is estimated from data using a fake-factor method[122]. The contribution is found to be negligible. All other (small) backgrounds are determined from simulation, normalized to the most accurate theoreti-cal cross sections available. The Zþjets background is found to be negligible.
A. Control regions
A series of control regions are defined as event selections that are kinematically close to the signal regions but with a few key variable requirements inverted to significantly reduce signal contamination and enhance the yield and purity of a particular background. These control regions are then used to constrain the background normalization. Each of the three signal regions has a dedicated control region for each of the following background processes: t¯t (TCR),
Wþjets (WCR), single top (STCR), and t¯tþW=Z
(TZCR). The general strategy in constructing the control regions is toinvertthe transverse mass requirement from a high threshold to a low window. The requirements on several variables are loosened to increase the statistical power of the CR. The details of the TCR and the WCR are described in Sec. VI A 1, while the STCR and TZCR are
documented in Sec. VI A 2 and VI A 3, respectively.
Table III presents an overview of the CR selections for
the TCR, WCR, and STCR corresponding to SR1, SR2, and SR3.
A likelihood fit is performed for each SR and involves the SR and the associated CRs[123]. The expected number of events in each region is given by the sum over all background processes and optionally a signal model. The normalizations of thet¯t,t¯tþW=Z, single top, andWþjets backgrounds are controlled by four free parameters [normalization factors (NFs)] in the fit. Furthermore, a signal strength parameter to normalize the cross section of a given signal model can be included in the fit. Each fit is based on up to five observables: the total yields in four control regions and the total yield in one signal region. The electron and muon channels are always added together. To obtain a set of background predictions that are independent of the observations in the SRs, the fit can be configured to use only the CRs to constrain the fit parameters: the SR bins are removed from the likelihood and any potential signal contribution is neglected everywhere. This fit configuration is referred to as the background-only fit.
1. Top and W CRs
The TCRs and WCRs are constructed by modifying the
mTselection in the SRs to be a window whose upper edge is near theW boson mass. An additional upper bound on
amT2 is applied to the TCRs in order to make them
orthogonal to the STCRs, described in the next section. Furthermore, some other kinematic requirements are relaxed or removed to increase the event yields in the CRs. The resulting selections yield 238, 102, and 121 events in TCR1, TCR2, and TCR3, respectively, which are enriched in semileptonic t¯t events with purities that vary between 75% and 85%. The WCRs are built from the TCRs by changing the b-jet requirement to a b-jet veto and
30 90 120
100
100 175 200
am
T2
[GeV]
Nb-tags = 0
Nb-tags 1
Nb-tags 2
0
N 1
WCR WVR WVR-tail
TCR TVR
STCR
SR
[image:8.612.316.557.47.192.2]mT [GeV] TZCR
FIG. 2. A schematic diagram for the various event selections used to estimate and validate the background model and then search for top squark production. Solid lines indicate kinematic boundaries while dashed lines indicate that the events can extend beyond the boundary. CR, VR, and SR stand for control region, validation region, and signal region, respectively. T, ST, TZ, and W stand fort¯t, single top,t¯tþZ, andWþjets, respectively.
8The letter L is used to denote an electron or muon, including
relaxing theamT2requirement. Theb-jet veto suppressest¯t
events and results in a Wþjets purity of approximately 75% in all three regions. The selections yield 558, 135, and 352 events in WCR1, WCR2, and WCR3, respectively.
2. Single-top CR
All of the expected single-top contributions in the three SRs are in theWt channel. This process can evade kinematic bounds from selections targeting the suppres-sion of t¯t.
Nonetheless, isolating a pure sample of Wt events
kinematically close to the SRs is challenging due to the similarity of Wt and t¯t. The Wt events that pass event selections similar to those for the SRs often have a secondb
jet within the acceptance. TheamT2variable is useful for
discriminating betweent¯tandWtbecause the mass of the
Wb system not from the resonant top quark is typically higher than for an on-shell top quark in the phase space selected by this analysis. Therefore, the STCRs are char-acterized by amT2>200GeV. Furthermore, to increase
the purity of Wt and reduce the Wþjets contamination,
with photon added [GeV] miss T = E miss T E ~
100 200 300 400
Events / 20 GeV
10 20 30 40 50 Data 2L t t τ 1L1 t t 1L t t Single Top W+jets +V t t VV Total SM ATLAS -1 = 13 TeV, 3.2 fb s
STCR1
[GeV]
T2
am
100 200 300 400
Data / SM 0.5 1 1.5
[GeV]
T2
am
0 100 200 300 400 500
t
Wt / t
0 0.5 1 1.5
with photon added [GeV] miss T = E miss T E ~
0 1 2 3 4 5
Events 100 200 300 400 500 Data 2L t t τ 1L1 t t 1L t t Single Top W+jets +V t t VV Total SM ATLAS -1 = 13 TeV, 3.2 fb s
STCR1
b-tagged jet multiplicity
0 1 2 3 4 5
Data / SM 0.5 1 1.5
b-tagged jet multiplicity
0 1 2 3 4 5
Wt / W+jets
0 1 2 3
with photon added [GeV] miss T = E miss T E~
1 2 3 4 5
Events / 0.3
10 20 30 Data 2L t t τ 1L1 t t 1L t t Single Top W+jets +V t t VV Total SM ATLAS -1 = 13 TeV, 3.2 fb s STCR1 ) 2 ,b 1 R(b Δ
1 2 3 4 5
Data / SM
0.5 1 1.5 ) 2 ,b 1 R(b Δ
0 1 2 3 4 5
t
Wt / t
[image:9.612.89.525.206.630.2]0 0.5 1 1.5
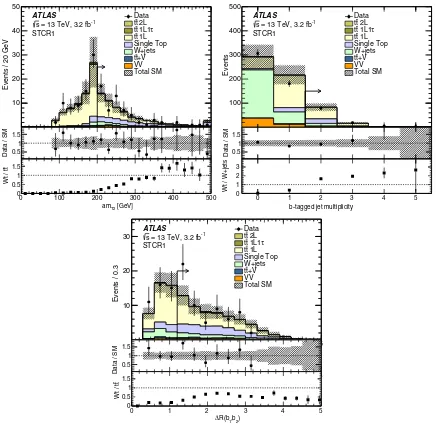
FIG. 3. Comparison of data with estimated backgrounds in theamT2(top left),b-tagged jet multiplicity (top right), andΔRðb1; b2Þ
events are required to have two b-tagged jets. Top quark pair events often exceed the amT2 kinematic bound when
one of the twobtags used in theamT2 calculation is a jet
produced from a charm quark from theWdecay. When this jet is from the same top quark as the otherb-tagged jet, the ΔR between them tends to be smaller than forWt events that have two bjets frombquarks that are naturally well separated. Therefore, to further increase the Wt purity, events in the STCRs are required to haveΔRðb1; b2Þ>1.2, where b1 and b2 are the two highest-pT b-tagged jets.
Figure 3 shows distributions of the key variables for
STCR1 with all requirements applied except for that on the quantity plotted. The expected purity forWt events is approximately 40% in all three STCRs, and the selections yield 62, 71, and 45 events in STCR1, STCR2, and STCR3, respectively.
3. t¯tþZ CR
Top quark pair production in association with aZboson that decays into neutrinos is an irreducible background. The expected contributions oft¯tþW in the three SRs are less than 10% with respect to the expectedt¯tþZyields, and the two processes are combined in the analysis. A CR usingZ
boson decays to charged leptons is not feasible given the small branching ratio to leptons and the limited data set available. However, a data-driven approach is still possible using a similar process: t¯tþγ. Similar techniques have been used for estimating Zð→νν¯Þ þjets from γþjets
[124] and the method was studied as a VR in the direct
top squark search with one lepton with run-1 data[29]. An event selection is constructed requiring a high-pT photon that is then treated as EmissT in direct analogy to Z→νν.¯
The CR is designed to minimize the differences between the two processes, in order to reduce the theoretical uncertainties in the extrapolation. The Feynman diagrams for the production oft¯tþZandt¯tþγare identical, except for a negligible production contribution where theZboson is radiated from a neutrino (the coupling is absent for
photons). The main differences arise from the Z boson
mass, which reduces the available phase space, causing differences in kinematic distributions. In addition, the bremsstrahlung rate forZ bosons is highly suppressed at LHC energies, while there is a large contribution to the
t¯tþγ cross section from photons radiated from the top quark or its decay products. Both of these differences are mitigated if the bosonpTis larger than theZboson mass. In
this limit, the impact of the mass difference on the available phase space is reduced and the rate of photon radiation from bremsstrahlung is suppressed[87]. This small fraction of photons is fully accounted for in the simulation and any uncertainty in their modeling is subdominant compared to the uncertainties described in Sec.VII. In high-Emiss
T t¯tþ Zð→νν¯Þevents, theZbosonpTis the dominant source of
EmissT and so most t¯tþZ events in the SRs have large Z
bosonpT.
Twot¯tþγCRs are designed to be kinematically close to SR1 and SR2/SR3. The event selection for TZCR2 is the same as for TZCR3. The regions require at least one signal photon, exactly one signal lepton and no additional base-line leptons, and at least four signal jets, of which at least one must be b tagged. In addition, the regions have the same jetpTthresholds as the corresponding signal regions.
To mimic the Z→νν¯ decay, the highest-pT photon is vectorially added top~missT and this sum is used to construct
with photon added [GeV]
miss T = E miss T E ~
100 200 300 400
Events / 50 GeV
5 10 15 20 25 Data γ + t t 1L t t Total SM ATLAS -1
= 13 TeV, 3.2 fb s
TZCR1
with photon added [GeV]
miss T = E miss T E~
100 200 300 400
Data / SM 0.5 1 1.5
with photon added [GeV]
miss T = E miss T E ~
100 200 300 400
Events / 50 GeV
5 10 15 20 25 Data γ + t t 1L t t Total SM ATLAS -1
= 13 TeV, 3.2 fb s TZCR1 [GeV] miss T p with photon added to the
T
= m
T
m~
0 100 200 300 400 500
[image:10.612.97.517.459.660.2]Data / SM 0.5 1 1.5
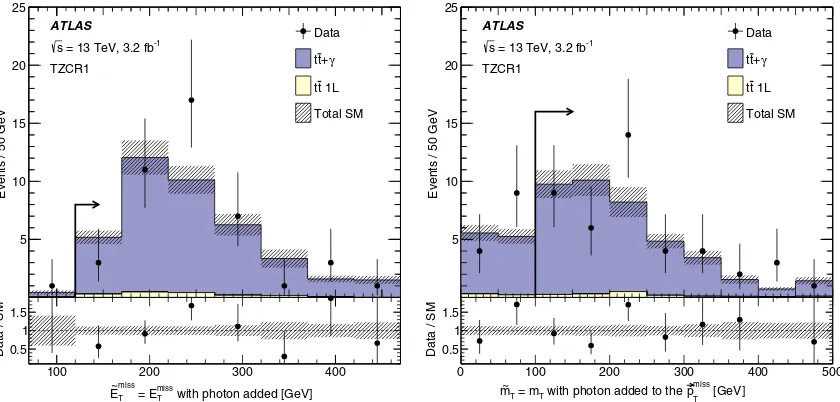
FIG. 4. Comparison of data with estimated backgrounds in theE~missT andm~Tdistributions with the TZCR1 event selection except for
the requirement (indicated by an arrow) on the shown variable. The variablesE~missT andm~Tare constructed in the same way asEmissT and
mTbut treating the leading photon transverse momentum as invisible. The predicted backgrounds are scaled with the NFs documented in
~
EmissT ¼ jp~missT þp~
γ
Tj, m~T, and H~missT;sig. Events entering the
TZCRs are required to satisfy E~missT >120GeV, ~
mT>100GeV, andH~missT;sig>5in order to bring the region
kinematically closer to the SRs. Finally,Emiss
T <200GeV
is imposed to ensure orthogonality between the TZCR and the other CRs and SRs. The resulting regions have over 90%t¯tþγpurity and yield 43 and 45 events in TZCR1 and
TZCR2 (=TZCR3), respectively. Figure 4shows the
dis-tribution ofE~missT andm~T in the TZCR1 corresponding to
SR1 before the requirement on the plotted variable is applied. The contribution from events not involving top quarks is negligible. The predicted backgrounds in the figure are scaled with the NFs documented in Table IV. Without scaling, the total number of events in data is about 40% higher than in simulation, but there is no significant evidence of mismodeling of the shapes of the various distributions within uncertainties.
B. Validation regions
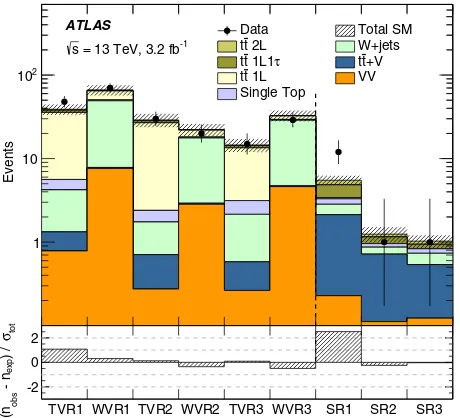
The background estimates are tested using validation regions, which are disjoint to both the control and signal regions. Background normalizations determined in the control regions are extrapolated to the VRs and compared with the observed data. Each signal region has associated validation regions for the t¯t (TVR) and Wþjets (WVR) processes, and these are constructed with the same
selec-tion as the TCR/WCR except thatmT is between 90 and
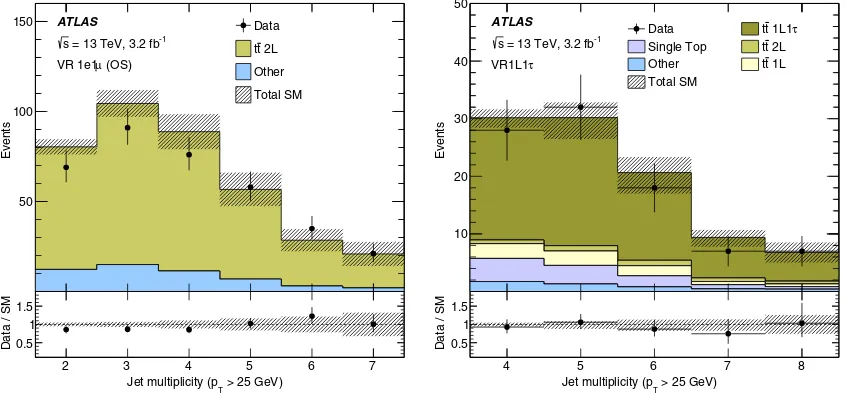
120 GeV.9The validation regions are not used to constrain parameters in the fit but provide a statistically independent test of the background estimates made using the CRs. In Fig.5, background estimates in all the associated VRs are compared to the observed data. The potential signal contamination in the VRs is studied for all considered signal models (and SUSY mass ranges) and found to be negligible.
[image:11.612.52.568.98.289.2]A second set of validation regions, not associated with any of the three signal regions, is used for general monitoring purposes. Two of the more significant back-grounds are dileptonict¯t and lepton+hadronicτ t¯tevents. TABLE IV. The numbers of observed events in the three SRs together with the expected numbers of background events and their uncertainties as predicted by the background-only fits, the scaling factors for the background predictions in the fit (NF), the probabilities (represented by thep0values) that the observed numbers of events are compatible with the background-only hypothesis, as well as the expected and observed 95% C.L. upper limits on the number of non-SM events.
Signal region SR1 SR2 SR3
Observed 12 1 1
Total background 5.500.72 1.250.26 1.030.18
t¯t 2.210.60 0.290.10 0.200.07
(1L,1L1τ, 2L) in % (6, 48, 46) (0, 58, 42) (0, 36, 64)
Single top 0.460.39 0.090.08 0.100.09
Wþjets 0.710.43 0.15−þ00..1519 0.200.09
t¯tþV 1.900.42 0.610.14 0.410.10
Diboson 0.230.15 0.110.07 0.120.07
t¯tNF 1.100.14 1.060.14 0.800.13
Single top NF 0.620.46 0.650.49 0.710.42
Wþjets NF 0.750.12 0.780.15 0.930.12
t¯tþW=ZNF 1.420.24 1.450.24 1.460.24
p0 0.012 (2.3σ) 0.50 (0.0σ) 0.50 (0.0σ)
Nlimit
non-SMexp. (95% C.L.) 6.4þ3
.2
−2.0 3.6þ2 .3
−1.3 3.5þ2 .2
−1.2
Nlimit
non-SMobs. (95% C.L.) 13.3 3.4 3.4
with photon added [GeV] miss
T = E miss T E ~
0.11 0.22 0.33 0.44 0.56 0.67 0.78 0.89
Events
1 10
2 10
Data Total SM 2L
t
t W+jets
τ
1L1 t
t tt+V
1L t
t VV
Single Top ATLAS
-1 = 13 TeV, 3.2 fb s
TVR1 WVR1 TVR2 WVR2 TVR3 WVR3 SR1 SR2 SR3
tot
σ
) /
exp
- n
obs
(n
-2 0 2
FIG. 5. Comparison of the observed data (nobs) with the
predicted background (nexp) in the validation and signal regions.
The background predictions are obtained using the background-only fit configuration. The bottom panel shows the significance of the difference between data and predicted background, where the significance is based on the total uncertainty (σtot).
9AWtVR is not defined since them
Trange in the STCR is
[image:11.612.61.291.432.641.2]To pass the four-jet requirement, such events must have at least one hard jet that does not originate from thet¯tdecay (two hard jets for dileptonict¯t). The modeling of these extra jets is validated in dedicated VRs that require either two signal leptons (electron or muon) or one signal lepton and one hadronic τ candidate. In Fig. 6 the jet multiplicity distributions are shown for event selections requiring an
electron-muon pair (left) and one lepton plus one τ
candidate (right). Additional validation regions are con-structed by considering (i) events with highEmiss
T , highmT,
and low amT2 for dileptont¯t events with a lost lepton or (ii) highmT and ab-jet veto to probe the modeling of the
resolution-induced mT tail in Wþjets events (using the
WVR-tail region in Fig. 2). There are no significant
indications of mismodeling in any of the validation regions.
VII. SYSTEMATIC UNCERTAINTIES
The systematic uncertainties in the signal and back-ground estimates arise both from experimental sources and from the uncertainties in the theoretical predictions and modeling. Since the yields from the dominant background sources,t¯t, single top,t¯tV, andWþjets, are all obtained in dedicated control regions, the modeling uncertainties for these processes affect only the extrapolation from the CRs into the signal regions (and between the various control regions) but not the overall normalization. The systematic uncertainties are included as nuisance parameters with Gaussian constraints and profiled in the likelihood fits.
The dominant experimental uncertainties arise from imperfect knowledge of the jet energy scale (JES) and jet energy resolution (JER)[101], the modeling of the b -tagging efficiencies forb,cand light-flavor jets[125,126] as well as the contribution to theEmiss
T soft term, i.e., from
tracks neither associated with any reconstructed objects nor identified as originating from pileup. From these sources, the resulting uncertainties in the extrapolation factors for going from the four CRs to the SRs are 4%–15% for JES, 0%–9% for JER, 0%–6% forbtagging, and 0%–3% for the
Emiss
T soft term. Other sources of experimental uncertainty
are the modeling of lepton- and photon-related quantities (energy scales, resolutions, reconstruction and identifica-tion efficiencies, isolaidentifica-tion, hadronic-τ identification) and the uncertainty in the integrated luminosity. These uncer-tainties have a small impact on the final results.
The uncertainties in the modeling of the single-top andt¯t
backgrounds include effects related to the MC event generator, the hadronization and fragmentation modeling, and the amount of initial- and final-state radiation [71]. The MC generator uncertainty is estimated by comparing events produced with POWHEG-BOX+HERWIG++ and with
MG5_AMC+HERWIG++. Events generated with POWHEG
-BOX are hadronized with either PYTHIA or HERWIG++ to
estimate the effect from the modeling of the fragmentation and hadronization. The impact of altering the amount of initial- and final-state radiation is estimated from compar-isons of POWHEG-BOX+PYTHIA samples with different
parton shower radiation, NLO radiation, and modified factorization and renormalization scales. One additional uncertainty stems from the modeling of the interference between thet¯tandWtprocesses at NLO. The uncertainty is estimated using inclusiveWWbb events, generated using MG5_AMC, which are compared with the sum of thet¯tand Wtprocesses[71]. The resulting theoretical uncertainties in the extrapolation factors for going from thet¯tandWtCRs to the SRs are 19%–26% for t¯t and 38%–57% for Wt
events, where the latter is dominated by the interfer-ence term.
with photon added [GeV]
miss T
= E
miss T
E ~
2 3 4 5 6 7
Events
50 100
150 Data
2L t t
Other
Total SM
ATLAS
-1
= 13 TeV, 3.2 fb s
(OS)
μ
VR 1e1
> 25 GeV)
T
Jet multiplicity (p
2 3 4 5 6 7
Data / SM 0.5 1 1.5
with photon added [GeV]
miss T
= E
miss T
E ~
4 5 6 7 8
Events
10 20 30 40 50
Data tt 1L1τ
Single Top tt 2L Other tt 1L Total SM
ATLAS
-1
= 13 TeV, 3.2 fb s
τ
VR1L1
> 25 GeV)
T
Jet multiplicity (p
4 5 6 7 8
[image:12.612.96.519.49.247.2]Data / SM 0.5 1 1.5
The t¯tþZ background is normalized using the t¯tþγ
CR and therefore there are uncertainties in both the kinematic extrapolation to the SR and in the conversion between the two processes. As described in Sec.III, a small correction factor is applied to the t¯tþγ cross section to account for differences in the generator setup, and the same
K factor is used for both processes. A first source of uncertainty is estimated by coherently varying the factori-zation and renormalifactori-zation scales between t¯tþZ and
t¯tþγ events generated at LO by a factor of 2. The impact of the scale choice is slightly different betweent¯tþZand
t¯tþγ, leading to a 10% uncertainty for high-pTbosons. An uncertainty due to NLO corrections is estimated by study-ing the kinematic dependence of the ratio of t¯tþZ and
t¯tþγ K factors. This ratio is studied by computing theK
factor for thet¯tþZandt¯tþγprocesses using MG5_AMC and OpenLoops+SHERPAas a function of the bosonpTwith
a series of variations in the generator setup. Coherently varying the factorization and renormalization scale (set to
HT¼ P
pTfor both LO and NLO) by a factor of 2 results
in a 5% uncertainty in the K-factor ratio. Comparing the results obtained with the NNPDF and the CT14[127]PDF sets changes the K-factor ratio by less than 2%. A final uncertainty of 5% is due to the difference inK-factor ratios between the two generators when the same scale and PDF set is used, resulting from a different choice of electroweak scheme. The resulting theoretical systematic uncertainty in the extrapolation from the t¯tþγ CR to the SR is 12%.
The uncertainty in the Wþjets background from the
merging of matrix elements and parton showers is studied by varying the scales related to the matching scheme. In addition, the effects of varying the renormalization, fac-torization, and resummation scales are estimated. Since the
Wþjets background is normalized in a CR with ab-tagged jet veto, additional uncertainties in the flavor composition of the Wþjets events in the signal region, based on the uncertainties in the measurement reported in Ref. [128]
extrapolated to higher jet multiplicities, are applied in all regions requiring at least oneb-tagged jet. The resulting theoretical uncertainties in the extrapolation from the
Wþjets CR to the SR amount to about 40%.
Since the diboson backgrounds are not normalized in a CR, the analysis is sensitive to the uncertainty in the total cross section, estimated to be 6%. In addition, the estimate from the nominal SHERPAsample is compared to that from a POWHEG-BOX+PYTHIAsample to account for differences
related to the MC event generator modeling. The resulting theoretical uncertainties for the diboson yields in the three SRs are about 50%.
The SUSY signal cross-section uncertainty is taken from an envelope of cross-section predictions using different PDF sets and factorization and renormalization scales, as described in Ref. [129], and the resulting uncertainties range from 13% to 23%. The uncertainty in the VLQ signal cross section is 10%[80].
VIII. RESULTS
Table IV (top part) and Fig. 5 (right part) show the number of observed events together with the predicted number of background events in the three SRs. The prediction is obtained using the background-only fit con-figuration described in Sec.VI. The SR2 and SR3 predicted yields agree well with the observed data in those regions. TableIV(middle part) also lists the results for the four free fit parameters that control the normalization of the four main backgrounds (NFs), together with the associated fit uncertainties. To quantify the compatibility of the SM background-only hypothesis with the observations in the SRs, a profile likelihood ratio test is performed. These fits are configured to include the SR bin in the likelihood. TableIVreports the resultingpvalues (p0), which are set to 0.5 for SR2 and SR3 since the observation lies below the prediction. The data exceeds the background prediction in
[GeV]
miss T
E
Events / 80 GeV
Data τ 1L1 t t 2L t t 1L t t Single Top W+jets Other +V t t VV Total SM
) = (1.1,0.7) TeV 1 t ~ ,m g ~ (m
) = (1.1,0.8) TeV 1 t ~ ,m g ~ (m ATLAS -1
= 13 TeV, 3.2 fb s
SR1
[GeV]
T
m
Events / 100 GeV
-1 10 1 10 2 10 3 10 Data τ 1L1 t t 2L t t 1L t t Single Top W+jets Other +V t t VV Total SM
) = (1.1,0.7) TeV 1 t ~ ,m g ~ (m
) = (1.1,0.8) TeV 1 t ~ ,m g ~ (m ATLAS -1
= 13 TeV, 3.2 fb s
SR1
100 200 300 400 500 600 700 800 900 100 200 300 400 500 600 700 800 5
10 15
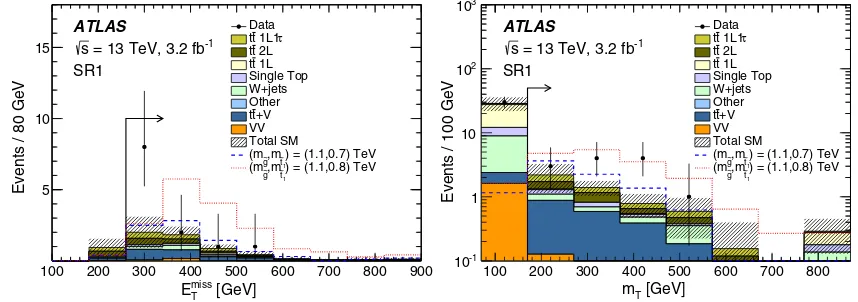
FIG. 7. TheEmiss
T (left) andmT(right) distributions in SR1. In each plot, the full event selection in the corresponding signal region is
[image:13.612.90.519.512.663.2]SR1 by 2.3 standard deviations. Four (eight) of the 12 observed events are in the electron (muon) channel. Figure 7 shows the Emiss
T and mT distributions in SR1
for the data, for the background prediction, as well as for two representative signal models.
The data are used to derive one-sided limits at 95% confidence level (C.L.) on generic beyond-SM yields and on the considered signal models. The results are obtained from a profile likelihood ratio test following the CLs
prescription [130]. Model-independent upper limits on beyond-SM contributions are derived separately for each SR, where the fit is configured to include the SR and all its associated CRs. A generic signal model is assumed that contributes only to the SR and for which neither exper-imental nor theoretical systematic uncertainties except for the luminosity uncertainty are considered. The resulting limits, expected as well as observed, on the number of beyond-SM events are shown in the bottom rows of Table IV.
Exclusion limits are also derived for the gluino-mediated top squark and direct top squark pair production models. The signal uncertainties and potential signal contributions to all regions are taken into account. All uncertainties except those in the theoretical signal cross section are included in the fit. Combined exclusion limits are obtained by selecting a priori the signal region with the lowest expected CLs value for each signal model.
Figure 8 shows the expected and observed exclusion
contours for both gluino-mediated and direct pair produc-tion of top squarks. The1σexp(yellow) uncertainty band
indicates the impact on the expected limit of all uncertain-ties included in the fit. The1σth (dotted red) uncertainty
lines around the observed limit illustrate the change in the
observed limit as the nominal signal cross section is scaled up and down by the theoretical cross-section uncertainty. The gap in the observed exclusion between about 600 and 750 GeV in the direct top squark model is due to a transition between signal regions (SR1 has the best expected sensi-tivity up to around 750 GeV for a masslessχ~01, beyond that SR2 has the best sensitivity) and the excess observed in SR1. The limits are sensitive to signal model assumptions. The gluino-mediated models have a 5 GeV mass splitting between the top squark and the neutralino and a 100% branching ratio for~t→cþχ~01. The impact of varying both of these assumptions is studied for SR2 with a benchmark model characterized by masses for the gluino and the top squark of ðmg~; m~t1Þ ¼ ð1250;750Þ GeV. There is a small
increase in the CLs value when increasing the mass gap
from 5 to 20 GeV and from switching between the two-body top squark decay and the four-two-body top squark decay
~
t→bff0χ~01, each with 100% branching ratio, but under all of these variations the model is excluded. The direct top squark pair production limits depend on the mixing of~tL
and ~tR in forming the mass eigenstates ~t1 and ~t2. The
nominal results assume that the~t1is mostly the~tR. The top squark mass limit for a massless neutralino is approxi-mately 70 GeV weaker when the~t1 is the~tL.
The search for direct gluino and direct top squark production can also be used to set limits in other models
of physics beyond the SM that produce t¯tþEmiss
T .
Examples are third-generation leptoquarks [133–139], which decay into a top quark and a neutrino (LQ→tν), and VLQ (T) models. For the former, limits on scalar
LQ→tν are identical to limits on direct top squark pair production with a massless neutralino and unpolarized
top quarks. For the latter, simulated samples of
[GeV]
g ~
m [GeV]t1
~ m < 0 t - m 1 t ~ - m g ~ m
) = 5 GeV 0 1 , 1 t ~ m( +soft, 0 1 1 t ~ , 1 t ~ t+ g ~ production, g ~ g ~ ) th 1 ±
Observed limit ( )
exp
1
±
Expected limit (
-1
ATLAS incl. 1L 8 TeV, 20.3 fb
-1
ATLAS mono-jet 13 TeV, 3.2 fb obs.
exp.
ATLAS
-1 = 13 TeV, 3.2 fb s
Limit at 95% CL
[GeV] 1 t ~ m [GeV] 0 1 m 0 1 t+ 1 t ~ production, 1 t ~ 1 t ~ ) th 1 ±
Observed limit ( )
exp
1
±
Expected limit (
-1
ATLAS stop1L 8 TeV, 20.3 fb obs.
exp.
ATLAS
-1 = 13 TeV, 3.2 fb s
Limit at 95% CL
[image:14.612.97.514.48.202.2]800 900 1000 1100 1200 1300 1400 1500 1600 500 550 600 650 700 750 800 850 200 300 400 500 600 700 800 900 1000 1100 1200 0 50 100 150 200 250 300 350 400 450
pair-producedT quarks are used to reinterpret the results. The T quark is assumed to decay in three possible ways:
T→tZ, T →tH, and T→bW. The search described in this paper has sensitivity mostly to theT→tZdecay mode with Zð→νν¯Þ due to the large Emiss
T requirements in the
analysis. The direct T pair production cross section is higher than for top squarks due to additional spin states, but after accounting for the Zð→νν¯Þ branching ratio, the models have a similar predicted yield. For aTquark with mass 800 GeV (just beyond the run-1 limit [34,140]), a branching ratioBðT →tZÞ above about 90% is excluded. Figure9shows the exclusion limit as a function of the T
quark mass. Assuming a branching ratio for T →tZ of
100%,T masses up to about 850 GeV are excluded.
IX. CONCLUSION
This paper presents a search for pair production of gluino-mediated top squarks with a small mass splitting between the top squark and the LSP and direct pair production of top squarks decaying to two top quarks and two lightest neutralinos in final states with one isolated lepton, jets, and missing transverse momentum. Three signal region selections are optimized for discovery in benchmark models just beyond the exclusion limits from LHC run-1 searches with the samet¯tþEmiss
T signature. The
search uses 3.2fb−1 of LHC pp collision data collected by the ATLAS experiment at a center-of-mass energy offfiffiffi
s p
¼13TeV. The observed data are consistent with data-driven background estimates in all three regions. The largest difference between data and the corresponding prediction is in the most inclusive signal region (SR1) and corresponds to 2.3 standard deviations above the estimated background. In the absence of a significant excess, exclusion limits at 95% C.L. are derived in the gluino and top squark pair production models. These extend the LHC run-1 exclusion limits on the gluino mass upward to 1460 GeV in the gluino-mediated top squark pair
production model for low top squark masses. For the direct top squark pair production models the results expand the LHC run-1 exclusion limits by excluding the top squark mass region from 745 to 780 GeV for a massless lightest neutralino. The analysis results are also reinterpreted to set exclusion limits in a model of vectorlike top quarks (T). Assuming a branching ratio forT→tZof 100%,Tmasses up to about 850 GeV are excluded.
ACKNOWLEDGMENTS
We thank CERN for the very successful operation of the LHC, as well as the support staff from our institutions without whom ATLAS could not be operated efficiently. We acknowledge the support of ANPCyT, Argentina; YerPhI, Armenia; ARC, Australia; BMWFW and FWF, Austria; ANAS, Azerbaijan; SSTC, Belarus; CNPq and FAPESP, Brazil; NSERC, NRC and CFI, Canada; CERN; CONICYT, Chile; CAS, MOST and NSFC, China; COLCIENCIAS, Colombia; MSMT CR, MPO CR and VSC CR, Czech Republic; DNRF and DNSRC, Denmark; IN2P3-CNRS, CEA-DSM/IRFU, France; GNSF, Georgia; BMBF, HGF, and MPG, Germany; GSRT, Greece; RGC, Hong Kong SAR, China; ISF, I-CORE and Benoziyo Center, Israel; INFN, Italy; MEXT and JSPS, Japan; CNRST, Morocco; FOM and NWO, Netherlands; RCN, Norway; MNiSW and NCN, Poland; FCT, Portugal; MNE/ IFA, Romania; MES of Russia and NRC KI, Russian Federation; JINR; MESTD, Serbia; MSSR, Slovakia;
ARRS and MIZŠ, Slovenia; DST/NRF, South Africa;
MINECO, Spain; SRC and Wallenberg Foundation, Sweden; SERI, SNSF and Cantons of Bern and Geneva, Switzerland; MOST, Taiwan; TAEK, Turkey; STFC, United Kingdom; DOE and NSF, United States of America. In addition, individual groups and members have received support from BCKDF, the Canada Council, CANARIE, CRC, Compute Canada, FQRNT, and the Ontario Innovation Trust, Canada; EPLANET, ERC,
FP7, Horizon 2020 and Marie Skłodowska-Curie
Actions, European Union; Investissements d’Avenir
Labex and Idex, ANR, Région Auvergne and Fondation Partager le Savoir, France; DFG and AvH Foundation, Germany; Herakleitos, Thales and Aristeia programmes co-financed by EU-ESF and the Greek NSRF; BSF, GIF and Minerva, Israel; BRF, Norway; Generalitat de Catalunya, Generalitat Valenciana, Spain; the Royal Society and Leverhulme Trust, United Kingdom. The crucial comput-ing support from all WLCG partners is acknowledged gratefully, in particular from CERN, the ATLAS Tier-1 facilities at TRIUMF (Canada), NDGF (Denmark, Norway, Sweden), CC-IN2P3 (France), KIT/GridKA (Germany), INFN-CNAF (Italy), NL-T1 (Netherlands), PIC (Spain), ASGC (Taiwan), RAL (United Kingdom) and BNL (USA), the Tier-2 facilities worldwide and large non-WLCG resource providers. Major contributors of computing resources are listed in Ref.[141].
[GeV] T m
[pb]
2 )
Zt
→
T
BR(
×σ
Upper limit on
1 −
10 1
Observed limit Expected limit
σ
1
± σ
2
±
Theory cross section
Zt → T production, TT
ATLAS
-1
= 13 TeV, 3.2 fb s
Limit at 95% C.L.
[image:15.612.78.271.50.189.2]700 800 900 1000 1100