coal with CCS technologies in a pulverized combustion power plant in the United Kingdom
.
White Rose Research Online URL for this paper:
http://eprints.whiterose.ac.uk/91397/
Version: Accepted Version
Article:
Al-Qayim, K., Nimmo, W. and Pourkashanian, M. (2015) Comparative Techno-economic
assessment of biomass and coal with CCS technologies in a pulverized combustion power
plant in the United Kingdom. International Journal of Greenhouse Gas Control, 43. 82 - 92.
ISSN 1750-5836
https://doi.org/10.1016/j.ijggc.2015.10.013
eprints@whiterose.ac.uk https://eprints.whiterose.ac.uk/ Reuse
Unless indicated otherwise, fulltext items are protected by copyright with all rights reserved. The copyright exception in section 29 of the Copyright, Designs and Patents Act 1988 allows the making of a single copy solely for the purpose of non-commercial research or private study within the limits of fair dealing. The publisher or other rights-holder may allow further reproduction and re-use of this version - refer to the White Rose Research Online record for this item. Where records identify the publisher as the copyright holder, users can verify any specific terms of use on the publisher’s website.
Takedown
If you consider content in White Rose Research Online to be in breach of UK law, please notify us by
Comparative Techno-economic assessment of biomass and coal with CCS
technologies in a pulverised combustion power plant in the United Kingdom.
Khalidah Al-Qayim, William Nimmo*, Mohammed Pourkashanian
Energy Engineering Group, Department of Mechanical Engineering, Faculty of Engineering,
University of Sheffield, UK
*w.nimmo@sheffield.ac.uk
Abstract
The technical performance and cost effectiveness of white wood pellets combustion in comparison to three types of coal namely U.S., Russian and Colombian coals are investigated in this study. Post-combustion Capture and Storage (CCS) namely with amine FG+, and Oxy-fuel with carbon capture and storage (Oxy-Oxy-fuel) are applied to a 650 MW pulverised combustion (PC) plant. The impacts of the Renewable Obligation Certificate (ROC) and carbon price (CP) policy and in accelerating the CCS deployment in the framework of GHG emissions mitigation, are also evaluated. The operational factors affecting CCS costs and emissions in the power generation plants are taken into consideration, hence, the Integrated Environmental Control Model (IECM 8.0.2) is employed for a systematic estimation of plant performance, costs and emissions of different scenarios of fuel and CCS technologies..
This study showed that the utilization of white wood pellets (WWP) in the electricity generation can annually avoid about 3M tonnes CO2 emissions from a 650 MW power plant. However, this mitigation process had impact on the plant efficiency and the cost of electricity. Further, the BECCS using white wood pellets has showed a better efficiency and lower cost of electricity with the oxy-fuel technology than the post-combustion CCS technology. However, in order to booster the BECCS deployment with the WWP, an increase of the ROC for biomass power plants, or, an increase of the carbon price for the coal power plants is recommended. It was found that, the sensitivity of COE towards the ROC was higher than towards the carbon price
variation. This result can be interpreted as the ROC
has more positive impact than the
carbon price, on the COE from the point of customers view without adding more
burdens on the power generation companies.
1. Introduction
Global warming is an issue of concern to the international community due to the climate change resulting from the temperature increase of the Earth atmosphere. The report of the Intergovernmental Panel on Climate Change (IPCC) in 2007, stated that in order to keep global warming below 2°C, and avoid the most dangerous consequences of climate change, global greenhouse gas (GHG) emissions must be reduced by 50-85% by 2050 – and peak no later than 2015 [1].
The largest contributor to GHG emissions is, the energy supply sector [2]. GHG emissions can be reduced from the energy supply sector, through multiple available mitigation options, such as energy efficiency improvements and fugitive emission reductions in energy conversion, transmission, and distribution systems, replacement of fossil fuel with less GHG emitting technologies such as renewable energy, nuclear power, and carbon dioxide capture and storage (CCS) [3]. According to the EIA World Energy Outlook report in 2009, Carbon Capture and Storage (CCS) in the power sector and in industry represents 10% of the total emissions savings in 2030 [4], and could provide almost 20% of the global emission cuts required by 2050 [1]. The only up to date large scale technology solution for CO2 negative emissions is Bio Energy with Carbon Capture and Storage (BECCS) [1, 5, 6]. This conclusion is based on the assumption that biomass combustion will release the same quantity of CO2 that is required for a sustainable biomass conversion; therefore emissions from biomass combustion are considered to be CO2 neutral [7]. Moreover, capture and long term storage of these CO2 emissions would effectively result in the net removal of atmospheric CO2, and biomass with CCS is potentially one of the few options for negative emissions [8].
2. Challenges & Incentives of BECCS Deployment
BECCS (renewable obligation certificates ROCs price), in addition to the carbon tax on fossil fuel emissions [5, 12-14]. Consequently, the Intergovernmental Panel on Climate Change 2014 5th Assessment Report has recommended certain regulations for fossil fuel facilities that enforce deployment of CCS power plants in the market place, [3]. At the same time, the report emphasized the requirement of clear regulations concerning short and long term
responsibilities for transportation and storage along with MMV standards for the Large scale future deployment of CCS.
According to the 2008 Climate Change Act that obligated a reduction of the UK’s greenhouse gas emissions by at least 80% by 2050, in July 2011, the UK Department of Energy and Climate Change, has set a carbon management plan that includes a budget target to cut carbon emissions by 50% (from the 1990 baseline) by 2027 [15]. An early outcome of this plan
was a significant increase in the bioenergy production and the low carbon electricity deployment since
2013. The 2014 energy statistics report published by the Department of Energy and Climate Change,
exhibits an increase of +4.2% in biofuel used to produce electricity from 2012 to 2013-quarter 4, and a
8.8% increase in the low carbon electricity supply from biofuels [16].
There has been a reasonable amount of economic analysis and cost effectiveness studies on power plants firing fossil fuels with CCS since the beginning of this century [14, 17-24]. Some of these researches included co-firing biomass with coal and with the deployment of carbon capture technologies [13, 25-29]
different biomass fuels including wood waste, and they found that the calorific value, steam turbine efficiency, capital cost, and operational costs are the most affecting parameters to the levelised cost of electricity. In the same year, Mcllveen-Wright et. al. [27] also evaluated the co-combustion of biomass with the pulverised coal in three different combustion technologies. Their work showed that applying the Renewable obligation Credit (ROC) is more transparent and cost-effective than the carbon price in the co-firing power plants. Similar techno-economic assessments of co-firing biomass with coal were performed by Catalonotti et al. (2013), and Meerman et al. (2013) [28, 29]. They both found that for wood pellets IGCC with CCS technology was the cheapest BECCS technology with a significant impact of the biomass price on the production cost.
This paper aims to investigate the performance and economic feasibility of dedicated large scale BECCS technology for power generation, in comparison to coal. The study is part of the BIO-CAP-UK project that utilizes amine based post-combustion carbon capture and oxy-biomass combustion of a 250 kW combustion rig for CCS researches. The main objectives of this study are to: (i) quantify and compare the technical performance and cost effectiveness of combustion based power plants using white wood pellets and coal with and without CCS technologies; (ii) explore the impact of key assumptions on both of these comparisons; (iii) evaluate the role of Carbon capture technology on the plant cost; and (4) evaluate the role of carbon price policy and Renewable Obligation Certificate (ROC) in accelerating CCS deployment in the framework of GHG emissions mitigation.
3. Integrated System Approach for Current Assessment
fuel, that neglects the required
modifications to the boiler, ash handling system and flue
gas treatment systems to control emissions for biomass cases. In addition, the
emission constraints in the IECM determine the removal efficiencies of control systems
for SO2, NOx, and particulate matter required to comply with the US emission
constraints. When changing the limits to the UK limits, the removal efficiency of
pollutants will change. Never the less, the IECM developers have confirmed the
applicability of the program on the biomass fuels without any significant errors.
Detailed technical information on the IECM program can be found in the Carnegie Mellon University website [34].In this study, we evaluate the influence of fuel properties, co-firing blend ratios and CCS technology on the plant performance in terms of plant efficiency (high heating value HHV basis), CO2 removal efficiency, and energy penalty. While the key cost measures are the capital cost, the total levelised cost of electricity ($.MW-1. h-1), added cost of CCS, and cost of CO2 avoided. Also, we examine the sensitivity of the total cost of white wood power plant to different scenarios of fuel price, carbon taxes and credits. To achieve these predictions, IECM version 8.0.2 is employed.
Taking into consideration the UK regulatory policies for power generation and local market prices, the performance and cost parameters are updated accordingly. The performance assumptions were modified according to the Levelised Cost Model (LCM) of electricity generation published by the Department of Energy and Climate Change in 2013 [35]. However, the LCM represents all project costs per MW of capacity over a quite range of plant sizes between 150-600 MW. While the IECM uses costs per tonne and results $ per year or per tonne except for the cost of electricity, which is calculated in $.kW-1h-1. Nevertheless, a comparison of IECM cost results with the LCM projections for coal and biomass combustion power plants will be shown for validation. In addition, the IECM program presents all costs in US dollars, therefore, the up to date exchange rate to the British pound is interpreted in the final results.
4. Study Cases
4.1
Baseline Comparison
of the IECM program in this study [36]. A Super-Critical boiler (SC) is used to generate steam at the super-critical conditions. In support to this selection, other energy studies have used the super-critical boiler, as the typical boiler type in the UK power plants [28, 37]. The boiler is designed to have tangential firing and about 90% efficiency. The air/oxy gases are preheated before inlet to the boiler, The pollutants removal technologies are applied to meet the Large Combustion Plant Directive 2001/80/EC (LCPD) of the European Parliament issued in 2001 and amended in 2009 for the emission ceiling of large combustion plants [38]. Selective Catalytic Reduction (Hot-side SCR, 2 x 50% trains) is used for 62% NOx removal plus, the inside furnace control that removes 38% of the NOx. Also, SO2 removal is performed via lime spray dryer. Although SOx emissions in the Ref-WWP is very low, the flue gas desulphurization unit (FGD) is added to maintain consistency in cost variables for all plants. Cold-side Electrostatic Precipitation (CEP) is used for particulate removal at 99.5% efficiency. Up-to-date there are no mercury emission limitations for combustion power plants in the UK, however, a Mercury removal system via carbon injection is included in the plant configuration to comply with the global agreement of Minamata Convention on Mercury held in 2013, to install the Best Available Technologies on new power plants and facilities with plans to be drawn up to bring emissions down from their existing levels [39]. In addition, cooling water is recirculated through
a wet cooling tower to maintain plant efficiency and reduce water consumption.
Table 1
shows the European Parliament and the UK governmental emission ceiling for the
coal-firing and biomass-firing power generation plants [38].
Parameter SO2 [38] NOx [38] CO2 [40] Fly Ash [41]
Unit mg.Nm-3 mg.Nm-3 g CO2.MJe
-1
LOI, wt%
Power plant Size, MWth >300 50-500 >50 kW >50 kW
Plant Type Biomass /Coal Biomass /Coal Coal Biomass /Coal
Emission Ceiling 200 300 / 200 5
By far the largest proportion of imported wood pellets by the UK power stations came from Canada for the last four years and reached 1.72 million tonnes of pellets in 2012 [42]. Therefore, the WWP fuel properties and costs, used herein are of the Canadian white wood pellets.
[image:7.595.77.519.493.598.2]On the same basis, the Colombian El Cerejon, Russian steam, and US Appalachian coal types, referred to as COC, RUC, and USC were selected for comparison with WWP. These fuel types were selected based on actual data of the most imported coal types to the UK in the
last few years. Since the second half of 2010, the British coal production has declined by 30% and this mainly due to the closure of several coal mining companies. As a result the dependence on imported coal has increased by 10% from 2012 to 2013 [43]. The fuel properties and market prices are listed in Table 2.
Comparisons of the four fuel type plants in terms of overall plant efficiency, total capital required (TCR), and cost of electricity (COE) are implemented in this study.
a: db = dry basis
b: daf = dry ash-free
4.2
Post-Combustion Carbon Capture Plant
[image:8.595.67.503.237.514.2]The post-combustion amine-capture plant technology is added to each reference plant employing ECONAMINE FG PLUS capture plant with 90% assumed removal efficiency, along with transportation and storage processes referred here as the CCS plant. There are other technologies using Ammonia as the sorbent or polymer membrane penetration technology, however they are not considered in this study as the Amine FG+ technology is a mature and well commercially established technology while the other technologies have proven in other research work to be more expensive and less efficient [22, 49]. The IECM assumes a 99.9% pure CO2 will be compressed after the carbon capture plant with traces of other gases, such as HCl, NOx and SO3. The plant BL CO2 gas pressure is 13.79 MPa, and the pumped gas through pipelines is under 11.86 MPa pressure with minimum pressure of 10.30 MPa.
Table 2- Fuel Properties and cost per tonne [34, 44-48].
Fuel Type White Wood
Pellets (WWP)
Russian Coal (RUC)
Colombian Coal (COC)
US Coal (USC)
HHV, kJ.kg-1 (db) 18,660 27,290 32,000 30,842
Fuel Cost, FOB £.tonne-1 189.91 54.00 55.45 53.18
Fuel Cost (£.GJ-1, HHV) 10.18 1.98 1.73 1.72
Moisture, wt% 8.03 10.65 3.09 5.63
Ash, wt% (db)a 0.29 15.67 1.39 9.79
Carbon, wt% (daf)b 46.61 60.36 78.72 71.74
Hydrogen, wt% (daf) 5.7 4.5 5.18 4.62
Oxygen, wt% (daf) 40.18 8.35 9.71 6.09
Nitrogen, wt% (daf) 0.07 1.84 1.52 1.42
4.3
Oxy-fuel Combustion Plants
Another carbon mitigation technology is considered in this study namely the Oxy-Fuel Combustion (Oxy-WWP, Oxy-PC) for wood pellets and coal respectively, with an integrated Air Separation Unit (ASU), and the offshore storage of CO2 in a depleted oil or gas field, with a new infrastructure. The plant BL CO2 gas pressure is 13.79 MPa, and the pumped gas through pipelines is under 11.79 MPa pressure with minimum pressure of 10.30 MPa.
5. Operational & Economic Assumptions
For the purpose of performance and cost evaluation at the large scale power plants, the
reference plant is set to 650 MW gross power output.
This capacity was selected to match
the typical existing capacity of coal firing power plants. This will help the comparison of
exact power plant scales between coal and biomass fuel performances, knowing that
the advanced supercritical steam turbine scale can be 400 -1000 MW power [50].
The capacity factor (CF) for coal is assumed 70%, that is in line with the EIA monthly capacity factor data of power generation from various fuels and technologies, and the biomass CF is equal to 62.3% according to the Digest of UK Energy Statistics (DUKES) [51, 52]. The plant life for coal is assumed to be 25 years and for biomass dedicated power plant is 20 years according to the LCM criteria [35]. The reason for the deference in lifetime is due to the sever fouling, slagging and high temperature corrosion of the boiler tubes when biomass fuels are used, those can lead to tube leakages, tube clogging, and unplanned shutdowns of the boiler that would cause a shorter lifetime [53]. The discount rate is 10% based on the LCM [35]. The effective tax rate (ETR) is the effective rate of tax by reference to pre-tax and post-tax rates of return. The values of ETR for biomass is 21% and for the coal is 13.5% {DECC, 2013 #936}. The difference in values is referred to the lifetime of the plant and the capital cost {KPMG, 2013 #1040}. [image:9.595.60.512.713.776.2]Tables 3 and 4 list the operational performance and cost parameters for the biomass and coal fired power plants. Although, some of these parameters are associated with errors and uncertainties in real applications such as the capacity factor and fixed charge factor, they are considered as deterministic values in the nominal cases.
Table 3- Key Operational assumptions and plant configuration for case study analysis.
White Wood Pellets Coal
Parameter
Ref -WWP
CCS-WWP
Oxy-WWP
Ref-PC CCS-PC
6. Variability & Uncertainty Analysis
Although, many CCS techno-economic studies produce deterministic values of cost with a high degree of confidence and accuracy, the plant-level studies tend to include a sensitivity analysis for certain assumptions on the parameters that can take more than one value, such as the fuel price, capacity factor, fixed charge factor, and carbon price [18, 23, 28, 37]. Such studies employ the probability distributions or assign a range of values to the uncertain parameters. On the other hand, “Uncertainty” reflects a lack of knowledge about the precise value of one or more of the parameters affecting the CCS costs. For example, a study that incorporates the
Gross plant size (MW) 650 650 650 650 650 650
Plant life (yr) [35, 36] 20 20 20 25 25 25
Capacity Factor CF (%) [35, 51] 62.3 62.3 62.3 70 70 70
Unit type Super Critical
Boiler firing type Tangential
Fuel flowrate tonne.h-1 312.0 385.3 299.9 182.8 219.3 175.6
Boiler Efficiency, % 86.69 86.69 90.17 90.77 90.77 94.44
Excess air for furnace (% stoich.) 20.0 20.0 5.0 20.0 20.0 5.0
Leaking air at preheater (% stoich.) 10.0 10.0 2.0 10.0 10.0 2.0
Gas temp. exiting preheater, oC 320
CO2 capture efficiency (%) 0.0 90 87.1 0.0 90 87.1
CPU recovery efficiency (%) - - 95.0 - - 95.0
[image:10.595.78.467.440.584.2]CO2 produced gas pressure (MPa) - 13.79 13.79 - 13.79 13.79
Table 4- Economic model parameters for biomass and coal combustion.
Parameter WWP Coal
Fuel Price (£.tonne-1) 189.9 53-55
Discount Rate ( %) [35] 10 10
Labour rate, £.hr-1[54] 30.25 30.25
Effective tax rate (%) [35] 21 13.5
CO2 transport & storage cost (£.tonne -1
concept of contingency cost factor on capital cost when investigating new methods or new solvents, or even new plant size that have not been commercialized yet [13, 19]. Other studies went further in assuming scenarios for the future policies or incentives of CCS especially when biomass is deployed in the co-firing or a conversion plant [11, 29, 56].
In this study, the sensitivity of Plant Efficiency towards the fuel type, the COE towards the fuel price, and Carbon Price will be examined. In addition, the uncertainty analysis of ROCs in biomass-firing plants will be investigated and discussed herein.
6.1.1 WWP Price Variation
Biomass fuels, including wood pellets, cost consistently less than oil fuels although at 2009 prices are only marginally cheaper than the mains gas. While woodchips are always cheaper than wood pellets on a per kWh basis variable fuel quality, in particular high moisture content, can erode the margin significantly. Other factors in the woodchip price are the number of times timber is handled between standing as a tree and being delivered into a silo, and the distance woodchips are transported. A crude rule of thumb is that it costs up to £10 every time a tonne of wood is handled. In respect of wood pellets this costs 0.20 pence per kWh whereas for woodchips, the cost is 0.29 pence per kWh at 30% moisture content and 0.44 pence at 50% moisture content. Another rule of thumb applied across Europe is that it is uneconomic to transport woodchips more than about 30 miles because the fuel cost per kWh increases disproportionately above that distance [57]. Prices of imported wood pellets are listed in Table 5.
To make the WWP more profitable as combustion fuel in power plants, there must be some reduction in the fuel cost. This can be achieved if local wood pellets are used with a reduction
Table 5- Prices of wood pellets available at the UK markets. Type of Wood Pellets Price,
£.tonne-1
Price, £.GJ-1
Ref.
UK Wood Pellets 182.66 11.03 [44]
Russian Wood Pellets 184.41 10.03 [58]
Canadian Wood Pellets 189.90 10.18 [59]
of processing, drying, and pelleting costs. Also, the fuel properties such as the moisture and bulk density have a great influence on its heating value and ultimately its cost per unit of heat or electricity produced. Another way to reduce the fuel cost is by looking for much cheaper sources of imported pellets, such as from African or south Asian countries instead of Canadian and Russian sources.
The impact of wood pellets cost on COE produced compared with coal is also investigated in this study within the range of 1-11 £.GJ-1 that both fuels fall in.
6.1.2 Coal Price Variation
The projected coal prices for the next 15 years published by the DECC were used in this study to calculate the breakeven fuel price that gives cost-effectiveness to the BECCS in power generation plants [60]. The projection has three scenarios, low, central and high. The low price projection is based on importing from South Africa as the cheapest supplier for steam coal to the European countries in 2020 (55.2 £.tonne-1). The central projection accounts for updated historical data on the relationship between coal and gas prices (73.0 £.tonne-1). Whereas, the high scenario is based on lower productivity growth rates, higher mining wages, higher transportation costs and higher mine equipment costs (98.5 £.tonne-1).
7. Results & Discussion
7.1
Effect of CCS and Oxy-fuel Processes on Plant Efficiency
The combustion plant performance relies on the fuel quality in terms of heating value (HHV), composition, and the capacity factor which is the annual average value, representing the percentage of equivalent full load operation during a year depending on the number of operating hours [61]. The plant efficiency is then calculated as the percentage ratio of net electrical output (MW) to the total plant heat input (GJ.h-1 or MW.yr-1). The low plant efficiency elucidates high losses in the power generated due to the plant equipment and pollution equipment, in other words represents the energy penalties. The plant efficiency results are listed in Table 6.
lower capacity factor is translated into lower electricity generated per year and this leads to a lower plant efficiency. Although there are variations in the heating value and carbon content
among the
three types of coal, the plant efficiency showed a low sensitivity to the type of coal in all three cases, with only a range of
0.2-0.7% differences between the three cases under investigation.
Ref. Plant CC Plant Oxy Plant
Fuel Net
MWe Plant Eff. Net MWe Plant Eff. Net MWe Plant Eff.
Wood Pellets 607.4 37.56 375a 26.44 470 30.20
Colombian Coal 616 39.78 404a 28.89 481 32.39
Russian Coal 614 39.48 426a 29.68 488 32.57
US Coal 615 39.81 414a 29.36 484 32.63
a : the Net electrical value does include the electricity required for the amine plant
Table 6- Net power output and net plant efficiency of the Ref, CC, and oxy plants for four different fuels. 0.00 5.00 10.00 15.00 20.00 25.00 30.00 35.00 40.00 45.00
WWP COC RUC USC
N e t P lan t E ff ic ie n cy , H H V %
Plant Fuel Type
Ref Plant
Amine Plant
Interestingly, the oxy-fuel plants with the four types of fuel showed a higher efficiency than the CCS plants, and the reason for that, the amine capture process and sorbent regeneration consume a large
part of the
electricity generated. The efficiency difference of the
Oxy and CCS
plants was the highest with the biomass fuel as of 14.2% increase, then the COC, USC and RUC as 12%, 11% and 9%, respectively. These results are in agreement with other research work performed by Catalonotti et al. 2013 [28] for coal-fuelled plants, and the Electricity Generation Model submitted to the Department of Energy and Climate Change [36]. Also, Dominichini et. al. (2011) [26] reached to a close plant efficiency of biomass-CCS case, i.e. 25.8% in comparison to 26.44% the corresponding case in this study. To the best knowledge of the authors, there is not enough data on performance comparison between post-capture and oxy-fuel technologies on biomass combustion in the literature till the present date.
7.2
Effect of CCS and Oxy-fuel on Carbon Emissions
The annual carbon emissions of 650 MW WWP, COC, RUC and USC plants without CCS technology, are 2.91M, 3.08M, 2.78M, and 2.95M tonne CO2 respectively. These results are commonly translated into emission factors as kg CO2e per unit of electricity produced. The CO2 emission factor for the net electricity is a function of fuel property and plant efficiency. The results are listed in Table 7.
Figure 1. Net Plant Efficiency of WWP, Colombian, Russian, and US coal fuels in the three study cases: Reference, CCS and Oxy-fuel plants.
Table 7- Carbon emissions in kg/kWh from WWP, COC, RUC and USC combustion plants. REF. Plant CC plant Oxy Plant
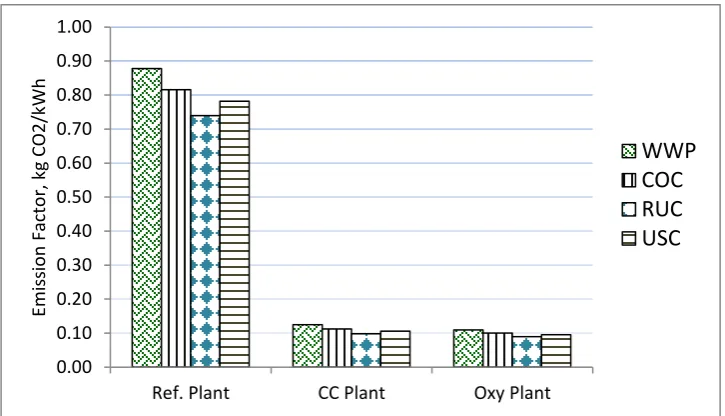
The actual emission factors for biomass and coal Ref-WWP, Ref-COC, Ref-RUC, and Ref-USC plants are 0.8775, 0.8156, 0.7392, and 0.7814 kg/kWh, respectively. However, the net specific emissions of dedicated biomass (WWP) are considered as zero regardless of the actual production [35, 3]. On the other hand, the emissions from the three coal plants are higher than the regulatory emission factor for electricity generation in the UK, that is 0.54418 kg CO2e/kWh [9]. When applying the CCS technologies on the four plants, the emissions are reduced by 85-90% with final ranges that meet the regulatory set values. The results illustrated in Fig. 2 shows slightly higher emissions for the CC plants than the emissions of Oxy plants. In the same time, the carbon removal from the CC plant is also higher than the Oxy plant for the same energy output. The reason for these differences is the higher fuel input used in the first rather than in the latter.
The carbon captured from the WWP plant is 3.2M and 2.5M tonnes per year for the CC and Oxy plants respectively. Considering the biomass as a neutral carbon emission fuel, these quantities can be considered negative emissions that contribute to the mitigation of GHG for the long term. The actual emission factors for biomass Ref-WWP, CC-WWP, and Oxy-WWP are 0.8775, 0.125, 0.109 kg/kWh, respectively. However, the net specific emissions of dedicated biomass (Ref-WWP) are considered zero regardless of the actual production [35, 3]. In addition, the utilization of carbon capture technologies with the biomass in the electricity generation
0.00 0.10 0.20 0.30 0.40 0.50 0.60 0.70 0.80 0.90 1.00
Ref. Plant CC Plant Oxy Plant
E m is si o n F ac to r, k g C O 2 /k W h
WWP
COC
RUC
USC
COC 0.8156 0.1123 0.1001
RUC 0.7392 0.0983 0.0894
USC 0.7814 0.1060 0.0952
[image:15.595.116.479.399.607.2]a: These are the measured emissions, however, biomass is considered a neutral carbon fuel.
industry in a 650 MW power plant can annually capture about 3.2M tonnes CO2 by post CCS and 2.5M tonnes by oxy-biomass combustion that are considered negative emissions. This assumption is further illustrated in Figure 3.
7.3
Capital Cost of Dedicated Biomass Plant vs. Coal Plants.
The capital required for WWP and the three types of coal used in the UK are calculated based on the plant description in the IECM with a capacity of 650 MW and for three cases investigated of Reference, Amine capture and Oxy-fuel plants. Table 8 shows the total capital investment for the reference, CC and oxy-fuel plants. It is found that without CCS, the capital required for the WWP plant is not significantly higher than the capital required for the three coal plants. Basically, the difference in the capital cost of WWP plant over the three coal plants is due to the assumption that the biomass plants are the first of a kind while the coal plants are Nth of a kind which is reflected in the depreciation and amortization costs of the plant equipment. However, the reason for these proximate results is due to the high capital required for pollutant removal units from the coal due to the high ash content compared to the wood biomass (see Table 2), especially the Russian coal.
[image:16.595.80.482.159.374.2]Figure 3. Annual Negative emissions of WWP, in comparison to positive emissions from coal fuels.
Table 8- Economic results of Ref, CC and Oxy plants for four different fuels.
Total Capital, £M Cost of Electricity, £/kWh
Fuel type REF. CC Oxy REF. CC Oxy
WWP 736 1151 1257 108.88 203.95 192.20
COC 683 1065 1202 59.47 97.69 103.62
RUC 707 1072 1198 61.60 86.88 104.81
-3,500,000 -3,000,000 -2,500,000 -2,000,000 -1,500,000 -1,000,000 -500,000 0 500,000 1,000,000
WWP
COC
RUC
USC
A
n
n
u
al
C
O
2
E
m
is
si
o
n
s,
t
/y
r
CC Plant
[image:16.595.65.496.679.773.2]Fig. 4 shows the results obtained for the capital required for the base plant and main pollutants removal units in three cases of Reference, CCS and Oxy-fuel plants with the four types of fuels.
When applying CCS and Oxy-fuel
technologies, the overall capital cost of all plants have
increased
by 40-50% from the reference plants. And the capital cost of the CO2 control is approximately the same for WWP and the three types of coal.A comparison of the two carbon capture technologies shows that, the capital cost of oxy-fuel process is around 10% higher than post-combustion CCS with amine plant for the same 90% CO2 removal and a 99% pure gas to be compressed for storage. The reason for this difference is the cost of the air separation unit and flue gas recycling equipment and piping that are approximately 1.5 times higher than the amine plant equipment costs [27]. On the contrary, the base plant and SOx removal costs are higher for the CCS plant than the same costs in the Oxy-fuel plants, due to the smaller flue gas flow in the oxy-fuel resulting a smaller unit size and completely different separation process of sulphur when removed after gas recycling. The same conclusions were reached by Rubin et al. (2007) and Catalonotti et al. (2013) [19, 28].
0 200 400 600 800 1000 1200 1400
C
ap
ita
l
C
o
st,
M£
Cool Tower CO2 SO2 TSP Mercury Post-Com NOx Comb NOx Base plant
7.4
Cost of Electricity (COE)
The levelised cost of electricity (COE, £.MW-1.h-1) is calculated by the IECM, from the total levelised annual cost (TLAC, £M.yr-1) which is dependent on the capital required as well as the operational and maintenance costs, divided by the total number of working hours and the net electrical output [23], namely
where: TLAC is the total Annual Levelised Cost, £.MW-1.h-1
(that is the sum of the total annual O&M cost and annualized capital cost).
As a result, the plant with the higher capital required is predicted to have a higher levelised COE which is in this case the oxy-fuel plants. As shown in Table 8, the COE of the Oxy-coal plants are higher than the COE of the CCS plants by 20 £.MW-1.h-1 for the CO, RU, and US coal types, respectively. In contrast, the WWP fuel showed a lower value of COE in the oxy-fuel plant than the COE of the CCS plant by a difference 11.75 £.MW-1.h-1. This contradiction in the results is attributed to the second factor of TLAC, i.e. the variable operating cost component, which was higher in the amine plant than the oxy-WWP plant that dominated the opposite effect of the capital cost. The variable operation cost is mainly dependent on the fuel cost that is higher in the amine plant as more fuel is required to overcome the energy loss within the carbon capture process. In addition, the cost of the emissions control (SO2, CO2, and NOx) are consequently higher in the CCS plant than in the Oxy-fuel plant. Fig. 5 illustrates the COE as a function of plant and fuel types.
0.00 50.00 100.00 150.00 200.00 250.00
WWP CO PC RU PC US PC
C
O
E
,
£
/MW
h
Ref. Plant
CC Plant
Oxy Plant
in the three study cases: Reference, CCS and Oxy-fuel plants.
(1)
[image:18.595.117.477.499.718.2]7.5
Cost of CO
2Avoided & Cost of CO
2Captured
The cost of CO2 avoided (£.MW-1.h-1) is one of the common economic measures of the CCS plants [23, 28, 29]. It denotes the cost of avoiding or removing a ton of atmospheric CO2 emission while producing one MWh of electricity [23].
where:
COE: cost of electricity generation (£.MW-1.h-1),
tCO2/MWh : CO2 mass emission rate to the atmosphere.
Meanwhile, the cost of CO2 captured is another cost measure for a certain capture technology and plant type [23]. This measure is used to evaluate the economic sustainability of a CO2 capture system relative to a market price for CO2 as an industrial commodity. For an electric power plant it can be defined as follows:
where:
(tCO2/MWh)captured = total mass of CO2 captured per net MWh for the plant with capture (equal to CO2 produced minus emitted).
It is imperative to distinguish between the cost of CO2 avoidance and the cost of CO2 capture, as many readers may mistake one for the other. The cost of CO2 captured excludes the costs of CO2 transport and storage since the purpose of this measure is only to calculate the cost of the capturing process. Hence, the cost of CO2 captured is always lower than the cost of CO2 avoided. The cost of carbon capture and cost of carbon capture values for all fuels are listed in Table 9.
The three types of coal exhibited a slight variation in the cost of CO2 avoided. However, the oxy plants showed higher costs than the amine capture plants in terms of CO2 cost of avoidance corresponding to the same trend of capital costs and COE in the three coal plants. The CC plant with the US coal has the lowest cost of CO2 avoided, i.e. 34.34 £.tonne-1, then the Russian and Colombian coal at 37.70 £.tonne-1 and 52.56 £.tonne-1,respectively. While the Oxy-COC, Oxy-RUC, and Oxy-USC has 60.06 £.tonne-1, 64.87 £.tonne-1, and 60.83 £.tonne-1, respectively. These results are in agreement with the conclusions represented by Berghout et. al. 2013 [24], as they found that the costs of CO2 avoided for three different plant types were lower for the post-capture than the oxy-fuel process, especially in the long term which is similar to the case of our study.
(2)
As mentioned in section 3, the IECM does not include the option of biomass fuels in the combustion plant model. Thus, the fact that BECCS can produce a negative emission process is not translated here in the calculations of the cost of CO2 avoided and cost of CO2 captured. The model treats the biomass as the coal fuels and calculates the costs similarly. As expected, the results showed higher costs of CO2 avoidance in plants with WWP than the costs of the three coal-fuelled plants in both cases of oxy and amine capture technologies. This is due to the higher COE of WWP plants. However, the CC-WWP plant has a higher cost than the Oxy-WWP plant, while the CC-Coal plants of the three coal fuels have lower costs than the Oxy-coal plants. This opposite trends are attributed to the higher COE and higher tonnes of CO2 emitted from the CC-WWP plant against the Oxy-WWP plant. In the same manner, the cost of CO2 capture is also higher for WWP plants than for coal plants, and these results are shown in Figure (6).
[image:20.595.63.508.116.229.2]In spite of the above results, an argument can be raised about the concept of the cost of CO2 avoidance for any biomass plant and in this case the WWP plant. The argument is about considering the biomass as a neutral CO2 fuel. Then, one can say, the CO2 produced in the biomass plant should have zero value. In this case, the cost of CO2avoided in Equation (2) does not apply to biomass fuels. The cost of CO2 captured has a different meaning than the term for other types of fuel. As mentioned in section 7.2 that the carbon captured is actually considered as negative emissions, Equation (3) can be used to express the cost of negative emissions of BECCS as the following :
Table 9- Cost of carbon capture, avoidance and negative emissions (in case of WWP).
WWP COC RUC USC
CC Oxy CC Oxy CC Oxy CC Oxy Cost of CO2 avoidance,
�CO 124.75 105.34 52.56 60.06 37.70 64.87 34.34 60.83 Cost of CO2 Capture,
�CO 67.24 65.70 19.82 30.80 23.62 35.42 20.81 31.79
Amine (Av) Oxy (Av) Amine (Ca) Oxy (Ca)
Co
st,
£/
ton
ne
C
O2
20 40 60 80 100 120
140 WWP
COC RUC USC
7.6
Biomass Fuel Cost Variability
Investing in WWP versus coal in the combustion power plants for electricity generation is influenced by the WWP price as the main cost-effectiveness factor that the power plant companies should consider [62]. With the current coal prices (1.7 – 2.9 £ GJ-1) and WWP price with 5 times higher (10.2 £.GJ-1) , the breach is too high (see Table 1). Thus, an outlook at how low the WWP prices could thriftily sustain the BECCS deployment in the power generation industry is presented in this section.
Figure 7 shows the current prices of coal and WWP as received at the UK power plants; 53 £.tonne-1 and 189.9 £.tonne-1 represented by black and green lines with stars on the x-axis. The horizontal lines represent the COE of the coal plant cases at Ref, Amine and Oxy plants respectively.
For the WWP reference plant given in Table 3, the breakeven WWP price is 108 £.tonne-1, while applying the carbon capture technologies requires more reduction in the fuel price to reach the breakeven price at approximately 65 £.tonne-1, and 69 £.tonne-1 for CCS and Oxy plants respectively. Also, the CCS technologies showed more variation at higher WWP prices, the higher fuel price the less COE can be gained from the Oxy plant than the CCS plant.
Figure 6. Cost of CO2 avoided and cost of CO2 captured in two CC technologies; amine capture
[image:21.595.87.508.71.322.2]7.7
Coal Cost Variability
[image:22.595.124.478.82.290.2]A second scenario could booster the viability of BECCS in the near future and that is the potential increase in coal prices. As mentioned in Section 6, the projected coal prices for the next 15 years fall into three scenarios, low, central and high. Those projections are reflected on the COE variance with the WWP prices to predict the breakeven price of the fuel at the power plants. The vertical long dash-dot lines in Figure 8 represent the low, central and high projected prices of coal in 2030. The horizontal dashed lines represent the breakeven price of WWP in the case of the Reference plant without CCS. The low coal price scenario is discussed in the previous section. At the central and high price scenarios, the breakeven WWP price is 120 £.tonne-1 and 130 £.tonne-1 respectively, that is higher by £47 and £32 than the coal prices. The results of Figure 8 are listed in Table 10.
Figure 7. Breakeven WWP prices to facilitate BECCS deployment at coal power generation plants.
0 20 40 60 80 100 120 140 160 180 200 220
0 50 100 150 200 250
COE, £/M
Wh
Fuel price, £/tonne
0 50 100 150 200 50
100 150 200
High coal price Scen Central coal price Scen Ref Plant (US PC) Oxy Plant (US PC) Amine Plant (WWP) Amine Plant (US PC) Ref Plant (WWP) Oxy Plant (WWP)
Fuel Price, £/tonne
COE, £/M
Wh
Low coal price Scen
The application of CCS technologies on coal and biomass reduces the gap between the two fuel prices at the breakeven point, especially at the high price scenario in which the fuel prices at the Oxy plants have the same value at £98, while the CCS (amine) plant will have a breakeven WWP price at £85. In the central scenario, the breakeven price is 85 and 78 £.tonne-1 for oxy-WWP and CCS plants respectively.
7.8
Effect of Renewable Obligation Certificate (ROC) on COE
The Renewable Obligation Certificate (ROC) is the main current financial support scheme for renewable
electricity in the UK [42]. The current value of ROC is equal to 42.02 £.MWh-1 for electricity generation
[10] burning 100% biomass.
In this section, the effect of multiplying the ROC by 1, 2, and 3 times on the COE is examined. From
Fig. 9 it can be shown that deploying biomass (WWP) in power plants without CCS can only compete
the conventional coal power plants when the ROC subsidy is multiplied 3.7 times the current value to
become 155.5 £.MWh-1. In comparison with the coal-CCS plants, the dedicated biomass compete the
COE of coal with a lower subsidy that is 2.7 and 1.8 ROC for the amine and Oxy-fuel plants
[image:23.595.112.478.72.292.2]respectively.
[image:23.595.68.502.470.543.2]Figure 8. Breakeven WWP prices at low, central and high coal prices scenarios in 2030 at power generation plants.
Table 10- Breakeven prices of WWP in response to different scenarios of projected coal prices.
Low Scenario (Coal price
=55.2 £/tonne
Central Scenario (Coal
price =73 £/tonne
High Scenario (Coal
price =98.5 £/tonne
Ref. CC Oxy Ref. CC Oxy Ref. CC Oxy
On the other hand, the WWP-CCS plants with the current fuel price is extremely far from the
competition with the coal prices even with 4 times ROC value.
1.0 1.5 2.0 2.5 3.0 3.5 4.0
40 60 80 100 120 140 160 180 200 220 240
COE, £/M
Wh
Number of RO applied
Reference Amine Plant Oxy Plant PC Ref PC Amine Oxy-coal
COE of Oxy COE of CCS
COE of Ref
7.9
Effect of Carbon Price on COE
Currently, the UK government has set a fixed limit of carbon price on power generation from coal combustion plants as 9.55 £ per tCO2e [10]. However, increasing the carbon tax will drive the power companies to deploy renewable alternatives such as wood pellets. In this scenario, the sensitivity of COE with carbon tax is examined assuming an increase in the carbon tax from the current value to 2, 3, 4, 5,…10 times increases.
Figure 10 shows the plant levelised COE as a function of the carbon price units added to the coal plant taxes per one MWh produced. The resulting carbon breakeven price is 6.7 times the current value that is approximately 64 £.tonne-1 CO2. However, the increase of COE with carbon price will tend to increase the electricity bills for the consumers, and that makes this scenario likely to be undesirable at present. Rhodes (2005) [5] has reached to a £10 higher breakeven carbon price (123 $.tonne-1 CO2 = 73 £.tonne-1 CO2), and this is due to the different biomass fuel used and the fuel prices at that time.
[image:24.595.131.461.115.323.2]On the other hand, if the carbon price is used as a reward to the negative carbon emissions of BECCS, it will become an important incentive for the commercialization of the BECCS. Therefore, the negative emissions calculated in this study are costed with the same price of carbon emissions and deducted from the annual costs, as a showcase of increasing CO2 price can result in a reasonable breakeven COE between coal-CCS plants and the BECCS plants. Figure 11 shows the impact of the negative emissions incentive on the breakeven COE of Oxy-Coal and CC-Oxy-Coal with both Oxy-WWP and CC-WWP at values of COE 121 £/MWh and 64.62 £/MWh, for a 72 £/tonne, and 124 £/tonne CO2 captured prices, respectively. Obviously, the Oxy-WWP plant needs much lower incentives to compete with the Oxy-Coal plant.
0.00 50.00 100.00 150.00 200.00 250.00
C
O
E
,
£
/M
W
h
Negative Emmissions Incentive
CCS-WWP Plant
Oxy-WWP Plant
CC-USC Plant
[image:25.595.91.488.81.295.2]Oxy-USC Plant Figure 10. Breakeven carbon price of coal power generation plants in respect to the COE of WWP
power plants.
Figure 11 Sensitivity of COE of BECCS with Oxy-Coal and CC-Coal plants for the negative emissions incentive of BECCS.
0 2 4 6 8 10
60 80 100 120 140 160 180 200 220 240
COE, £/M
Wh
[image:25.595.64.531.509.735.2]
![Table 2- Fuel Properties and cost per tonne [34, 44-48].](https://thumb-us.123doks.com/thumbv2/123dok_us/7865434.180956/8.595.67.503.237.514/table-fuel-properties-and-cost-per-tonne.webp)