User Acceptance of M-Government Services in Saudi Arabia: an SEM Approach
Sultan Alotaibi, Dr Dmitri Roussinov
University of Strathclyde, Department of Computer and Information Science, Glasgow, United Kingdom
sultan.alotaibi@strath.ac.uk dmitri.roussinov@strath.ac.uk
Abstract: In spite of many benefits normally attributed to the use of e-government and its more recent variety mobile (m-) government, there are still many obstacles reported facing the acceptance of both, especially in developing countries. We explore the situation in one of them, namely Saudi Arabia, aiming to study factors affecting citizens’ acceptance of m-government. We tailor a new conceptual model for m-government acceptance by citizens based on Technology Acceptance Model (TAM) and specifically consider important factors such as perceived service quality, perceived trust, user satisfaction and perceived mobility. We also tailor measuring those factors to account for the specifics of the new mobile aspect in the existing theories and carry out a large scale survey (695 analysed respondents from King Saud University and Immam Muhammed Bin Saud University) followed by quantitative analysis involving structural equation modelling. Our results support most of the anticipated relationships between the factors and acceptance, and will help policy makers and developers of e-government systems to increase citizen’s acceptance.
Keywords: e-government, m-government, acceptance, model. 1. Introduction
Mobile technology is not only affecting the way of running businesses, but also the way how governments are providing their services to the public (Sharma and Gupta, 2004). Hence, government services are being transitioned from e-government to m-government (Lallana, 2004). M-government can be defined as the strategy and its implementation for providing information and services to government employees, citizens, businesses and other organizations via mobile devices (Ishmatova and Obi, 2009; Lee et al. 2005; Lee et al. 2006). Whilst m-government is seen by some researchers as a subset of e-government (Lallana 2004) as both of them are founded on the same principles, other researchers consider it complementary to e-government.
The Saudi government has adopted the mobile services as many other countries have. This service has been applied in offering governmental services to the citizens and other stake holders through the use of electronic devices (Alsenaidy and Ahmed, 2012). Saudi Arabia has been chosen for the study since it is particular case of a developing country, and for convenience considerations since the author of this paper is from and is sponsored by that country. The Saudi Arabian government has decided to adopt m-government services for the similar reasons as the developed countries did (Babullah et al. 2015). It was also since the Saudi government was experiencing especially high growth rate of internet users as compared to few years that has passed (Babullah et al. 2015). The number of internet users has been on the rise as compared to the number of mobile line users since 2005. According to a research that was conducted by United Nations Conference on Trade and Development UNCTADS in 2012, indicated that Saudi Arabia had a higher population of citizens who were more dependent on mobile phones in the world, 1800 mobiles were equivalent to 1000 people in Saudi Arabia, (Babullah et al. 2015; Alsenaidy and Ahmed, 2012). Lack of doing research was the major cause of slow adoption of the m-government services in Saudi Arabia government, this led to poor understanding of the factors that may be of importance, (Babullah et al. 2015; Dwivedi and Irani, 2009). According to Babullah et al (2015) mentioned that “it has been argued that using m-government in Saudi Arabia is not common because Saudi citizens have not used it frequently”.
The aim of the current work is to study factors affecting the acceptance of m-government in Saudi Arabia. This study should provide a conceptual model for m-government acceptance by citizens. The developed model is based on Technology Acceptance Model (TAM) and explores several factors within m-government. Based on the SEM analysis, this paper is concluded that some relationships were acceptable in this context, while others were not.
present our study which was conducted by distributing the survey to the participants. Finally, we present our conclusions, discuss limitations and future work.
2. Prior Research and Theoretical Background 2.1 M-government
M-government services refer to government services that are provided via mobile devices (Kumar and Sinha, 2007). Many models exist in m-government, mainly government-to-government, government-to-business, government-to-citizens, and government-to-employees (Ndou, 2004). M-government provides government employees and citizens with information and services via their mobile devices (Lee et al. 2006). Citizens are normally interested in using their mobile devices to access government services instead of visiting government offices (Ndou, 2004).
2.2 Prior Work
Two main streams of research studying m-government adoption can be identified in the existing literature: 1) supply-side and 2) demand-side (Sultana et al, 2016). The supply-side stream focuses on studying the challenges facing m-government implantation from point of view of the government, either locally or nationally (e.g. Lai and Chuah, 2010; Brosnan, 2005). Examples of these challenges are IT infrastructure, financial resources, skilled personnel and resistance to change. The demand-side stream focuses on m-government adoption from point-of-view of the demand (e.g., Wang et al., 2012; Hung et al., 2013), which is studying the factors affecting citizens’ adoption and use of m-government services (Sultana et al, 2016) such as trust, culture, perceived usefulness, perceived ease of use, experience and attitude. There are very few studies concentrated on the demand-side perspective (Wang et al., 2012; Hung et al., 2013). Therefore, this study has emerged to fill in that gap, by studying the citizen’s acceptance of m-government, more particularly on the demand-side.
Despite the local and national government’s investments and efforts to provide the public with e/m-services, there is a minimal service uptake by the people (Wang, 2003; Wang, 2014; Liu et al, 2014; Abdelghaffar and Magdy, 2012; Reddick, 2014; Kumar et al., 2007; Osman, 2013; Choudrie and Dwivedi, 2005; Mamte et, al., 2013; Wadie and Hasan, 2015; Carter and Belanger, 2004; Liang and Lu, 2013; Ahmad, 2015; Belanger and Carter, 2008). The citizens prefer traditional methods in accessing government services including in-person visits (Belanger and Carter, 2008; Abdelghaffar and Magdy, 2012; Ahmad, 2015). The implication of this is that there is a low rate of electronic or mobile government adoption (Liu et al., 2014; Wang, 2014).For example, the survey conducted by Ohme (2014) among 517 participants in Germany, revealed that only 35% of the participants were aware mobile government service. There is still low to moderate uptake of G2C m-government services information in several developing countries. For instance, in Egypt, there is low level of adoption of mobile government services, because Abdelghaffar and Magdy in (2012) found that 23% of their sample use m-government services. Also, the survey conducted by Liu et al. in (2014) in China, revealed that only 31% of the participants were aware mobile government service.
The above discussion clearly indicates there is a need to conduct further studies on the acceptance of G2C mobile government systems because of the low rate of citizen acceptance of mobile government services and information. The main aim of this research is to help government to come up with appropriate strategic action for meeting the needs of its citizens after understanding the factors that influence citizen acceptance of mobile government services.
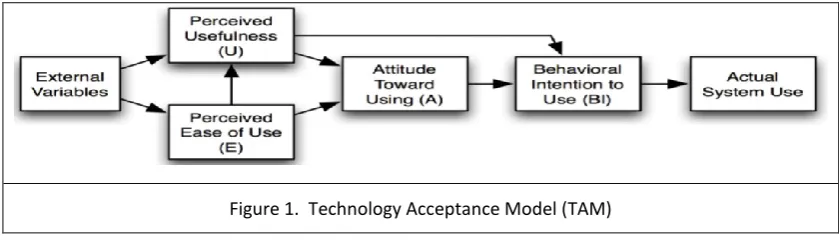
2.2.1 Technology Acceptance Model (TAM)
individual attitude toward using technology effectively in his daily life; actual use (AU) - refers to the frequency, time, and money that are being invested by an individual to use technology.
[image:3.595.87.507.306.426.2]In addition to TAM, there are many other models that have been developed to evaluate user intention regarding the acceptance and use of new technology. The main models are TPB (Theory of Planned Behavior) (Ajzen, 1991), IDT (Innovation Diffusion Model) (Rogers, 2010), UTAUT (Unified Theory of Acceptance and Use of Technology) (Venkatesh et al. 2010). Also, several studies have extended TAM model to include new constructs (Deng et al. 2008; Gao et al. 2010; Azam et al. 2010; Susanto and Goodwin, 2010; Shih, 2004). TAM was extended by Gao et al. (2010) by considering trust, personal initiatives and characteristics in order to explore the determinants of acceptance of users of mobile services. Trust was found to be the most important determinant in their study. In another study focusing on SMS-based e-government services (Susanto and Goodwin, 2010), other factors were found to be the most influencing elements, especially PEOU, PU, time, distance, value for money, perceived convenience, and availability of device and infrastructure. From another side, experience was found to be influencing PEOU, PU, BI and usage behavior (Aza et al. 2010), as well as influencing PU through PEOU. After carefully reviewing the literature about e-government and m-government in Saudi Arabia, we have observed the following :1) E-government acceptance in Saudi Arabia has not been yet sufficiently covered (Baabdullah, 2013); 2) M-government services acceptance and use in Saudi Arabia have not sufficiently studied (Baabdullah, 2013). Therefore, the aim of the current work is to study factors affecting the acceptance of m-government in Saudi Arabia.
Figure 1. Technology Acceptance Model (TAM)
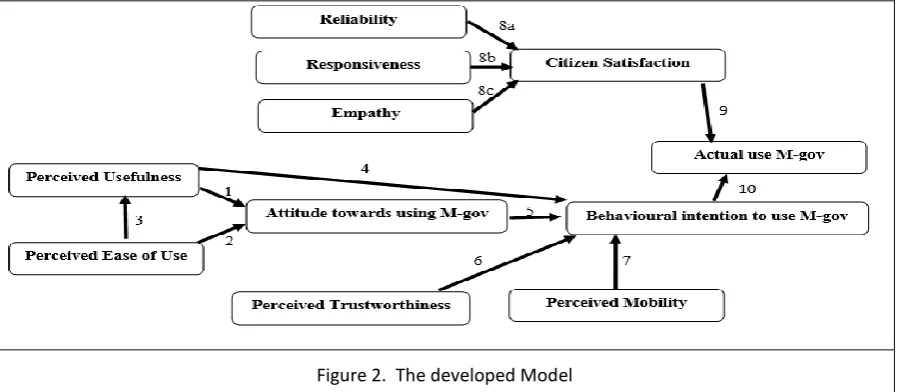
3. The developed Model
We have extended TAM with four new constructs: perceived mobility, perceived service quality, user satisfaction, and trust. The new TAM model constructs are shown in Figure 2, and explained in the following sections.
3.1 Perceived Usefulness (PU)
As described previously, PU refers to user’s perception about the advantages that he/she might gain when uses a specific system, which should encourage to continue using it (Davis et al. 1989). In this study, PU corresponds to the degree to which the users believe that m-government services positively affect their lives. The ubiquity of m-government services (i.e. possibility to access these services anytime and from anywhere) is the main aspect that makes users believe in the benefits of such services. Once the users are aware of the usefulness of m-government services, their attitude towards using these services is affected. Hence the following hypothesis can be formulated:
H1: User’s attitude towards using m-government services is influenced by PU.
H4: User’s intention to use m-government services is influenced by PU.
3.2 Perceived Ease of Use (PEOU)
This construct is considered as another main construct of TAM model that has effect on user intention to use the technology (Davis et al. 1989). In the current study PEOU corresponds to the degree to which users believe that m-government services will be easy to use and will be effortless. Once the users are aware about the ease to use of these services their attitude towards using them changes, as expressed in the following hypothesis:
H3: PEOU has a positive impact on PU.
3.3 Attitude towards Using (AT)
This construct is considered an antecedent to intention to adopt a specific service (Davis et al. 1989), which leads to make the following hypothesis:
H5: Attitude towards using m-government services has a positive effect on the intention to use these services.
3.4 Perceived Mobility
Mobility of a device refers to the feature of dealing with information provided by this device whilst in state of mobility (Hung et al. 2013). The mobility of m-government services means that they can be used independently from time, location, and without wired network (Hung et al. 2013). This important characteristic of m-government services makes them very useful when the user needs them whilst being far from home or office. Hence, this will increase the user’s intention to use mobile government services (Hung et al. 2013). Perceived mobility is defined as the degree to which mobile technology can affect potential benefits to the user, such as communication, access to information and services, as well as their availability anytime and anywhere. Although more work is required to show the effect of mobility on IS adoption, many IS studies have considered mobility as an essential factor affecting user’s intention to use mobile services. Hence the following hypothesis can be formulated:
H7: User perceived mobility has affected the intention to use mobile government services.
3.5 Perceived Trustworthiness
This construct refers to user’s trust in a specific system. This is an important factor that should be considered in systems that include a degree of risk like ubiquitous environments (Zarmpou, 2012) and e-government environment (Alhujran and Migdadi, 2013). Hence, the acceptance of m-government services by users is linked to their trustworthiness in such services, as well as to the trustworthiness in the delivery channel used by these services. Therefore, user trust can be seen as a predictor of m-government services acceptance, as expressed in the following hypothesis:
H6: Trust has a positive effect on user intention to use m-government services.
3.6 Perceived Service Quality
Service quality is defined as the discrepancy between user perceptions and expectations regarding a specific service. This factor relies on understanding user needs, as well as on the adaptation of the services to these needs. Service quality was evaluated in many studies (Horan et al. 2006; Parasuraman et al 2002). SERVQUAL is an evaluation which was developed and widely used to evaluate customers’ perception of service quality. SERVQUAL scale uses five dimensions to evaluate service quality: tangibles, assurance, responsiveness, reliability, and empathy (Parasuraman et al. 2002). However, only responsiveness, reliability, and empathy were used to evaluate e-government services in (Alhujran et a.l 2013), and to evaluate m-government services in the current study. These three dimensions are defined as following: responsiveness refers to the user perception about the service provider, and his responsiveness and help; reliability refers to the accuracy and dependability of provided services; empathy refers to the interest and concern that the service provider shows to his customers. Service quality is linked to its usability; therefore it affects user satisfaction. This is expressed in the following hypothesizes:
H8b: perceived responsiveness has a positive effect on user satisfaction.
H8a: perceived reliability has a positive effect on user satisfaction.
H8c: perceived empathy has a positive effect on user satisfaction.
This factor is considered an important factor that will affect long-term usage of a given system (Wixom and Todd, 2005). User satisfaction is defined as the perception of a pleasant fulfilment of a given service (Wixom and Todd 2005). Similarly to previous factors, user satisfaction is an important factor in m-government services use, and is linked to user needs and perception (Ives et al. 1983). Some studies have linked user satisfaction to technology acceptance (Ovier, 1999). Hence the following hypothesis is suggested:
H9: User satisfaction has a positive impact on actual use of m-government services.
3.8 Behavioral Intention to Use (IN)
This construct of TAM model was extended by Davis et al. (1989) to include intention to use the technology. It was also extended by Nysveen et al. (2005) to consider the context of mobile services. The intention to use m-government services is related to the acceptance of these services, as expressed in the following hypothesis:
[image:5.595.75.524.251.447.2]H10: Intention to use m-government services has a positive effect on the actual use of these services.
Figure 2. The developed Model
4. Methodology
4.1 Data Collection
The data of this study has been collected from 800 respondents from King Saud University and Immam Muhammed Bin Saud in Riyadh in Saudi Arabia. The participants include students, academic staff, and administrative staff. Each of these participants was asked to complete a questionnaire. One hundred and five (105) of them were rejected due to missing answers. The remaining 695 questionnaires were analysed using SPSS and AMOS 24 software package.
4.2 Questionnaire Development
The measurements in this study were based on previous research studies. Hence, measuring TAM original constructs (PU, POEU, ATT, IU and actual use) was based on items that were adapted from Davis et al. (1989). The scale used to measure perceived trustworthiness was based on items from Colesca (2009). Perceived mobility was measured using a scale based on items from (Hong et al. 2008). Finally, the scale that was used to measure service quality was based on items from Alhujran et al. (2013) and Parasuraman et al. (2002). Measuring the items was based on five-point-Likert-type scale ranging from “strong agree” to “strongly disagree”.
In order to process the collected data, statistical analysis of quantitative data proposed by Hair et al. (2003) was adopted, which consists of two steps: 1) descriptive statistics, and 2) structural equation modelling.
5.1 Descriptive Statistics
This is used to have a description of features of a sample data set. Therefore, the sample consists of 62.9% (437) males and 37.1 % (258) of females. Nearly 43.5 % (302) of sample are in the age group of 18-20 years. This is followed by 29.6 % (206) in the age group of 21-23 years. The other age groups are also considerably represented in the sample. Also, it is seen that nearly 56.9 % (416) of sample belongs to the ‘High school’ level, followed by Undergraduate degree (23%). The other specializations also have due representation in the sample. Thus, the sample is representative with respect to Level of education of the respondents
5.2 Structural Equation Modelling
Our sample data was analyzed using Structural Equation Modelling (SEM) with AMOS 24 software package. Two steps of SEM were used: 1) measurement model, and 2) structural model including hypothesis testing (Hair et al. 2003).
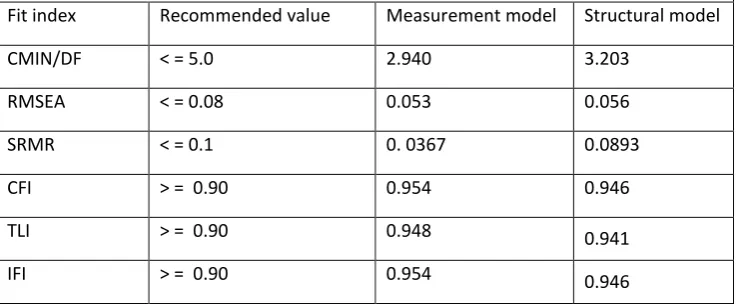
In order to decide whether the set of causal relationships are well represented by the model, measurement and structural models are assessed by an overall model fit, or more specifically the goodness-of-fit measures. The two types of the goodness-of-fit measures (Hair et al. 2006) have been selected and used in this study to evaluate the measurement model and structural model:1) three absolute fit measures 2) three incremental fit measures.
[image:6.595.115.485.465.618.2]In the first step, The Measurement Model Test , CMIN/DF, CFI , TLI , IFI, RMSEA and SRMR showed acceptable fits of measures (RMSEA=.053, SRMR=.0367, CMIN/DF= 2.940, CFI=0.954 , TLI=0.948 and IFI=0.954). In second step, The Structural Model Test , CMIN/DF, CFI , TLI , IFI, RMSEA and SRMR showed acceptable fits of measures (RMSEA=.056, SRMR=.0893, CMIN/DF= 3.203, CFI=0.946 , TLI=0.941 and IFI=0.946) as shown in Table 1.
Table 1. Overall fit indices of measurement and structural model with all constructs
Fit index Recommended value Measurement model Structural model
CMIN/DF < = 5.0 2.940 3.203
RMSEA < = 0.08 0.053 0.056
SRMR < = 0.1 0. 0367 0.0893
CFI > = 0.90 0.954 0.946
TLI > = 0.90 0.948 0.941
IFI > = 0.90 0.954 0.946
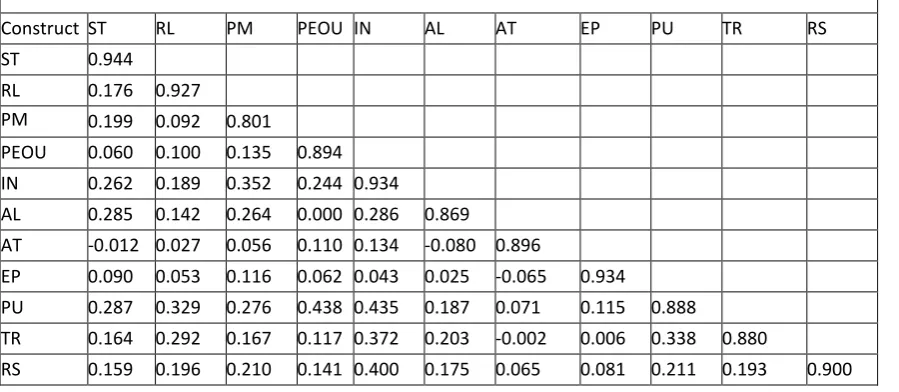
5.2.1 Discriminant Validity
Table2. Discriminant validity of all constructs in the research model
Construct ST RL PM PEOU IN AL AT EP PU TR RS
ST 0.944
RL 0.176 0.927
PM 0.199 0.092 0.801
PEOU 0.060 0.100 0.135 0.894 IN 0.262 0.189 0.352 0.244 0.934
AL 0.285 0.142 0.264 0.000 0.286 0.869
AT -0.012 0.027 0.056 0.110 0.134 -0.080 0.896
EP 0.090 0.053 0.116 0.062 0.043 0.025 -0.065 0.934
PU 0.287 0.329 0.276 0.438 0.435 0.187 0.071 0.115 0.888
TR 0.164 0.292 0.167 0.117 0.372 0.203 -0.002 0.006 0.338 0.880
RS 0.159 0.196 0.210 0.141 0.400 0.175 0.065 0.081 0.211 0.193 0.900
5.2.2 Reliability Analysis
[image:7.595.80.520.63.268.2]This is defined as “an assessment of the degree of consistency between multiple measurements of a variable” (Hair et al. 2006). Therefore, reliability of the scales can be tested by using composite reliability for each of the factors in the research model, the acceptable value for composite reliability should exceed 0.70 (Bagozzi and Yi 1988). This can be calculated through the formula suggested by Fornell and Larcker (1981). Table 3 shows that all factors exhibit a strong level of reliability. The results are higher than the suggested level of 0.70 scoring from 0.875 to 0.965 (Hair et al. 2006).
Table 3. Composite reliabilities for all constructs within the measurement model
The Factor Composite
Reliability
The Factor Composite
Reliability
Perceived Usefulness 0.937 Perceived Trustworthiness 0.932
Perceived Ease of Use 0.941 Reliability 0.960
Attitude towards using 0.942 Responsiveness 0.927
intention to use 0.965 Empathy 0.964
Citizen Satisfaction 0.970 Actual use 0.924
Perceived Mobility 0.875
5.2.3 The Structural Model
Hypothesis testing requires the development of a structural model with all the eleven factors that were assessed in the measurement model. Accordingly, the hypothesized relationships were formulated between these constructs and the results of running the structural model shows path loadings, critical ratios (C.R.).
[image:7.595.78.528.72.268.2]Table 4. Path loadings and critical ratios within constructs in the structural model (***=significance at the 0.001 level, **=significance at the 0.01 level and *=significance at the 0.05 level)
Structural Relation Regression
Weights
Standard Error (S.E.)
Critical Ratio (C.R.)
P value
Perceived Usefulness Perceived Ease of Use 0.421 0.036 11.696 ***
Attitude towards using Perceived Usefulness 0.031 0.050 0.614 0.539
Attitude towards using Perceived Ease of Use 0.107 0.048 2.217 *
Citizen Satisfaction Reliability 0.118 0.031 3.841 ***
Citizen Satisfaction Responsiveness 0.118 0.038 3.112 **
intention to use Attitude towards using 0.081 0.026 3.125 **
Intention to use Perceived Trustworthiness 0.200 0.028 7.146 ***
Intention to use Perceived Usefulness 0.260 0.030 8.524 ***
Intention to use Perceived Mobility 0.285 0.042 6.719 ***
Citizen Satisfaction Empathy 0.069 0.036 1.902 0.057
Actual use Citizen Satisfaction 0.250 0.041 6.137 ***
Actual use Intention to use 0.268 0.045 5.996 ***
6. Implications and Recommendations
This study has several implications. First of all, M-government is regarded as a solution to overcome the digital divide which is commonly present in developing countries. Therefore, studying the acceptance of using M-government is very important for many parties such as academics, practitioners, and market researchers. Second, in many countries, government services are offered to citizens in a way competing against their private counterparts, particularly in healthcare, telecommunication, and transport. Moreover, market researchers can benefit from analyzing citizens’ behavior for adopting M-government.
This study can lead to many recommendations for policy makers: 1) policy makers should make government services more accessible, easy to use, simple and understandable, especially for MG services; 2) in order to reduce the digital divide between privileged and unprivileged groups, the government should introduce ICT based education programs for citizens as an early age and that should be in university level such as King Saud University and Imam Muhammed Bin Saud University; 3) it is very important that the announced policies for MG services match exactly what is being provided to citizens, in order to gain their trust; 4) it is vital that service providers develop efficient and caring citizens’ service management in order to enhance the usability of their system. 5) Benefiting from m-government services may require extra spending from citizens on wireless connections. This extra spending is not always affordable by citizens, especially in rural areas. Therefore, policy makers should reduce acquisition costs to make the services accessible for the majority of people. 6) Other user groups, which were not discussed in this study, should be considered by government and policy makers. For instance, people suffering from blindness, deafness, severe vision or hearing impairments, etc. Moreover, with the ageing of the population the proportion of senior users increases. These user groups should be provided with specific options in mobiles services, such as alternative texts for images and audio guides, web pages without blinking text, etc.
7. Conclusion
We believe that the developed model will provide more knowledge to the fields of m-Government and technology acceptance in general. Our study will help the decision makers in m-Government projects, and the mobile service providers to successfully interact with each other. The main keys that were found to be affecting the level of acceptance of m-government services in Saudi Arabia are: trust, mobility, service quality, and user satisfaction, ease of use, usefulness and intention to use.
There are certain limitations for the findings of this study: It might not be applicable to countries having a low rate of mobile phone use. Also, the existing differences between various mobile devices used (e.g. smart phones, tablets, etc.), in terms of displaying the information may affect our findings. This paper has focused on the primary type of e-government, which is G2C (government to citizens) and did not specifically look into the other types of M-government (government to business G2B and government to government G2G). Our paper used the data collected in Saudi Arabia, but we believe the results are generalizable to other developing, and particularly Arabic countries. The developed model used in this paper, is based on TAM, a model originally developed to study of the acceptance on the technologies within Western society, and later validated in many different cultures around the world. Our survey did not cover any foreign residents living and working in Saudi Arabia, nor the population uninvolved in education, however, it will be straightforward to extend that in future.
References
Abdelghaffar, H. and Magdy, Y. (2012) “The adoption of mobile government services in developin g countries: The case of Egypt”, International Journal of Information, Vol. 2, No. 4, pp. 333-341.
Abanumy, A and Mayhew, P. (2005). “e-Government Website Accessibility: In-Depth Evaluation of Saudi Arabia and Oman”, The Electronic Journal of eGovernment Vol. 3, No. 3, pp. 99 -106.
Ajzen, I. (1991) “The theory of planned behavior,” Organizational behavior and human decision processes, Vol . 50, No. 2, pp. 179-211.
Ahmad A. Rabaa. (2015). An Empirical Investigation on the Adoption of e-Government in Developing Countries: The Case of Jordan, Published by Canadian Centerof Science and Education, Vol. 8, No. 3, pp, 83-102
Aldwairi, R.M., and Kamala, M.A. (2009) “An Integrated Trust Model for Business-to-Consumer (B2C) E-Commerce: Integrating Trust with the Technology Acceptance Model,” In CyberWorlds, International Conference, pp. 351-356.
Alhujran, O., Aloudat, A. and Altarawneh, I. (2013) “Factors influencing citizen adoption of e-government in developing countries: The case of Jordan,” International Journal of Technology and Human Interaction (IJTHI), Vol. 9, No. 2, pp. 1-19.
Alhujran, O. and Migdadi, M. (2013) “Public acceptance of m-government services in developing countries: The case of Jordan,” E-Government Implementation and Practice in Developing Countries, pp. 242.
Alhussain, T, Drew S and Alfarraj, O 2010, Biometric Authentication for Mobile Government Security, An application of grounded theory, 2010 IEEE International Conference on Intelli gent Computing and Intelligent Systems (ICIS 2010), October 29-31, 2010, Xiamen, China, pp.114-118. ISBN: 978-1-4244-6582-8.
Alsenaidy, M and Ahmad, T. (2012) “A REVIEW OF CURRENT STATE M GOVERNMENT IN SAUDI ARABIA”, GLOBAL ENGINEERS & TECHNOLOGISTS REVIEW.
Azam, M.S., Quaddus, M. and Rahim, M. (2010) “How experience affects technology acceptance: A quest for ICT development strategies in Bangladesh.” In Computer and Information Technology (ICCIT), 13th International Conference, pp. 289-294.
Babullah, Abdullah; Dwivedi, Y ogesh; and Williams, Michael. (2015). Saudi Citizens’ Perceptions on Mobile Government (mGov) Adoption Factors. UK Academy for Information Systems Conference Proceedings 2015.
Bélanger, F. and Carter, L. (2008), “Trust and risk in e‐government adoption”, Journal of Strategic Information Systems, Vol. 17 No. 2, pp. 165‐17
Carter, L. & Belanger, F., 2004. Citizen adoption of electronic government initiatives. [Paper presented at] 37th Hawaii International Conference on System Sciences, 2004. <http: //csdl2. computer.
org/comp/proceedings/hicss/2004/2056/05/205650119c. pdf>, [accessed 05/12/16].
Cavana, R., Delahaye, B and Sekeran, U. (2001) Applied Business research: Qualitative and Quantitative Methods.
Choudrie, J & Dwivedi, Y. (2005). “A Survey of Citizens’ Awareness and Adoption of EGovernment Initiatives”, the ‘Government Gateway’: A United Kingdom Perspective, accessed 2/1/2016,
<http://www.iseing.org/egov/eGOV05/Source%20Files/Papers/CameraReady-5-P.pdf>
Bagozzi, R. and Yi, Y. (1988) “On the evaluation of structure equations models”, Academic of Marketing Science, Vol. 16, No. 1, pp. 76-94.
Colesca, S.E. (2009) “Understanding trust in e-government,” Inzinerine Ekonomika-Engineering Economics Vol, 3, pp. 7-15.
Davis, F.D., Bagozzi, R.P., and Warshaw, P.R. (1989) “User acceptance of computer technology: a comparison of two theoretical models,” Management science. Vol. 35, No. 8, pp. 982-1003.
Deng, Z., Lu, Y., Zhang, J., and Wang, B. (2008) “Subscription of Mobile Services: The Role of TAM and Trust,” In Wireless Communications, Networking and Mobile Computing, 2008. WiCOM'0 8. 4th International Conference, pp. 1-4.
Dwivedi, Y.K. and Irani, Z. (2009), “Understanding the adopters and non‐adopters of broadband”, Communications of the ACM, Vol. 52 No. 1, pp. 122‐5.
Fishbein, M., and Ajzen, I. (1975) Belief, attitude, intention and behavior: an introduction to theory and research.
Fornell, C. and Larcker, D. F. (1981) “Evaluating Structural Equations Models with Unobservable Variables and Measurement Error”, Journal of Marketing Research, pp. 39 –50.
Gao, S., Moe, S.P., and Krogstie, J. (2010) “An empirical test of the mobile services acceptance model,” In Mobile Business and 2010 Ninth Global Mobility Roundtable (ICMB-GMR), 2010 Ninth International Conference, pp. 168-175.
Hair, J. B., Money, B., AH and Samouel, P. (2003) Essentials of Business Research Methods.
Hair, J. F., Black, W. C., Babin, B. J., Anderson, R. E. and Tatham, R. L. (2006) “Multivariate data analysis”, Vol. 6.
Hong, S.J., Thong, J.Y., Moon, J.Y., and Tam, K.Y. (2008) “Understanding the behavior of mobile data services consumers,” Information Systems Frontiers, Vol. 10, No. 4, pp.431-445.
Hung, S.Y., Chang, C.M., and Kuo, S.R. (2013) “User acceptance of mobile e-government services: An empirical study,” Government Information Quarterly, Vol. 30, No. 1, pp. 33-44.
Ives, B., Olson, M.H., and Baroudi, J.J. (1983) “The measurement of user information satisfaction,” Communications of the ACM, Vol. 26, No. 10, pp.785-793.
Janssens, W., De Pelsmacker, P., and Van Kenhove, P., (2008) “Marketing research with SPSS,” Pearson Education.
Kumar, M., and Sinha, O.P. (2007) “M-government–mobile technology for e-government,” In International conference on e-government, India, pp. 294-301.
Kumar, V, Mukerji, B, Butt, I & Persaud, A. (2007), “Factors for Successful E-government Adoption: a Conceptual Framework”, Electronic Journal of e-Government, vol. 5, no. 1, pp 63-76.
Lallana, E.C. (2004) “mGovernment: Mobile/Wireless Applications in Government,” eGovernment for Development.
Lee, S.M., Tan, X., and Trimi, S. (2005) “Current practices of leading e-government countries.” Communications of the ACM, Vol. 48, No. 10, pp.99-104.
Lee, S.M., Tan, X., and Trimi, S. (2006) “M-Government, from rhetoric to reality: Learning from leading countries,” Electronic Government, an International Journal, Vol. 3, No. 2, pp. 113-126.
Ndou, V. (2004) “E-government for developing countries: opportunities and challenges,” The electronic journal of information systems in developing countries, Vol. 18.
Nysveen, H., Pedersen, P.E., and Thorbjørnsen, H. (2005) “Explaining intention to use mobile chat services: moderating effects of gender,” Journal of consumer Marketing, Vol. 22, No. 5, pp. 247-256.
Osman,N, 2013, “Extending the Technology Acceptance Model for Mobile Government Systems,” development, vol. 5, p. 16
Ovier, R.L., (1999) “whence Customer Loyalty,” Journal of Marketing, Vol. 63, pp. 33-44.
Parasuraman, A., Zeithaml, V., and Berry, L. (2002) “SERVQUAL: a multiple-item scale for measuring consumer perceptions of service quality,” Retailing: critical concepts, Vol. 64, No. 1, p.140.
Lai and K. B. Chuah. 2010 "Developing an Analytical Framework for Mobile Payments Adoption in Retailing: A Supply-Side Perspective," 2010 International Conference on Management of e-Commerce and e-Government, Chengdu, pp. 356-361.
Liu, Y, Li, H, Kostakos, V, Gancalves, J, Hosio, S & Hu, F. (2014). “An empirical investigation of mobile
government adoption in rural China: A case study in Zhejiang province”, Government Information Quarterly, Vol. 31, No. 3, pp 432–442
Reddick, C. G. (2014). “Citizens and Mobile Government Adoption: A Comparison of Activities and Uses”. International Journal of Civic Engagement and Social Change (IJCESC), 1(1), 13-26.
Rogers, E.M. (2010) Diffusion of innovations. Simon and Schuster.
Sharma, S.K., and Gupta, J.N. (2004) “Web services architecture for m-government: issues and challenges,” Electronic Government, an International Journal, Vol. 1, No. 4, pp. 462-474.
Shih, H. P. (2004) "An empirical study on predicting user acceptance of shopping on the Web," Information & Management, Vol. 41, No. 3, pp. 351-368.
Shih-wu Liang & Hsi-peng Lu, (2013),"Adoption of e-government services: an empirical study of the online tax filing system in Taiwan", Online Information Review, Vol. 37 Iss 3 pp. 424 – 442.
Susanto, T.D., and Goodwin, R. (2010) “Factors Influencing Citizen Adoption of SMS-based eGovernment Services,” Electronic journal of e-government, Vol. 8, No. 1, pp.55-71.
Venkatesh, V., Morris, M.G., Davis, G.B., and Davis, F.D. (2003) “User acceptance of information technology: Toward a unified view,” MIS quarterly, pp. 425-478.
Changlin Wang, Runsheng Fang , Kyungsoo Park, Yuqiang Feng, Zhenhua Lu & Yonghao Cui, 2012, Perceived Usefulness, Perceived Security and Adoption of Mobile Government: An Empirical Research, Advances in information Sciences and Service Sciences(AISS) Volume4, Number6, doi: 10.4156/AISS.vol4.issue6.27.
Wadie Nasri & Hasan A Abbas, (2015), DETERMINANTS INFLUENCING CITIZENS’ INTENTION TO USE e-Gov IN THE STATE OF KUWAIT: APPLICATION OF UTAUT, International Journal of Economics, Commerce and Management, Vol. III, Issue 5, pp, 517-540
Wang, C. (2014). “Antecedents and consequences of perceived value in Mobile Government continuance use: An empirical research in China”. Computers in Human Behavior, 34, 140-147
Wang, Y. (2003). “The Adoption of Electronic Tax Filing Systems: An Empirical Study”, Government Information Quarterly, vol. 20, no. 4, pp 333-352.
Wixom, B.H., and Todd, P.A. (2005) “A theoretical integration of user satisfaction and technology acceptance,” Information systems research, Vol. 16, No. 1, pp. 85-102.