Wind turbine gearbox planet bearing failure
prediction using vibration data
S Koukoura, J Carroll, A McDonald and S Weiss
University of Strathclyde, 16 Richmond St, Glasgow G1 1XQ, UK E-mail: sofia.koukoura@strath.ac.uk
Abstract. This paper presents a methodology for predicting planet bearing failures utilising
vibration data acquired through accelerometers installed on the gearbox surface. The proposed methodology applies certain signal pre-processing techniques in order to remove the speed variations of the turbine and separate the stochastic bearing components from the deterministic gear ones. Then, spectral kurtosis is used to enhance the impulsiveness of the bearing fault signatures and envelope analysis is used to demodulate the signal. Features are extracted from the envelope spectrum and are used as an input to a classification model. The classification labelling is performed based on the time before failure. The methodology is tested on real offshore wind turbine vibration data collected at various times before failure. The performance of the classifier is assessed using k-fold cross validation. The results are compared with methods of classic envelope analysis that uses a constant demodulation band.
1. Introduction
Wind power capacity and production has rapidly increased during the past decades in order to meet the ambitious targets of climate protection and energy security. In order to make this form of electricity generation even more competitive, the cost of energy needs to be decreased. Operation and maintenance (O&M) costs [1] are one of the main contributors to the levelised cost of energy, especially regarding offshore wind farms.
Reliability is an important factor regarding wind farm profitability. According to both onshore and offshore wind turbine failure statistics, mechanical subassemblies experience the longest downtime [2], [3], [4]. That downtime is highly dominated by the gearbox and it seems to have the highest repair cost offshore [1].
Therefore, it is really important to predict and repair incipient gearbox failures. This can be achieved through successful condition monitoring (CM). From the CM perspective, a wind turbine gearbox consists of three major components: gears, bearings, and lubricant. The main condition monitoring techniques along with the signal processing methods used for diagnosis and their applications in wind power are presented in [5]. The most popular technologies regarding gearbox condition monitoring are vibration analysis and oil analysis. This paper focuses on the vibration analysis approach for bearing diagnostics.
is used to determine the vibration signatures of the planet bearing inner and outer race defects in [8].
Traditional frequency domain analysis through Fast Fourier Transform can sometimes be insufficient for the analysis of bearing faults. One of the primary studies on bearing diagnostics found that bearing fault signals are found in the high frequency region of resonances excited by internal impacts [9]. That is the reason why the analysis of envelope signals reveals more diagnostic information than the analysis of raw signals, since the signal is bandpass filtered in a high frequency band where the fault impulses are amplified by structural resonances [10]. A comprehensive explanation of envelope analysis for bearings is given in [11].
A successful diagnostic method should then be able to isolate the defect-induced impulse responses. Spectral kurtosis (SK) [12] is a valuable tool for extracting transients buried in noise and locating the frequency bands with a high amount of impulsiveness, while at the same time it filters the signal to maximise that impulsiveness. Applications of the spectral kurtosis can be found in [13], [14]. A comprehensive tutorial on rolling element bearing diagnostics using SK is given in [15]. An alternative time frequency method is multi scale enveloping spectrogram using various scales for wavelet transforms, and an application of this on roller bearings is given in [16].
SK has been optimised for rolling element bearings using autoregressive (AR) models [17],
complex Morlet wavelets [18] and the Kurtogram [12]. SK in high speed machines can be
enhanced through minimum entropy deconvolution, which effectively deconvolves the effect of the transmission path and clarifies the impulses, even where they are not separated in the original signal, as presented in [19]. Signal to noise ratio is improved through linear prediction and self adaptive noise cancellation, while spectral kurtosis is used to identify the frequency band with the high level of impulsiveness in [20].
As the volume of installed wind capacity increases, data interpretation becomes more challenging. A diagnostic and maintenance decision support system would thus be aided by automatic pattern recognition. This can be achieved by classification of signals into health states based on features extracted from them. For that reason, AI techniques are increasingly being applied in machine diagnostics. A broad review of various algorithms used is given in [21]. Some bearing fault features that can potentially be used as input in machine learning algorithms are presented in [22]. Wind turbine gearbox imbalance and misalignment failures can be classified through SVMs, using both vibration and operational features [23].
While the aforementioned literature provides useful insight into the analysis of wind turbine bearing fault vibration signals, the area of using the knowledge of historic data to perform diagnostics and prognostics has been scarcely researched. Furthermore, there exist few studies in the literature where real wind turbine failure examples and data progressively before failure have been demonstrated. Therefore, this paper aims to present a wind turbine bearing failure prediction framework based on appropriate pre-processing of vibration signals, feature extraction and classification using machine learning techniques.
This paper is organised as follows: Section 1 gives the motivation of the paper and reviews the literature on the state-of-the-art bearing failure analysis methods. Section 2 presents the automated framework of the vibration signal analysing, feature extraction and classification of the signals according to the acquisition time with respect to a failure incident. Section 3 illustrates the methods discussed in Section 2, using real wind turbine vibration data. The case study concerns a bearing failure. Section 4 draws conclusions.
2. Methodology
consists of separation of gear signatures from bearing ones using an adaptive filter, the selection of the right demodulation band using spectral kurtosis and finally envelope analysis. The feature extraction step involves extracting signal features that can reflect the state of the bearing, focusing on specific frequencies of interest. Finally, signals are classified using k nearest neighbours (kNNs) according to their acquisition time with respect to failure.
2.1. Bearing Fault Signatures
When a rolling element strikes a local fault in the inner or outer race (or when a faulty rolling element strikes the inner or the outer race), a shock is introduced. That shock excites high frequency resonances of the structure between the bearing and the transducer. Those resonances depend on the strength of the load borne by the rolling elements and are further amplitude modulated by this effect. Also, the transmission path from the fault to the transducers should be taken into account and in case of a moving fault, the transfer function of the transmission path also varies.
The characteristic bearing fault frequencies are determined according to Eq. (1a)-(1d) [15].
BPFI =fN
2
1 +B
P cos(θ)
(1a)
BPFO =f
1−B
P cos(θ)
(1b)
FTF = f
2
1−B
P cos(θ)
(1c)
BSF =f P
2B 1−
B P cos(θ)
2!
(1d)
Where BPFI and BPFO are the ball passing frequencies for inner and outer race respectively, FTF is the fundamental train frequency (cage speed) and BSF is the ball spin frequency (the frequency with which the fault strikes the same race - inner or outer). Those frequencies depend on the shaft frequency f and some parameters regarding the bearing dimensions. Those areN the number of balls, B the ball diameter, P the pitch diameter and θthe contact angle.
It should be taken into account that the above mentioned frequencies in reality have some slip, due to the variation of the angleθwith the position of each rolling element in the bearing, because the ratio of local radial to axial load changes. That slip is considered to be around 1-2% [15].
2.2. Separating Gear from Bearing Signals
Bearing signals in gearboxes are often masked by discrete frequency components coming from gears and shafts, even if there are no gear faults present. In a wind turbine gearbox for example, the planetary stage fault frequencies and their harmonics can be close to the higher speed shaft frequencies and the tooth mesh frequency of planet gears. Therefore, it is useful to separate gear from bearing components.
of itself. The adaptive filter is a recursive filter that uses the least mean squares algorithm [25]. This can be elaborated in [26].
The filter coefficients calculation speed can be improved if the adaptation is performed on blocks of data, by using the overlap-save technique for fast convolution by means of Fast Fourier Transforms.
The filter essentially depends on the choice of three parameters: the time delay, the filter length and the forgetting factor. The delay should be large enough so that the delayed version becomes uncorrelated with the noise in the signal but not so large that the periodic components become uncorrelated 1. The forgetting factor should be set sufficiently small so that the filter equations converge. The choice of the filter length is also a compromise between sufficient selectivity of the frequency response and convergence. The filter parameters are given in Table 1.
Table 1. Adaptive Filter Parameters
Delay Forgetting Factor Filter Length Block Size
100 10−5 1024 16
2.3. Spectral Kurtosis
Kurtosis is a global value of the impulsiveness of the signal. Spectral kurtosis extends the concept of kurtosis and shows how the impulsiveness of a signal varies with frequency. Spectral kurtosis is a useful tool for detecting transients in a signal.
Faults associated with rolling element bearings give rise to modulated impulses. Thus, the spectral kurtosis will be large in frequency windows where the fault signal is dominant and small where the spectrum is dominated by stationary signals. The algorithms is explained in [12].
In order to calculate the spectral kurtosis, the short time Fourier transform of the signal is computed by moving a time window along the signal. The window must be shorter than the spacing between pulses, but longer than individual pulses so as to get a maximum value of spectral kurtosis.
2.4. Envelope Analysis
Envelope analysis of bearing vibration signals is based on the demodulation of the high frequency resonance associated with bearing impacts [11]. As explained in Section 2.1, the impacts caused from rolling element bearings modulate the signal at the associated bearing fault frequencies. Therefore, sidebands appear in the spectrum around the resonant frequency, which is hard to know a priori. It is advisable that a resonant frequency that is higher than the shaft and gear harmonics is chosen. Also, it is suggested in the literature to pick a frequency window close to the accelerometer resonance. In the bearing envelope analysis the signal is multiplied with a high frequency, complex signal centered at a hypothesized resonant frequency. This is then low pass filtered to remove the high frequency image, decimated, and the spectral power density is estimated.
2.5. Classification
The purpose of classification or supervised learning is to know the number of classes beforehand, and the aim is to establish a rule whereby we can classify a new observation into one of the existing classes.
1 In theory the correlation time between periodic signals is infinite but in practice the components of the real
The classification method used in the proposed methodology is k Nearest Neighbours (kNN). kNN is chosen because it is one of the most straightforward machine learning methods since it is non parametric and instance based.
Given a positive integerk, an unseen observationxand a similarity metric (distance)d, kNN classifier performs the following two steps:
• The distancedbetweenxand each training observation is computed for the whole dataset. Let A subset be the k points in the training data that are closest to x. Note that k is usually odd to prevent tie situations.
• It then estimates the conditional probability for each class, that is, the fraction of points in A with that given class label.
• Finally, our input xgets assigned to the class with the largest probability.
The choice ofkis really important. A small value fork provides the most flexible fit, which will have low bias but high variance. Larger values of kwill have smoother decision boundaries which means lower variance but increased bias. The value of k in this paper is tuned using cross validation [27].
The features extracted in this methodology and used as input to the kNN model have to capture rise of the amplitude of the signal at the bearing fault frequencies. Therefore, the energy of the signal around the bearing fault frequency and its 3 harmonics are chosen. The center frequency is used based on the calculated fault frequency - which is known if the gearbox configuration and the speed of the turbine is known - and the window around the frequency is 2% to take into account the bearing slip. Furthermore, the loading conditions change the vibration signatures significantly and thus the mean torque of each sample signal is used as input to the classification model.
3. Case Study
This section presents a case study of the proposed methodology, applied on real wind turbine data. The system under study is described and the results of the analysed signals are presented along with their classification accuracy.
3.1. Wind Turbine Considered in this Study
In the case study considered, the gearbox has a structure commonly found offshore. It consists of two planetary stages (PS1, PS2) and one parallel stage (HS). The main shaft is connected to the planet carrier of PS1 and the HS pinion of the gearbox is coupled to the generator. The ring gears of the planetary stages are fixed.
The gearbox internal structure is shown in Figure 1 and the component speeds are calculated according to Table 2.
To validate the suggested methodology, a case study on vibration data from offshore wind turbines is presented. The wind turbines belong to the same manufacturer, have the same rated power and gearbox type and belong to 4 different offshore wind farms. The turbines characteristics are shown in Table 3 2. The vibration data acquisition system consists of 9 accelerometers and a tachometer on the high speed shaft. The generator speed, the wind speed and the power produced by the turbine are also recorded.
The failure mode examined is the same in all wind turbines. This failure occurs on a first planetary stage planet bearing. The failure starts on the inner race way with debris eventually effecting the outer raceway. Figure 2 shows the bearing in a faulty state.
Figure 1. Gearbox Internal Nomenclature
Table 2. Speed Calculation for Double Planetary Stage Gearbox
Gear Element # Teeth Speed
PS1 Planet Carrier fa
PS1 Ring Gear Zr1 Fixed
PS1 Planet Zp1 fp1 =faZZrp11
PS1 Sun Pinion Zs1 fs1=fa(1 +ZZrs11)
PS2 Ring Gear Zr2 Fixed
PS2 Planet Zp2 fp2 =fs1ZZpr22
PS2 Sun Pinion Zs2 fs2=fs1(1 + ZZrs22)
IMS Gear Wheel Zi fi=fs2
[image:6.595.151.441.447.658.2]HSS Output Pinion Zh fh=fiZZhi
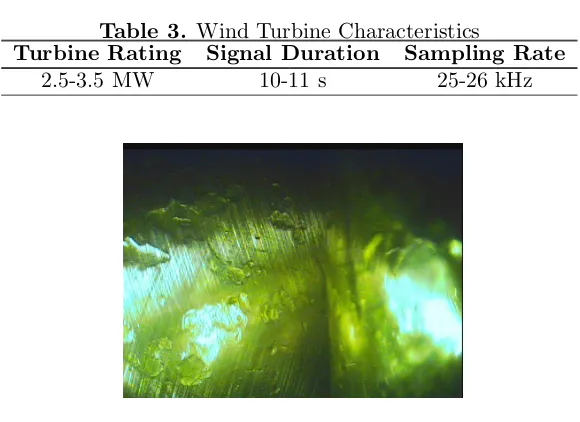
Table 3. Wind Turbine Characteristics
Turbine Rating Signal Duration Sampling Rate
2.5-3.5 MW 10-11 s 25-26 kHz
Figure 2. Faulty bearing.
3.2. Signal Analysis Diagnostic Results
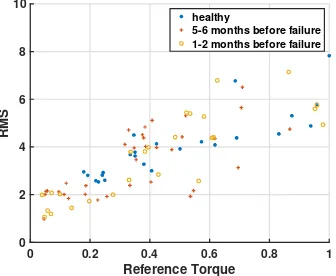
The vibration signal of the channel that is closest to the fault is used. Only the first 2 seconds of the data is used on which the signal is assumed to be relatively stationary as the wind conditions will not have changed significantly. Initially the root mean square (RMS) of the raw vibration signals is calculated, since it could easily reveal some present faults. The 95 vibration samples from 4 different wind farms are grouped according to their acquisition time with respect to the catastrophic failure. The results are shown in Figure 3 as a function of the reference torque. It seems that no matter whether the signals are collected from a healthy bearing or a bearing close to failure, the RMS does not reveal any noticeable change in condition. This indicates that further signal processing should be investigated and applied in order to reveal fault signatures.
0 0.2 0.4 0.6 0.8 1 Reference Torque
0 2 4 6 8 10
RMS
healthy
[image:7.595.211.379.268.406.2]5-6 months before failure 1-2 months before failure
Figure 3. RMS of raw vibration signals
0 1 month
0.01 0.02 0.03
Amplitude
0.04
Time before failure 5 months 0.05
70
Frequency
60 50 40 30 1.5 years 20
[image:8.595.159.424.127.292.2]10
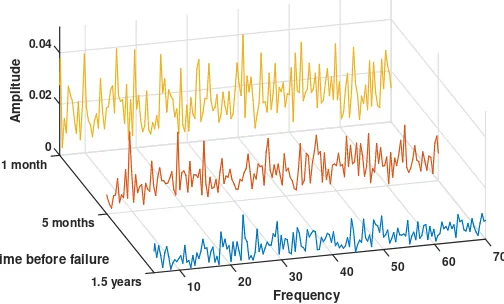
Figure 4. Envelope Spectra (constant demodulation band). No clear difference can be noticed between the spectra.
0 1 month
0.02
Amplitude
Time before failure 5 months 0.04
70 60
Frequency 50 40 30 1.5 years 10 20
Figure 5. Envelope Spectra (based on spectral kurtosis). Peaks appear at the ball passing
frequencies and their harmonics a few months before catastrophic failure.
3.3. Classification Results
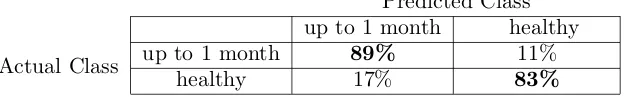
The classification results are presented in this Section. Initially a 3 class classification is implemented, based on which group with respect to the time of failure the signal belongs to: “healthy (collected more than a year before failure)”, “5-6 months before failure”, “1-2 months before failure”. The results are presented in Table 4 and it seems that the signals which belong to the 5-6 months class tend to be often classified as 1-2 months. Therefore, a 2 class classification is then implemented, which essentially groups the signals as “healthy” and “up to within 1 month before failure”. The results are shown in Table 5. Each horizontal line of the table show the percentages of the actual class that are classified in each predicted class.
[image:8.595.166.418.377.529.2]Predicted Class
1-2 months 5-6 months healthy
Actual Class
1-2 months before failure 75% 18% 7%
5-6 months before failure 21% 69% 9%
[image:9.595.114.490.119.181.2]healthy 6% 12% 79%
Table 4. 3 Class classification results confusion matrix. The actual and predicted classes are shown. A lot of missclassifications are noticed, especially between the classes “1-2 month” and “5-6 month”.
Predicted Class
up to 1 month healthy
Actual Class up to 1 month 89% 11%
healthy 17% 83%
Table 5. 2 Class classification results confusion matrix. This grouping seems to give higher classification results, although the dataset in now unbalanced (more faulty signals). A few false alarms are noticed.
The lower accuracy of the 3 class classification is quite expected since the degradation of the bearing is not linear, therefore the state of the bearing 2 months and 5 months before failure could seem comparable in the vibration spectra.
False negatives and false positives can either lead to unnecessary maintenance (which can prove to be quite costly offshore) or to a missed fault detection, which may later require the replacement of components, thus increasing maintenance cost and downtime. A larger dataset of more training examples could potentially give a higher accuracy or give further indication about the robustness of the model.
4. Conclusions and Future Work
This paper presented an automated framework for fault prediction of wind turbine gearbox planet bearings. The methodology involves the acquisition of raw vibration signals and the preprocessing of the signals in order to reveal possible bearing fault signatures that are masked by other components. The preprocessing involves an adaptive filter that removes the deterministic components in the signal and the calculation of spectral kurtosis, which helps in detecting the appropriate demodulation band for envelope analysis. Features are extracted from the processed signals and used as inputs in a pattern recognition algorithm. The signals are classified as healthy or up to a few months before catastrophic failure.
Signal preprocessing and spectral kurtosis seem to reveal the fault signatures more clearly than just applying envelope analysis in a constant demodulation band. A 3 class classification did not yield as successful results as the 2 class. It should be kept in mind that the assignment of classes is performed by expert judgement. As such, in order to implement a complete prognostic framework, the degradation mechanism of the bearing needs to be taken into account and more data at various loading conditions would be needed to train accurate models. Also, different machine learning algorithms could improve the accuracy of the results.
References
[1] Carroll J, McDonald A, McMillan D. Failure rate, repair time and unscheduled O&M cost analysis of offshore wind turbines. Wind Energy. 2015;.
[2] Ribrant J, Bertling L. Survey of failures in wind power systems with focus on Swedish wind power plants during 1997-2005. In: Power Engineering Society General Meeting, 2007. IEEE. IEEE; 2007. p. 1–8. [3] Wilkinson M, Hendriks B, Spinato F, Harman K, Gomez E, Bulacio H, et al. Methodology and results of
[image:9.595.146.458.229.278.2][4] Crabtree CJ. Operational and reliability analysis of offshore wind farms. In: Proceedings of the scientific track of the European Wind Energy Association conference; 2012. .
[5] M´arquez FPG, Tobias AM, P´erez JMP, Papaelias M. Condition monitoring of wind turbines: Techniques and methods. Renewable Energy. 2012;46:169–178.
[6] Lei Y, Lin J, Zuo MJ, He Z. Condition monitoring and fault diagnosis of planetary gearboxes: A review. Measurement. 2014;48:292–305.
[7] Wang YF, Kootsookos PJ. Modeling of low shaft speed bearing faults for condition monitoring. Mechanical Systems and Signal Processing. 1998;12(3):415–426.
[8] Jain S, Whiteley P, Hunt H. Detection of planet bearing faults in wind turbine gearboxes. In: Proceedings of International Conference on Noise and Vibration Engineering (ISMA?12)/International Conference on Uncertainty in Structural Dynamics (USD?12); 2012. p. 4351–4362.
[9] Balderston H. Incipient failure detection: Incipient failure detection in ball bearings. BOEING CO SEATTLE WA AEROSPACE SYSTEMS DIV; 1969.
[10] Darlow MS, Badgley RH, Hogg G. Application of High-Frequency Resonance Techniques for Bearing Diagnostics in Helicopter Gearboxes. MECHANICAL TECHNOLOGY INC LATHAM NY; 1974. [11] Hochmann D, Bechhoefer E. Envelope bearing analysis: theory and practice. In: Aerospace Conference,
2005 IEEE. IEEE; 2005. p. 3658–3666.
[12] Antoni J, Randall R. The spectral kurtosis: application to the vibratory surveillance and diagnostics of rotating machines. Mechanical Systems and Signal Processing. 2006;20(2):308–331.
[13] Randall R, Antoni J, Sawalhi N. Application of spectral kurtosis to bearing fault detection in rolling element bearings. In: Eleventh International Congress on Sound and Vibration. St. Petersburg; 2004. .
[14] Sawalhi N, Randall RB. The application of spectral kurtosis to bearing diagnostics. In: Proceedings of ACOUSTICS; 2004. p. 3–5.
[15] Randall RB, Antoni J. Rolling element bearing diagnosticsa tutorial. Mechanical systems and signal processing. 2011;25(2):485–520.
[16] Yan R, Gao RX. Multi-scale enveloping spectrogram for vibration analysis in bearing defect diagnosis. Tribology International. 2009;42(2):293–302.
[17] Sawalhi N, Randall R. Spectral kurtosis enhancement using autoregressive models. In: ACAM Conference, Melbourne, Australia; 2005. .
[18] Sawalhi N, Randall RB. Spectral kurtosis optimization for rolling element bearings. In: ISSPA; 2005. p. 839–842.
[19] Sawalhi N, Randall R, Endo H. The enhancement of fault detection and diagnosis in rolling element bearings using minimum entropy deconvolution combined with spectral kurtosis. Mechanical Systems and Signal Processing. 2007;21(6):2616–2633.
[20] Ruiz-C´arcel C, Hernani-Ros E, Chandra P, Cao Y, Mba D. Application of Linear Prediction, Self-Adaptive Noise Cancellation, and Spectral Kurtosis in Identifying Natural Damage of Rolling Element Bearing in a Gearbox. In: Proceedings of the 7th World Congress on Engineering Asset Management (WCEAM 2012). Springer; 2015. p. 505–513.
[21] Siddique A, Yadava G, Singh B. Applications of artificial intelligence techniques for induction machine stator fault diagnostics. In: Diagnostics for Electric Machines, Power Electronics and Drives, 2003. SDEMPED 2003. 4th IEEE International Symposium on. IEEE; 2003. p. 29–34.
[22] Li R, Sopon P, He D. Fault features extraction for bearing prognostics. Journal of Intelligent Manufacturing. 2012;23(2):313–321.
[23] Santos P, Villa LF, Re˜nones A, Bustillo A, Maudes J. An SVM-based solution for fault detection in wind turbines. Sensors. 2015;15(3):5627–5648.
[24] Kay SM, Marple SL. Spectrum analysisa modern perspective. Proceedings of the IEEE. 1981;69(11):1380– 1419.
[25] Widrow B, Stearns SD. Adaptive signal processing. vol. 15. Prentice-hall Englewood Cliffs, NJ; 1985. [26] Antoni J, Randall R. Unsupervised noise cancellation for vibration signals: part Ievaluation of adaptive
algorithms. Mechanical Systems and Signal Processing. 2004;18(1):89–101.