Is the future development of wind energy
compromised by the availability of raw materials?
E Gonzalez1,2, A Ortego3, E Topham4,5, A Valero3
1ORSEIDE, C/ Dubl´ın, 62, 31620 Pamplona, Spain
2Universidad de Zaragoza, C/ Mariano Esquillor G´omez, s/n, 50018 Zaragoza, Spain 3CIRCE, C/ Mariano Esquillor G´omez, 15, 50018 Zaragoza, Spain
4Doctoral Training Centre in Wind and Marine Energy Systems, University of Strathclyde,
Glasgow, UK
5DNV GL, Edificio Trovador, Plaza de Antonio Beltr´an Mart´ınez, 50002 Zaragoza, Spain
E-mail: [email protected]
Abstract. The installation of new electrical power plants from renewable sources is key in the transition towards a low-carbon economy. An important amount of diverse raw materials is required for this development. Due to its current prominence among renewable energy sources, we assess the expected development of wind energy towards the availability of the required raw materials up to 2050. Wind power is found to be in a favourable position, over solar thermal and photovoltaic power. Among the two main wind turbine technologies, the installation of direct drive turbines with permanent magnets faces a more challenging future. Recycling is an important strategy to simultaneously reduce risks and costs.
1. Introduction
The increasing installed capacity of renewable electricity generation is currently considered as one of the most important steps to address climate change. As stated by the European Commission, all sectors must contribute to achieve a minimum reduction of greenhouse gas (GHG) emissions to 80% of 1990’s levels [1]. In this context, the electricity sector presents the biggest potential to achieve these European targets and could almost totally eliminate CO2
emissions by 2050 [2]. According to the International Energy Agency [3], installed capacity from wind energy, solar thermal or photovoltaic power could reach figures of 2400 GW, 980 GW and 4500 GW respectively. Yet this energy transition must be carefully accomplished as a considerable amount of raw materials are required to build these new installations, increasing the pressure on materials availability.
Renewable technologies demand important amounts of elements to build wind turbines, solar cells or solar concentrator surfaces. Besides, current recycling rates of some of these materials are almost negligible due to higher costs of recycling processes [4]. Although recycling presents evident benefits [5], current recycling rates are still very low [6]. As a consequence, the dependency on critical resources could be pronounced as a potential barrier to a wider implementation of emerging renewable energy technologies [7].
the expected development of wind power [10–14].
In this paper, we analysed the potential future demand scenarios for 19 metals resulting from the expected new wind power installations up to 2050. Additionally, both solar sources, solar thermal and photovoltaic, are addressed for comparison purposes. The objective is to identify the constraints for future wind development related to raw materials availability.
2. Methodology
In this work, the demand of 19 di↵erent materials is assessed up to 2050, given the expected installations of wind power (WP), solar thermal power (STP) and solar photovoltaic (PV) per year. Then, the cumulative demand of each material until 2050 can be obtained. Finally, the comparison of this total demand against the resources and reserves of each material allows any risk to be identified, related to the three studied technology and the di↵erent materials considered.
The constraints related to future development of wind power, as well as STP and PV, were identified considering their related demand of the 19 following materials: Silver (Ag), Aluminium (Al), Cadmium (Cd), Chromium (Cr), Copper (Cu), Dysprosium (Dy), Gallium (Ga), Germanium (Ge), Indium (In), Magnesium (Mg), Manganese (Mn), Molybdenum (Mo), Nickel (Ni), Neodymium (Nd), Tin (Sn), Tellurium (Te), Titanium (Ti), Vanadium (V) and Zinc (Zn).
The identification of risks for material scarcity was performed here in di↵erent steps, presented in detail subsequently. The core of the methodology relies on the combination of a bottom-up and a top-down approaches. While the bottom-up approach covers the availability in terms of reserves and resources per material, the top-down approach assesses the quantity of each material demanded by each technology.
2.1. Top-down approach
A top-down approach was followed to obtain a cumulative demand of the mentioned materials by the selected renewable energy technologies, in a projected scenario over the period from 2016 to 2050. To do so, the expected yearly installed capacity from wind power [15,16], solar PV [17–19] and STP [20, 21] was assessed until 2050. The projection of the yearly new installed capacity for the three renewable technologies is illustrated in Figure 1. As can be seen, the repowering of old installations will increase the yearly installed power from 2033 with a special growing from 2039 caused by solar PV mainly.
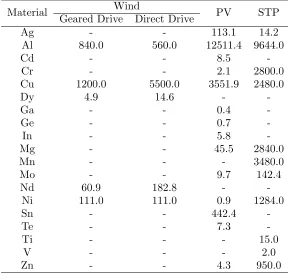
Then, based on the literature [22], the material requirements per manufactured and installed megawatt (MW) of the three renewable technologies were used to translate the expected power installations into expected cumulative material demand, assuming current state-of-the-art developments and competition with the rest of sectors, in the 2016 - 2050 time period. The manufacturing requirements per material for every renewable technology are presented in Table 1, where the di↵erent requirements between wind turbines with geared or direct drive technology with permanent magnets are specified. Indeed, the need of permanent magnets presents in many direct drive wind turbine models increases significantly the requirements of Cu, Dy and Nd.
0 100 200 300 400
2015 2020 2025 2030 2035 2040 2045 2050
Ne
w Installed Capacity [GW]
Renewable Technology
[image:3.595.143.450.114.275.2]Wind PV STP
Figure 1: Projection of yearly installed capacity from wind power, solar PV and STP.
Table 1: List of materials used in renewable power installations (in kg/MW).
Material Wind PV STP
Geared Drive Direct Drive
Ag - - 113.1 14.2
Al 840.0 560.0 12511.4 9644.0
Cd - - 8.5
-Cr - - 2.1 2800.0
Cu 1200.0 5500.0 3551.9 2480.0
Dy 4.9 14.6 -
-Ga - - 0.4
-Ge - - 0.7
-In - - 5.8
-Mg - - 45.5 2840.0
Mn - - - 3480.0
Mo - - 9.7 142.4
Nd 60.9 182.8 -
-Ni 111.0 111.0 0.9 1284.0
Sn - - 442.4
-Te - - 7.3
-Ti - - - 15.0
V - - - 2.0
Zn - - 4.3 950.0
As a result, the quantity of a raw materialademanded for all the analysed technologies,t, for a given yeary can be obtained (see Equation 1). Ni is the yearly number of manufactured units
per technology i, Ma,i is the quantity of material a demanded by one functional unit (1 MW)
per technology and ra is the recycled share of material a.
da,y=
m
X
i=1
NiMa,i(1 ra) (1)
[image:3.595.152.440.342.615.2]ns rn
Equation 2).
N =Nns+Nrn (2)
Additionally, renewable technologies will certainly compete with other sectors in terms of materials’ demand. In this work, this material demand for other sectors da,os has been kept
constant until 2050, due to the little information available in the literature. da,os is estimated
based on figures from 2015 as the di↵erence between the total material production (Pa)2015 and
the material demand from renewable technologies for the same yearPa (see Equation 3).
da,os= (Pa)2015 (da,2015) (3)
Finally, the total demand for a given material a in yeary, (da,T)y, and the total cumulative
demand Da,T up to 2050 are assessed (see Equation 4 and 5).
(da,T)y = (da,y)y+ (da,os)2015 (4)
Da,T =
2050
X
y=2016
(da,T)y (5)
2.2. Bottom-up approach
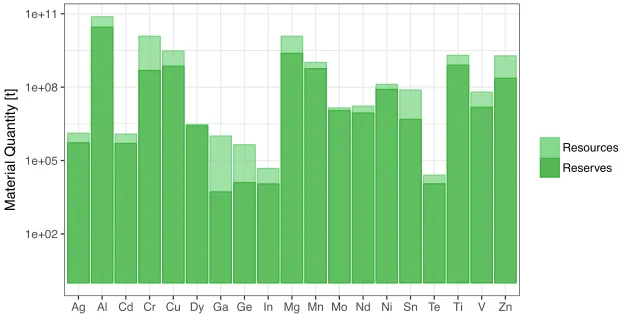
As mentioned, the bottom-up approach covers the availability in terms of reserves and resources per material. While the resources are substrates present in the subsoil, regardless their accessibility or the financial and energy viability of their exploitation, the reserves are deposits that have been proven to be exploitable meeting both technological and financial feasibility. Due to this significant di↵erence, it is important to identify the raw material availability in terms of both reserves and resources. In this case, the assessment on a global basis of the reserves and resources trends from 2016 to 2050 for each material was performed assuming a Hubbert-like production trend. More detailed description of this analysis can be found in [22]. The projected cumulative reserves and resources of the studied materials in 2050 are shown in Figure 2.
1e+02 1e+05 1e+08 1e+11
Ag Al Cd Cr Cu Dy Ga Ge In Mg Mn Mo Nd Ni Sn Te Ti V Zn
Mater
ial Quantity [t]
Resources
[image:4.595.140.452.535.692.2]Reserves
2.3. Risk identification
Two risk categories are defined considering material demand towards the available resources or reserves. As one can see in Table 2, category A is more restrictive than B, although resources and reserves are dynamic; they can change with extraction technology, prices or discovery of new deposits.
Table 2: Risk definitions related to material availability.
Type Definition
A Cumulative demand between 2016 and 2050 current resources (Da,T RES2016)
B Cumulative demand between 2016 and 2050 current reserves (Da,T RSV2016)
3. Results
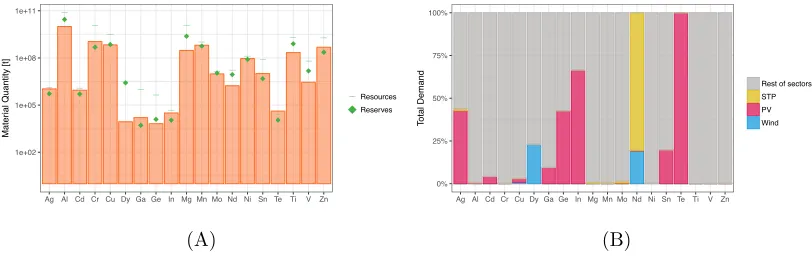
[image:5.595.93.499.393.521.2]The baseline scenario obtained from the combination of the bottom-up and a top-down approaches is illustrated in Figure 3. This baseline Scenario 1 considers a share of 75% and 25% between geared drive and direct drive wind turbine technology [23], and a constant recycled share per material (ra), meaning that no increase of the annual recycling rate was deemed.
Figure 3B details the material demand share between the renewable technologies studied in the present work.
_ _
_ _
_
_ _ _
_ _
_
_ _ _ _
_ _
_ _
1e+02 1e+05 1e+08 1e+11
Ag Al Cd Cr Cu Dy Ga Ge In Mg Mn Mo Nd Ni Sn Te Ti V Zn
Mater
ial Quantity [t]
__ Resources Reserves
(A)
0% 25% 50% 75% 100%
Ag Al Cd Cr Cu Dy Ga Ge In Mg Mn Mo Nd Ni Sn Te Ti V Zn
Total Demand
Rest of sectors STP PV Wind
(B)
Figure 3: Cumulative demand (orange bars), reserves and resources of the studied materials in a projected 2050 scenario (A) and material demand share by renewable technology (B) (Scenario 1).
As can be seen, the development of PV will be the most constrained by material availability, followed by STP. On the contrary, wind energy does not seem to be at high risk in the projected 2050 scenario. The unique unfavourable case corresponds to Nickel (Ni) availability. Also, while the availability of rare earth elements (REEs), Dysprosium (Dy) and Neodymium (Nd), does not seem to a↵ect future wind development, a problem may arise related to their supply, almost exclusively from China. The identified risks, together with the most a↵ected technology are summarised in Table 3.
3.1. Impact of annual recycling rate
_ _
_ _
_
_ _ _
_ _
_ _ _ _ _
_ _
_ _
1e+02 1e+05 1e+08 1e+11
Ag Al Cd Cr Cu Dy Ga Ge In Mg Mn Mo Nd Ni Sn Te Ti V Zn
Mater
ial Quantity [t]
__Resources
Reserves
(A)
0% 25% 50% 75% 100%
Ag Al Cd Cr Cu Dy Ga Ge In Mg Mn Mo Nd Ni Sn Te Ti V Zn
Total Demand
Rest of sectors STP PV Wind
[image:6.595.96.501.154.284.2](B)
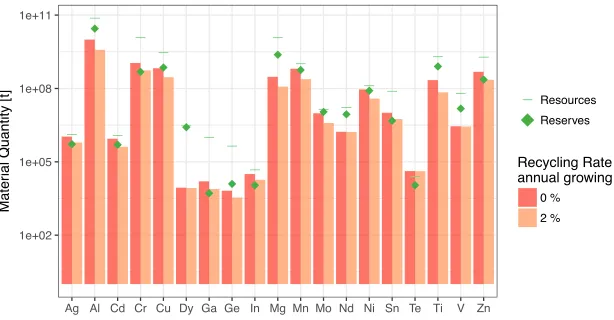
Figure 4: Cumulative demand (orange bars), reserves and resources of the studied materials in a projected 2050 scenario (A) and material demand share by renewable technology (B) assuming an annual increase of 2% of the material recycling rate (Scenario 2).
_ _
_ _
_
_ _ _
_ _
_
_ _ _ _
_ _
_ _
1e+02 1e+05 1e+08 1e+11
Ag Al Cd Cr Cu Dy Ga Ge In Mg Mn Mo Nd Ni Sn Te Ti V Zn
Mater
ial Quantity [t]
__ Resources
Reserves
Recycling Rate annual growing
0 % 2 %
Figure 5: Comparison of the cumulative demand for the scenarios 1 and 2, against the reserves and resources of the studied materials in a projected 2050 scenario.
As can be seen, the cumulative demand is positively a↵ected by increasing the annual recycling rate. Moreover, as presented in Table 3, the occurrence of risks is also significantly reduced.
[image:6.595.143.450.363.523.2]the big challenge from a recycling point of view, a part from being a logistical transportation nightmare. Blades are typically made from a composite of glass fibres and epoxy or other thermoset resin, where the cross-linked polymers are difficult to melt down and be recycled [26]. Alongside the decommissioning phase, blades are currently being shredded and then often end up in landfills, while other alternatives such as incineration and recycling could be explored [27]. The first option is becoming less popular due to the willingness of countries to reduce the land fill mass. For instance, Germany banned the disposals of glass fibre reinforced plastics (GRP) in June 2005, due to their high rate (30%) of organics content such as resin and wood. The second most common route is incineration, where the heat is reused to generate electricity in combined heat plants (CHP), but the inorganic loads lead to the emission of hazardous flue gazes. The blades also need to be dismantled and crushed before transportation placing further strain on the environment in terms of energy used and polluting emissions [27]. As a result, recycling should be definitely encouraged, either way it consists of material recycling or product recycling, i.e repowering.
3.2. Impact of wind turbine technology share
[image:7.595.96.501.440.698.2]The baseline Scenario 1 considered a share of 75% and 25% of geared and direct drive (with permanent magnets) wind turbine technologies respectively. However, direct drive wind turbine technology seems to be privileged from some wind turbine manufacturers, especially if they cover an important share of the o↵shore wind market. To assess the e↵ect of this technology share, two additional virtual scenarios (3 and 4) have been investigated; Scenario 3 considers a 100% share of geared drive wind turbines, while Scenario 4 assumes no new geared drive turbines installed, so a 100% of direct drive wind turbines. Results from both scenarios are illustrated in Figure 6. _ _ _ _ _ _ _ _ _ _ _ _ _ _ _ _ _ _ _ 1e+02 1e+05 1e+08 1e+11
Ag Al Cd Cr Cu Dy Ga Ge In Mg Mn Mo Nd Ni Sn Te Ti V Zn
Mater
ial Quantity [t]
__Resources Reserves (A) 0% 25% 50% 75% 100%
Ag Al Cd Cr Cu Dy Ga Ge In Mg Mn Mo Nd Ni Sn Te Ti V Zn
Total Demand
Rest of sectors STP PV Wind (B) _ _ _ _ _ _ _ _ _ _ _ _ _ _ _ _ _ _ _ 1e+02 1e+05 1e+08 1e+11
Ag Al Cd Cr Cu Dy Ga Ge In Mg Mn Mo Nd Ni Sn Te Ti V Zn
Mater
ial Quantity [t]
__Resources
Reserves (C) 0% 25% 50% 75% 100%
Ag Al Cd Cr Cu Dy Ga Ge In Mg Mn Mo Nd Ni Sn Te Ti V Zn
Total Demand
Rest of sectors STP PV Wind
(D)
cumulative quantity of Dy in Scenario 4. As mentioned, this is mainly due to the presence of permanent magnet generators in most direct drive turbines. A more thorough discussion is presented in Section 4.
3.3. Summary of identified risks in each studied scenario
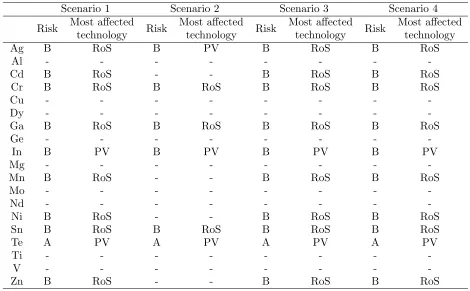
[image:8.595.68.538.254.545.2]The di↵erent risks identified in the four presented scenarios are summarised in Table 3.
Table 3: Type of risk per material in the four di↵erent projected scenarios.
Scenario 1 Scenario 2 Scenario 3 Scenario 4
Risk Most a↵ected
technology Risk
Most a↵ected
technology Risk
Most a↵ected
technology Risk
Most a↵ected technology
Ag B RoS B PV B RoS B RoS
Al - - -
-Cd B RoS - - B RoS B RoS
Cr B RoS B RoS B RoS B RoS
Cu - - -
-Dy - - -
-Ga B RoS B RoS B RoS B RoS
Ge - - -
-In B PV B PV B PV B PV
Mg - - -
-Mn B RoS - - B RoS B RoS
Mo - - -
-Nd - - -
-Ni B RoS - - B RoS B RoS
Sn B RoS B RoS B RoS B RoS
Te A PV A PV A PV A PV
Ti - - -
-V - - -
-Zn B RoS - - B RoS B RoS
4. Discussion
While the future development of wind energy should not be constrained by the demanded raw materials, geopolitical problems might tip the balance towards geared drive technologies. Many recent studies have compared the two main wind turbine technologies, i.e. geared and direct drive, in terms of manufacturing costs, reliability and maintainability. Nevertheless, the materials demanded by each configuration have not been addressed. Most direct drive turbines are equipped with permanent magnet generators, relying heavily on REEs (Dy and Nd) [28], provided almost exclusively by China. Additionally, the future demand of permanent magnets will significantly increase from the electrical vehicle industry, creating a direct competition with direct drive turbines manufacturers. Reusing [29] and recycling [30] can be therefore seen as promising strategies. End-of-life recycling could help in the current global supply crisis surrounding REEs so that dependence on China can be decreased.
possible [31]; this would imply evident benefits regarding the materials life-cycle assessment. Secondly, the recycling rates should be increased. In a longer term, recycling could provide a significant secondary supply to reduce the future demand of raw materials [12]. Apart from the environmental benefits, recycling could also contribute to reduce the levelised cost of energy (LCOE). Indeed, this is almost not considered during the decommissioning phase of a wind farm [32]. Higher recycling rates could halve the decommissioning costs, generally underestimated [33], and hence lower the capital expenditures and the LCOE. Also, reusing should be considered as part of the operation and maintenance (O&M) phase. Reusing subcomponents from critical assemblies, such as the gearbox [34], could also reduce the O&M costs.
5. Conclusions
The development of future wind power projects, as other renewable technologies, depends on the availability of certain materials required for the manufacturing and installation of wind turbines. In this study, the available resources and reserves for 19 di↵erent materials have been compared to the expected development of wind energy in a 2050 projected scenario. Two other renewable sources of electricity generation, solar thermal power and photovoltaic power, have also been assessed for comparison purposes. Wind power seems to be the least a↵ected technology given the availability of materials. Among the two main wind turbine technologies, some risks have been identified related to direct drive turbines though. The need of REEs for the production of permanent magnets creates a competition with other industries, as the electrical vehicle, and involves an important risk of shortage due to its geological availability.
Several alternatives, such as lifetime extension and recycling, have been suggested to further lower the risks for future wind development. Nonetheless, these are also valid for the two other explored renewable sources, that are found to be at higher risks.
Finally, if the current materials demands and recycling quotes are maintained, the transition to a low-carbon economy could be threatened by the availability of certain elements. This issue should be deeply analysed to define appropriate strategies that avoid the mentioned constraints.
6. Learning objectives
• A shift towards a low-carbon economy hugely depends on the availability of raw materials. • The development of wind energy might be compromised by the simultaneous requirement
of certain materials from other renewable technologies or other industries.
• While wind energy development seems to be at a lower risk than other renewable sources, direct drive technology using permanent magnets is in a less favourable position.
• Encouraging reusing and recycling of raw materials shows important and diverse benefits.
Acknowledgments
This work has been partially supported by the Spanish Ministry of Economy, Industry and Competitiveness (ENE2017-85224-R).
References
[1] European Climate Foundation 2011Power Perspectives 2030: On the road to a Decarbonised Power Sector
[2] European Commission 2015 2050 low-carbon economy [Online; accessed 30-March-2018] URL https://ec. europa.eu/clima/policies/strategies/2050 en
[3] International Energy Agency 2010Energy Technology Perspectives: Scenarios & Strategies To 2050
[4] Redlinger M, Eggert R and Woodhouse M 2015Solar Energy Materials and Solar Cells 13858–71
[5] RD´ıaz Mart´ın, Trujillo F, JFMorales Garc´ıa, CMayo del R´ıo, EBatuecas Fern´andez and Adib Guardiola Mouha↵el 2016International Journal of Applied Engineering Research112990–2995
[9] Alonso E, Gregory J, Field F and Kirchain R 2007Environmental Science & Technology416649–6656 [10] Kossakowska K 201717th International Multidisciplinary Scientific GeoConference SGEM 2017 1719–26 [11] Grandell L, Lehtil¨a A, Kivinen M, Koljonen T, Kihlman S and Lauri L S 2016Renewable Energy9553–62 [12] Habib K and Wenzel H 2014Journal of Cleaner Production 84348–359
[13] Harmsen J, Roes A and Patel M 2013Energy5062–73
[14] Alonso E, Sherman A M, Wallington T J, Everson M P, Field F R, Roth R and Kirchain R E 2012
Environmental Science & Technology 463406–3414
[15] WindEurope 2016 WindEurope Annual O↵shore Statistics 2016 [Online; accessed 02-July-2018] URL https://windeurope.org/wp-content/uploads/files/about-wind/statistics/WindEurope-Annual-O↵ shore-Statistics-2016.pdf
[16] International Energy Agency 2013 Technology roadmap. Wind energy. [Online; accessed 02-July-2018] URL https://www.iea.org/publications/freepublications/publication/Wind 2013 Roadmap.pdf
[17] Greenpeace 2016 Solar thermal electricity. Global outlook 2016 [Online; accessed 02-July-2018] URL https: //www.greenpeace.org/archive- international/Global/international/publications/climate/2016/Solar-Thermal-Electricity-Global-Outlook-2016.pdf
[18] Raccurt O, Disdier A, Bourdon D, Donnola S, Stollo A and Gioconia A 2015Energy Procedia691551–1557 ISSN 18766102 URL http://linkinghub.elsevier.com/retrieve/pii/S1876610215004130
[19] International Energy Agency 2014 Technology roadmap. Solar thermal electricity. [Online; ac-cessed 02-July-2018] URL https : / / www . iea . org / publications / freepublications / publication / technologyroadmapsolarthermalelectricity 2014edition.pdf
[20] Parrado C, Girard A, Simon F and Fuentealba E 2016 Energy 94 422–430 ISSN 03605442 URL http: //linkinghub.elsevier.com/retrieve/pii/S0360544215015418
[21] Bayod-R´ujula A A, Ortego-Bielsa A and Mart´ınez-Gracia A 2011Energy361996–2010 ISSN 03605442 URL http://linkinghub.elsevier.com/retrieve/pii/S0360544210002161
[22] Valero A, Valero A, Calvo G and Ortego A 2018 Renewable and Sustainable Energy Reviews 93 178–200 ISSN 13640321 URL https://linkinghub.elsevier.com/retrieve/pii/S1364032118303861
[23] Lacal-Ar´antegui R 2015Journal of Cleaner Production 87275–283 ISSN 09596526 URL http://linkinghub. elsevier.com/retrieve/pii/S0959652614009779
[24] ECN 2016 Lifecycle and decommissioning o↵shore wind [Online; accessed 02-July-2018] URL https://www. ecn.nl/publications/PdfFetch.aspx?nr=ECN-E--16-009
[25] Ce˜na A and Vazquez I 2018 Webinar: Life extension and repowering of wind farm’s main elements and the future trend in the sector (Aemer, InnoEnergy, Rooter)
[26] Bomgardner M M and Scott A 2018 Reclycing Renewables [Online; accessed 02-July-2018] URL https: //cen.acs.org/energy/renewables/Recycling-renewables/96/i15
[27] Larsen K 2009 Recycling wind [Online; accessed 02-July-2018] URL https://www.materialstoday.com/ composite-applications/features/recycling-wind/
[28] Hogberg S, Pedersen T S, Bendixen F B, Mijatovic N, Jensen B B and Holboll J 20162016 XXII International
Conference on Electrical Machines (ICEM)(IEEE) pp 1625–1629
[29] Hogberg S, Holboll J, Mijatovic N, Jensen B B and Bendixen F B 2017IEEE Transactions on Magnetics53
1–9
[30] Rademaker J H, Kleijn R and Yang Y 2013Environmental Science & Technology 4710129–10136
[31] Ziegler L, Gonzalez E, Rubert T, Smolka U and Melero J J 2018Renewable and Sustainable Energy Reviews
821261–1271
[32] Topham E and McMillan D 2017Renewable Energy102470–480
[33] Topham E, Mcmillan D, Bradley S and Hart E [Submitted for publication]
[34] Jiang L, Xiang D, Tan Y, Nie Y, Cao H, Wei Y, Zeng D, Shen Y and Shen G 2018 Journal of Cleaner
Production 180846–857