Research Article
Spatial
(
Artistic
)
Networks: From Deconstructing
Integer-Functions to Visual Arts
Ernesto Estrada
1and Puri Pereira-Ramos
21Department of Mathematics & Statistics, University of Strathclyde, 26 Richmond Street, Glasgow G1 1HQ, UK
2PeRArt Studio, Murgas 4, 15822 A Coruna, Spain
Correspondence should be addressed to Ernesto Estrada; [email protected]
Received 19 September 2017; Accepted 9 December 2017; Published 17 January 2018
Academic Editor: Gerard Olivar-Tost
Copyright © 2018 Ernesto Estrada and Puri Pereira-Ramos. This is an open access article distributed under the Creative Commons Attribution License, which permits unrestricted use, distribution, and reproduction in any medium, provided the original work is properly cited.
Deconstructivism is an aesthetically appealing architectonic style. Here, we identify some general characteristics of this style, such as decomposition of the whole into parts, superposition of layers, and conservation of the memory of the whole. Using these attributes, we propose a method to deconstruct functions based on integers. Using this integer-function deconstruction we generate spatial networks which display a few artistic attributes such as (i) biomorphic shapes, (ii) symmetry, and (iii) beauty. In building these networks, the deconstructed integer-functions are used as the coordinates of the nodes in a unit square, which are then joined according to a given connection radius like in random geometric graphs (RGGs). Some graph-theoretic invariants of these networks are calculated and compared with the classical RGGs. We then show how these networks inspire an artist to create artistic compositions using mixed techniques on canvas and on paper. Finally, we call for avoiding that the applicability of (network) sciences should not go in detriment of curiosity-driven, and aesthetic-driven, researches. We claim that the aesthetic of network research, and not only its applicability, would be an attractor for new minds to this field.
1. Introduction
There are multiple connections between networks and the visual arts. The study of graph drawing is an old topic in computer sciences and one of its main goals is the repre-sentation of networks in aesthetically appealing ways [1, 2]. In modern network theory, there have been extraordinary advances in the visualization of giant complex networks, which can be considered as pieces of art by themselves [3]. A different direction is the use of networks as an artistic mean of expression. The artistic work of Tom´as Saraceno is an example of this kind of symbiosis where the author has used spider webs to create a universe of expressions [4]. Other artists melt networks into evocative images of the real-world to produce artistic designs. This is the case of the artist J. K. Rofling who has produced many of these symbiotic images [5]. Some examples of the work of J. K. Rofling are illustrated in Figure 1. Here, we explore a different approach to connect net-works and the visual arts. Essentially, we start from the con-struction of spatial networks based on simple rules, namely,
the location of points in a unit square. However, the coor-dinates of these points are generated by a mathematical transformation of integer numbers that generates artistic patterns on the plane. The inspiration for such transformation of integers and functions based on them comes from the
“poststructuralist”school of philosophy and literary criticism
known as deconstruction. This school started in the late 1960
after the influential book De La Grammatologie (1967) by
the French philosopher Derrida [6]. This school of philo-sophical thinking influenced any areas of intellectual and creative activity including novels, poetry, architecture, the fine arts, and music. In architecture in particular, the term
“deconstructivism”was adopted since the end of the 1980s
[7]. According to Derrida this architectural style“is not simply
the technique of an architect who knows how to deconstruct what has been constructed but a probing which touches upon the technique itself, upon the authority of the architec-tural metaphor and thereby constitutes its own architecarchitec-tural rhetoric”(cited by Hoteit in [7]).
(a) (b)
Figure 1: Two of the works produced by J. K. Rofling and taken from [5] with permission of the artist. (a) The Trand. (b) The Guys.
(a) (b)
Figure 2: (a) City of Capitals in Moscow IBC, Russia. (b) Diagram of City of Culture of Galicia, Santiago de Compostela, Spain, by Peter Eisenman.
We do not pretend here to make a complete analysis of the deconstructivism in architecture but mainly of having a basic idea of its principles to be applied beyond its original fron-tiers. We then notice that the architectural deconstructivism looks initially as a fragmentation of the buildings which lack any visual logic. However, the deconstructing work accounts not only for this fragmentation but also for keeping a “memory” of the original composition in such a way that it “remembers” what it was in the beginning, that is, a building. In the City of Capitals in Moscow IBC, Russia, which is illustrated in Figure 2(a), the building is deconstructed into
its unit block, that is, a cube, which is them“multiplied” to
create again a tower with a different shape as the traditional ones. Another characteristic of deconstructivism is that the whole work must superimpose elements in such a way that
“the design is produced, and the idea follows as its result.”As described by Hoteit [7] one of these examples is the City of Culture of Galicia, Santiago de Compostela, Spain, designed
by Eisenman. According to Hoteit [7]“Eisenman was mostly
known for using the superimposition of layers.”In his creation
of the City of Culture of Galicia“Eisenman determined the
following four local traces: The downtown’s historical street grid; the typography of a hill; the abstract Cartesian grid; and the symbol of the city of Santiago, which is the scallop shell. Then, he superimposed these four abstracted traces to create an imaginary site condition, which became a real site for his project”(see also [8]). This idea is illustrated in Figure 2(b).
[image:2.600.147.453.297.486.2]visual arts. This includes among others knots [9, 10], mosaics and tiles [11, 12], Fourier series [13], topological tori [14], and fractal curves [15], all of which produce artistic patterns of undoubtful beauty by themselves.
It can also be argued that some works in the cubism move-ment show elemove-ments of deconstruction. Indeed, analytic cub-ism is seen as an influential stream for deconstructivcub-ism via the work of Frank Gehry. Analytical cubism includes impor-tant paints by Picasso, Braque, Metzinger, and others [16, 17]. Here, again, the principles of fragmenting, integrating, and superimposing are relevant in the analysis of these works [17]. Focusing only on these three principles to understand decon-struction is a clear oversimplification. However, we consider them here as the angular stone for what we will consider in the current work. Here, we are concerned with a formula-tion of deconstrucformula-tion principles in mathematics.
2. Deconstructing Integer-Based Functions
Formulating deconstructivist principles for the whole of mathematics is a too ambitious project for a single paper. Instead, we focus here on integers and functions of integers. Then, the question is how to deconstruct an integer? The first idea should be to consider the individual digits of an integer
as its building blocks. That is, for an integer𝑥written in a
given base𝑏, it is represented by
𝑥 = 𝑎1𝑏𝑛+ 𝑎2𝑏𝑛−1+ 𝑎3𝑏𝑛−2+ ⋅ ⋅ ⋅ + 𝑎𝑛−1𝑏 + 𝑎𝑛, (1)
where𝑎𝑖 ∈ Zare nonnegative integers, which can be
con-sidered as the building blocks of𝑥. For instance, the building
blocks of𝑥 = 2018are 2, 0, 1, and 8. Here the “whole” is
repre-sented by the integer, which in architecture should be the tower. The blocks are the digits forming that whole, like the cubes in the tower.
Now, we should proceed to the “superposition of layers” part. Here, we simply consider the function that sums the
digits of the integer𝑥in the base𝑏[18]:
𝑆𝑏(𝑥) =∑𝑛
𝑖=1
𝑎𝑖=⌊
log𝑏𝑥⌋
∑
𝑘=0
1
𝑏𝑘 (𝑥mod𝑏𝑘+1− 𝑥mod𝑏𝑘) . (2)
For instance, for𝑥 = 2018, the integration will produce
𝑆10(𝑥) = 11. These sequences for different bases𝑏are stored
in theOn-Line Encyclopaedia of Integer Sequences[19, 20]; for
instance, A007953 is the sequence for𝑏 = 10.
In order to complete the deconstruction of the integer we need the “recovery of the memory” of the original object. That
is, we consider the product of the integer𝑥by𝑆10(𝑥)as the
final deconstruction of the integer𝑥[21]:
̂
𝑥𝑏= 𝑥
𝑛
∑
𝑖=1𝑎𝑖. (3)
In this way, we have that a given integer is first dismem-bered into its digits; then the digits are superimposed to each other as the different layers of the integer using the digit-sum function. Finally, we “recover” the memory of the original number by multiplying the integer by its digit-sum. Hereafter,
we consider only the base𝑏 = 10; thus ̂𝑥 = ̂𝑥𝑏. Using this
approach, the deconstructed integers “remember” something
about their original numbers. For instance,19 = 190,̂ 28 =̂
280, 37 = 370,̂ 46 = 460,̂ 55 = 550,̂ 91 = 910, and̂ 82 =̂
820(see sequence A117570 in [19]). However, it does not mean
that𝑥̂𝑏is different for each integer. For instance,75 = ̂̂ 150 =
900.
Let us now extend this approach to any function based on
integers. Let𝑓(𝑥)be a function of the number𝑥, for example,
sin(𝑥). Then, the sum of digit-functions𝑓(𝑥) :̂ Z→Ras the
function defined on the integers, such that ̂
𝑓 (𝑥) = (𝑓 (𝑎1) + 𝑓 (𝑎2) + ⋅ ⋅ ⋅ + 𝑓 (𝑎𝑛)) 𝑓 (𝑥) . (4)
For negative integers −𝑥, if the function 𝑓(−𝑥) exists, we
define ̂
𝑓 (−𝑥) = (𝑓 (𝑎1) + 𝑓 (𝑎2) + ⋅ ⋅ ⋅ + 𝑓 (𝑎𝑛)) 𝑓 (−𝑥) . (5)
We then consider the plot of pairs of functionŝ𝑓(𝑡)and
̂
𝑔(𝑡)for the integers𝑡 ≤ 𝑛/2such that
𝑥 = ̂𝑓 (𝑡),
𝑦 = ̂𝑔 (𝑡). (6)
If the functions 𝑓(𝑡)̂ and ̂𝑔(𝑡) are also defined for
negative arguments we obtain the corresponding transforms
for−𝑛/2 ≤ 𝑡. We are going to use these functions to build
spatial networks as described in the next section.
3. Building Spatial Networks
In this section, we define our strategy for building spatial graphs based on the deconstruction of integer-functions. This strategy is based on the random geometric graphs (RGGs). Thus, we first explain the way in which RGGs are built. The RGG is defined by distributing uniformly and independently
𝑛points in the unit𝑑-dimensional cube[0, 1]𝑑[22]. Hereafter
we consider only the 2-dimensional case. Then, two points are
connected by an edge if their Euclidean distance is at most𝑅,
which is a given fixed number known as theconnection radius.
That is, we create a disk of radius𝑅centered at each node, and
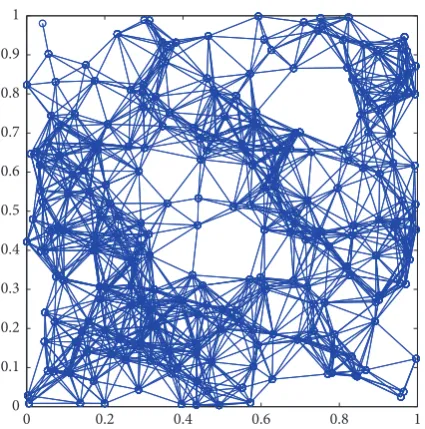
every node inside that disk is connected to the central node as illustrated in Figure 3. A few important structural parameters of RGGs have been determined analytically in the literature (see, e.g., [22]).
Now, let us consider the process𝑇that generates𝑛points
in the unit square according to the transforms of integer-functions defined in the previous section. For instance, let us
consider−1000 ≤ 𝑡 ≤ 1000and make the following
trans-formation.
Transform 1(𝑇1).
𝑥 = ̂𝑡,
𝑦 ={{
{ ̂
sin𝑡, 𝑡 ≤ 0
−̂sin𝑡, 𝑡 > 0.
0.2 0.4 0.6 0.8 1 0
[image:4.600.65.278.69.284.2]0 0.1 0.2 0.3 0.4 0.5 0.6 0.7 0.8 0.9 1
Figure 3: Illustration of a RGG created with 250 nodes embedded into a unit square where the nodes are connected if they are at a Eu-clidean distance smaller than or equal to𝑅 = 0.15.
Notice that we consider the trigonometric functions of
the numbers in degrees not in radians. For instance, sin𝑡
means “sine of𝑡degrees.” Then, we plot every point on the
unit square according to its coordinates(𝑥, 𝑦)defined before
as illustrated in Figure 4(a). Using the approach to construct RGGs described before we construct the network for a given
value of𝑅. That is, after placing the points in the unit square
we center a disk of radius𝑅on each point and connect to
it every other point which is inside the corresponding disk. Here we will use radii which guarantee the connectivity of the graph—the study of the connectivity of these graphs is beyond the scope of the current work. For instance, in
Figure 4(b) we illustrate the network created by using𝑅 =
0.075.
4. Spatial
(
Artistic
)
Networks
It is straightforward to realize that the previously obtained spatial graph (Figure 4(b)) displays a few artistic attributes: (i) biomorphic shape, that is, suggestive in shape of a living organism (a butterfly in this case); (ii) symmetry; and (iii) beauty, just to mention three. The appearance of a biomorphic shape here is just by chance and we have selected in this work only those transforms of integer-functions which produce artistically appealing shapes. However, it must be emphasized that both—beauty and interpretation of shapes—are on the eyes of the beholder, and different observers can see different things in these and other spatial networks created from
integer-functions. Here we coin the name spatial “artistic”
networks(SANs) for the spatial networks created using the previously described method.
Let us now consider other alternatives to the integer-function deconstruction to see which artistic objects we can obtain. Artistic composition is the result of artist cre-ativity and it includes a series of general rules that can be
implemented computationally. Here, we mainly follow a hand-made compositional creation in order to glue series of inte-ger-function transforms into single art works. For instance, let us consider the following parametric equations.
Transform 2(𝑇2).
𝑥 = ̂𝑡,
𝑦 = ̂cos𝑡 + ̂𝑡 ⋅ ̂sin𝑡.
(8)
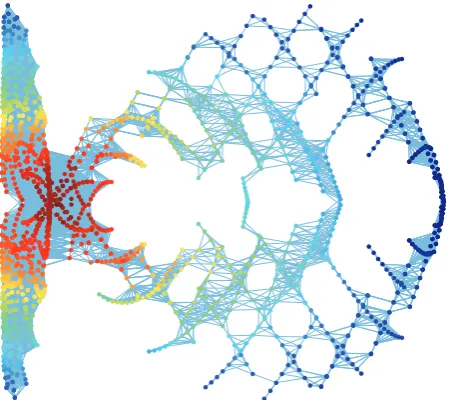
The resulting network for𝑅 = 0.085with𝑛 = 1000points
is illustrated in Figure 5 where we have used −500 ≤ 𝑡 ≤
500and the nodes are colored according to their closeness
centrality.
Transform 3(𝑇3). Another example is obtained by transform-ing the Astroid curve ustransform-ing the integer-digit transform. First,
let us remind the reader that the Astroid is the curve:𝑥 =
cos3(𝑡)and𝑦 =sin3(𝑡). Then, we make the transformation of
the coordinates as explained before, such that we have
𝑥 = (̂cos𝑡)3,
𝑦 = (̂sin𝑡)3.
(9)
The corresponding SAN is illustrated in Figure 6, where
we have used again−1000 ≤ 𝑡 ≤ 1000and the nodes are
colored according to their closeness centrality.
Transform 4(𝑇4). The involute of the circle—𝑥 = cos𝑡 +
𝑡sin𝑡;𝑦 =sin𝑡−𝑡cos𝑡—can also be transformed accordingly
for −1000 ≤ 𝑡 ≤ 1000such that we obtain the following
parametric equations:
𝑥 = ̂sin𝑡 − ̂𝑡̂cos𝑡,
𝑦 = −̂cos𝑡 − ̂𝑡̂sin𝑡,
(10)
which produce the network illustrated in Figure 7.
Transform 5 (𝑇5). Finally, we obtain the integer-function transformation of the cardioid curve, such that
𝑥 = 2̂cos𝑡 + ̂cos(2𝑡),
𝑦 =12coŝ𝑡 − 5 ̂sin(2𝑡),
(11)
where ̂
cos(2𝑡)
= (cos(2𝑎1) +cos(2𝑎2) + ⋅ ⋅ ⋅ +cos(2𝑎𝑛))cos(2𝑡)
̂
sin(2𝑡)
= (sin(2𝑎1) +sin(2𝑎2) + ⋅ ⋅ ⋅ +sin(2𝑎𝑛))sin(2𝑡) ,
(12)
with𝑡 = 𝑎1𝑏𝑛+ 𝑎2𝑏𝑛−1+ 𝑎3𝑏𝑛−2+ ⋅ ⋅ ⋅ + 𝑎𝑛−1𝑏 + 𝑎𝑛represented
in the decimal basis𝑏 = 10. The spatial graph based on this
−0.5
0 0.5
0 2 4
−2 −4
×104
[image:5.600.79.515.72.310.2](a) (b)
Figure 4: Illustration of the process to build a spatial network based on integer-function deconstruction. (a) Distribution of the points obtained from the transform𝑇1on a square. (b) Construction of the spatial graph using a connection radius𝑅 = 0.075with𝑛 =2,000 points and coloring the nodes according to their closeness centrality.
Figure 5: Spatial network constructed from the distribution of points in a unit square according to the transform𝑇2using a connec-tion radius𝑅 = 0.085with𝑛 = 1000points and coloring the nodes according to their closeness centrality.
5. Network Invariants of SANs
[image:5.600.91.256.376.576.2]Here we consider a few invariants of the networks con-structed by using the five transformations previously studied and compare them with the same invariants for the analogous RGG. That is, we construct RGGs with the same number of nodes and connection radius than the SANs created by the previously defined transforms. These invariants are as
Figure 6: Spatial network constructed from the distribution of points in a unit square according to the transform𝑇3using a connec-tion radius𝑅 = 0.1with𝑛 = 2000points and coloring the nodes according to their closeness centrality.
follows: the number of nodes𝑛, the number of edges𝑚, the
edge density𝛿, the maximum degree𝑘max, the average
Watts-Strogatz clustering coefficient𝐶, the global transitivity index
𝐶, average shortest path distance𝑑, network diameter𝑑max,
and the degree assortativity𝑟(for definitions and meaning see
[image:5.600.329.529.378.575.2]Table 1: Graph-theoretic invariants of the spatial “artistic” networks described in Section 4.
𝑇1 𝑇2 𝑇3 𝑇4 𝑇5
SAN RGG SAN RGG SAN RGG SAN RGG SAN RGG
𝑅 0.075 0.085 0.1 0.085 0.1
𝑛 2,000 1,000 2,000 2,000 2,000
𝑚 30,158 33,128 32,286 10,440 129,656 57,287 198,951 42,113 61,217 57,287
𝛿 0.015 0.017 0.077 0.021 0.065 0.029 0.099 0.021 0.031 0.029
𝑘max 117 55 205 39 299 87 581 64 150 87
𝐶 0.618 0.613 0.665 0.608 0.727 0.622 0.642 0.614 0.695 0.622
𝐶 0.217 0.200 0.249 0.198 0.247 0.202 0.264 0.202 0.225 0.202
𝑑 11.16 8.22 7.38 7.59 7.45 6.14 6.08 7.266 11.90 6.14
𝑑max 46 21 39 19 23 15 34 18 33 15
[image:6.600.51.548.91.239.2]𝑟 0.65 0.60 0.75 0.59 0.74 0.61 0.79 0.60 0.68 0.61
Figure 7: Spatial network constructed from the distribution of points in a unit square according to the transform𝑇4using a connec-tion radius𝑅 = 0.085with𝑛 = 2000points and coloring the nodes according to their closeness centrality.
In general, the graph-theoretic properties of SANs are relatively similar to those of the RGGs. However, there are some differences, particularly for the maximum degree and maximum distance. That is, the SANs always have
significantly larger 𝑘max and 𝑑max than the corresponding
RGGs. These two parameters are larger in the SANs as a con-sequence of the higher concentration of points in the center of the figure in relation to their peripheries. This situation is avoided in the RGG due to the random and homogeneous distributions of the points in the unit square. The similarities in terms of clustering coefficients and assortativity—notice that all networks are degree assortative—between SANs and RGGs are remarkable. We, however, are not claiming any application of these graphs for solving problems in the real-world, apart from being a source of artistic inspiration. Then, the analysis of these properties is mostly a curiosity-driven one and not the search for useful properties of these graphs. In the next section, we explore how these networks inspire some art.
Figure 8: Spatial network constructed from the distribution of points in a unit square according to the transform𝑇5using a connec-tion radius𝑅 = 0.1with𝑛 =2,000 points and coloring the nodes according to their closeness centrality.
6. Artistic Inspiration
Science is sometimes seen as a dry and cold activity, such that it is not able to inspire those which are not involved in
it. In earlier definitions of the humanities as “the branches
[image:6.600.317.542.267.467.2](a) (b)
[image:7.600.136.465.73.516.2](c) (d)
Figure 9: Photograph of four artistic works of artist Puri Pereira. (a) “Butterfly # 1” painted in acrylic, ink, and watercolor on paper of dimensions 30×40.5 cm. (b) “Fire on Water” painted in acrylic on canvas of dimensions 45.7×61 cm. (c) “Butterfly # 2” painted in acrylic on canvas of dimensions 45.7×61 cm. (d) “Birds” painted in ink, watercolor, and acrylic on paper of dimensions 30×40.5 cm.
In this part of our work, we present a few snapshots of what an artist can bring from the visual images produced by the SANs obtained from the integer-functions deconstruc-tion presented here. That is, the SANs previously described have been the source of artistic inspiration for the production of purely aesthetic works outside the constraints of (network) sciences. The results are illustrated in Figure 9.
7. On the Artistic Value of (Network) Sciences
Network sciences have an important impact on our under-standing of nature and modern society. Its practical impor-tance has been documented in many papers in the last few years. But network science is also driven by aesthetic criteria.
Advanced Studies in Princeton and its Director from 1930 to
1939—stressed that“institutions of learning should be devoted
to the cultivation of curiosity and the less they are deflected by considerations of immediacy of application, the more likely they are to contribute not only to human welfare but to the equally important satisfaction of intellectual interest which may indeed be said to have become the ruling passion of intellectual life in modern times.”Obviously, there are many pressing problems in modern society that we are aimed to solve using network methods and approaches, and we should never forget our social responsibility. But our institutions should not forget
either that as Flexner remarked “a poem, a symphony, a
painting, a mathematical truth, a new scientific fact, all bear in themselves all the justification that universities, colleges, and institutes of research need or require” [28]. Thus, we should be reminded that (network) science has a humanistic side, which is as important as the many applications that it has found. Forgetting this side of it—its beauty and capacity of surprising—is similar to tear a wing to a bird. We all know that birds with only one wing cannot fly.
8. Conclusions
The spatial artistic networks (SANs) created here are the product of a curiosity-driven process more than of any prac-tical necessity or real-world application. Thus, the value of these networks does not reside in their usefulness as a math-ematical tool for modeling reality but as a source of inspira-tion of artistic work as well as attractive objects per se. We do not discard, however, that such networks can find some appli-cations for modeling spatial processes in the real-world, due to their similarities with RGGs as well as by the fact that the points here are not randomly distributed in space but by using well-defined mathematical rules. The type of high-density core and very sparse periphery reminds one with the situation frequently found in many spatial networks like cities.
Many chemistry students have been motivated to their subject by the beauty of the representations of the molecular structure. In physics, a similar situation exists when we consider the aesthetic of cosmic landscapes and the structure of the universe. Mathematicians always claim to be seduced by the beauty of mathematical equations. Can we attract students into network sciences by appealing to the aesthetic beauty of networks? The only way to know it is by trying. We hope that the current work contributes to this goal, either by attracting curious minds to the field or by inspiring other re-searchers in the field to explore the beauty of networks per se.
Conflicts of Interest
The authors declare that they have no conflicts of interest regarding the publication of this paper.
References
[1] H. C. Purchase, R. F. Cohen, and M. James, “Validating graph drawing aesthetics,” in International Symposium on Graph
Drawing, vol. 1027 ofLecture Notes in Computer Science, pp.
435–446, Springer, Berlin, Heidelberg, 1995.
[2] H. C. Purchase, “Metrics for graph drawing aesthetics,”Journal
of Visual Languages and Computing, vol. 13, no. 5, pp. 501–516,
2002.
[3] M. De Domenico, M. A. Porter, and A. Arenas, “MuxViz: A tool for multilayer analysis and visualization of networks,”Journal of
Complex Networks, vol. 3, no. 2, pp. 159–176, 2015.
[4] http://tomassaraceno.com/. [5] https://www.jkrofling.com/.
[6] J. Derrida, “De la Grammatologie,”de Minuit, 1967.
[7] A. Hoteit, “Deconstructivism: Translation From Philosophy to Architecture,”Canadian Social Science, vol. 11, pp. 117–129, 2015. [8] V. Belogolovsky, “One-on-one: Architecture that leads to a point: Interview with Daniel Libeskind,” pp. 10–12, 2016, http://www.archnewsnow.com/features/Feature369.htm. [9] A. ˚Astr¨om and C. ˚Astr¨om, “Circular knotworks consisting of
pattern no. 295: a mathematical approach,”Journal of
Mathe-matics and the Arts, vol. 5, no. 4, pp. 185–197, 2011.
[10] R. Bosch, “Simple-closed-curve sculptures of knots and links,”
Journal of Mathematics and the Arts, vol. 4, no. 2, pp. 57–71, 2010.
[11] R. Bosch and U. Colley, “Figurative mosaics from flexible Tru-chet tiles,”Journal of Mathematics and the Arts, vol. 7, no. 3-4, pp. 122–135, 2013.
[12] X. Zheng and N. S. Brown, “Symmetric designs on hexagonal tiles of a hexagonal lattice,”Journal of Mathematics and the Arts, vol. 6, no. 1, pp. 19–28, 2012.
[13] F. A. Farris, “Symmetric yet organic: Fourier series as an artist’s tool,”Journal of Mathematics and the Arts, vol. 7, no. 2, pp. 64– 82, 2013.
[14] C. H. S´equin, “Topological tori as abstract art,”Journal of
Mathe-matics and the Arts, vol. 6, no. 4, pp. 191–209, 2012.
[15] J. Briggs,The patterns of chaos: A new aesthetic of art, science,
and nature, A Touchstone Book, Simon & Schuster, USA, 1992.
[16] R. L. Taylor, “Cubism— Abstract or Realist?,” Philosophy and the Visual Arts,” inCubism— Abstract or Realist, pp. 77–95, Springer, Netherlands, Amsterdam, 1987.
[17] D. A. Gall, “Fragments of what? Postmodernism, Hybridity and Collage,”Journal of Art for Life, vol. 5, p. 24, 2014.
[18] L. E. Bush, “An asymptotic formula for the average sum of the digits of integers,”The American Mathematical Monthly, vol. 47, pp. 154–156, 1940.
[19] N. J. Sloane and S. Plouffe,The Encyclopedia of Integer Sequences, Academic Press, 1995, http://oeis.org.
[20] N. J. Sloane, “My favorite integer sequences,” inSequences and
their applications, C. Ding, T. Helleseth, and H. Niederreiter,
Eds., pp. 103–130, Springer, 1998.
[21] E. Estrada and L. A. Pogliani, “A new integer sequence based on the sum of digits of integers,”Kragujevac Journal of Sciences, vol. 30, pp. 45–50, 2008.
[22] M. D. Penrose,Random Geometric Graphs, Oxford University Press, 2003.
[23] E. Estrada, The Structure of Complex Networks: Theory and
applications, Oxford University Press, 2012.
[24] F. J. Rutherford, “A Humanistic Approach to Science Teaching,”
NASSP Bulletin, vol. 56, no. 361, pp. 53–62, 1972.
[25] K. Fenyvesi, “Bridges: A World Community for Mathematical Art,”The Mathematical Intelligencer, vol. 38, no. 2, pp. 35–45, 2016.
[26] http://www.bridgesmathart.org/. [27] http://scholarship.claremont.edu/jhm/.
Hindawi
www.hindawi.com Volume 2018
Mathematics
Journal ofHindawi
www.hindawi.com Volume 2018
Mathematical Problems in Engineering Applied Mathematics Hindawi
www.hindawi.com Volume 2018
Probability and Statistics Hindawi
www.hindawi.com Volume 2018
Hindawi
www.hindawi.com Volume 2018
Mathematical PhysicsAdvances in
Complex Analysis
Journal ofHindawi
www.hindawi.com Volume 2018
Optimization
Journal of Hindawiwww.hindawi.com Volume 2018
Hindawi
www.hindawi.com Volume 2018 Engineering Mathematics
International Journal of
Hindawi
www.hindawi.com Volume 2018
Operations Research
Journal of
Hindawi
www.hindawi.com Volume 2018
Function Spaces
Abstract and Applied AnalysisHindawi
www.hindawi.com Volume 2018
International Journal of Mathematics and Mathematical Sciences
Hindawi
www.hindawi.com Volume 2018
Hindawi Publishing Corporation
http://www.hindawi.com Volume 2013
Hindawi www.hindawi.com
World Journal
Volume 2018Hindawi
www.hindawi.com Volume 2018Volume 2018
Numerical Analysis
Numerical Analysis
Numerical Analysis
Numerical Analysis
Numerical Analysis
Numerical Analysis
Numerical Analysis
Numerical Analysis
Numerical Analysis
Numerical Analysis
Numerical Analysis
Numerical Analysis
Advances inAdvances in Discrete Dynamics in Nature and SocietyHindawi
www.hindawi.com Volume 2018
Hindawi www.hindawi.com
Differential Equations International Journal of
Volume 2018
Hindawi
www.hindawi.com Volume 2018
Decision Sciences
Hindawi
www.hindawi.com Volume 2018
Analysis
International Journal of
Hindawi
www.hindawi.com Volume 2018
Stochastic Analysis
International Journal of
![Figure 1: Two of the works produced by J. K. Rofling and taken from [5] with permission of the artist](https://thumb-us.123doks.com/thumbv2/123dok_us/1378095.91049/2.600.147.453.297.486/figure-works-produced-j-rofling-taken-permission-artist.webp)