1
International vs. domestic bioenergy supply chains for co-firing plants: the
2
role of pre-treatment technologies
3 Caterina Mauro a, Athanasios A. Rentizelas b, Damiana Chinese a,*
4 a Dipartimento politecnico di Ingegneria e Architettura, University of Udine, via delle Scienze 206, 33100 Udine, Italy.
5 b Department of Design Manufacture and Engineering Management, University of Strathclyde, 75 Montrose Street, G1 1XJ, Glasgow, UK
6
7 * Corresponding author.
8 E-mail address: damiana.chinese@uniud.it (D. Chinese)
9
10 Co-firing of solid biomass in existing large scale coal power plants has been supported in many 11 countries as a short-term means to decrease CO2 emissions and rapidly increase renewable
12 energy shares. However, many countries face challenges guaranteeing sufficient amounts of 13 biomass through reliable domestic biomass supply chains and resort to international supply 14 chains. Within this frame, novel pre-treatment technologies, particularly pelletization and 15 torrefaction, emerged in recent years to facilitate logistics by improving the durability and the 16 energy density of solid biomass. This paper aims to evaluate these pre-treatment technologies 17 from a techno-economic and environmental point of view for two reference coal power plants 18 located in Great Britain and in Italy. Logistics costs and carbon emissions are modelled for 19 both international and domestic biomass supply chains. The impact of pre-treatment 20 technologies on carbon emission avoidance costs is evaluated. It is demonstrated that, for both 21 cases, treatment technologies are hardly viable for domestic supply. However, pre-22 treatment technologies are found to render most international bioenergy supply chains 23 competitive with domestic ones, especially if sourcing areas are located in low labour cost 24 countries. In many cases, pre-treatment technologies are found to guarantee similar CO2
25 equivalent emissions performance for international compared to domestic supply chains. 26
27 Keywords: biomass supply chain, international logistics, carbon equivalent emissions, 28 torrefaction, pelletization, bioenergy, co-firing
29
Nomenclature
30 BP Black Pellets
31 BR Brazil
32 C Wood Chips
34 CAPEX Capital Expenditure
35 EC Export Country
36 F Feedstock
37 GB Great Britain
38 HFO Heavy Fuel Oil
39 IT Italy
40 IC Import Country
41 kgd dry kilogram
42 kWhe electrical kilowatt-hour
43 L Long-distance supply chain
44 LHV Lower Heating Value
45 LCOE Levelized Cost of Electricity
46 mc Moisture content
47 MZ Mozambique
48 my Mass Yield
49 OPEX Operational Expenditure
50 S Short-distance supply chain
51 SI Slovenia
52 td dry tonne
53 US United States
54 WP White Pellets
55
56
1 Introduction
61 US, already offer policy incentives or have mandatory regulations to increase renewable’s 62 share in the electricity sector. Some of them also support programs aimed at creating biomass 63 supply chains outside the EU [1,2].
64 In Great Britain the Renewable Obligation (RO) has been one of the main support mechanisms 65 for large-scale renewable electricity projects. Suppliers are obliged to supply a percentage of 66 their electricity from renewable sources, which increases year on year. A penalty is imposed 67 on suppliers who do not meet the targets. Correspondingly, the Office of Gas and Electricity 68 Market (Ofgem) issues Renewable Obligation Certificates (ROCs) to electricity generators in 69 relation to the amount of eligible renewable electricity they generate. In essence, this operates 70 to the effect that suppliers can buy and sell their way out of the renewable requirement. This is 71 the current support mechanism for biomass co-firing and is open for new installations until the 72 year 2017, providing ROCs in eligible operators for a duration of 20 years [3]. In other EU 73 countries, including Italy [4], Germany and Austria [5]no specific incentives for biomass co-74 firing are currently foreseen.
75 While forestry biomass withdrawal in Italy is not sensibly smaller than the EU average, Italy 76 is in the lowest ranks in Europe as to primary energy consumption from solid biomass [6], and 77 heavily depends on imports to meet current demand [7]. The situation in Great Britain is 78 similar, with even smaller contribution of solid biomass to primary energy consumption: 0,22 79 m3 equivalent of pro capita consumption in Italy against 0,10 m3 in Great Britain [8]. Thus, for
80 both countries co-firing could improve their biomass contribution to the renewable national 81 energy production and utilization mix, provided that imports, even from distant countries, are 82 economically feasible and overall sustainable. Demonstrating the economic and environmental 83 performance of long distance biomass supply chains for large scale plants is a challenge for 84 policy makers and for energy companies, faced with economic risk of supply as well as with 85 social acceptance issues, especially in countries with less experience in biomass use, such as 86 Italy and Great Britain [9]. However, to the best of the authors’ knowledge, comparative 87 assessments of local and overseas supply chains can be hardly found in literature, with the 88 exception of [10], which dates back to 2005.
93 which consists of a thermal treatment process in which the biomass material is subjected to a 94 temperature in the range of 200–350°C in reducing or possibly slightly oxidative atmosphere, 95 during a sufficiently long residence time [12]. Previous research has identified some 96 advantages and issues of torrefaction, particularly in comparison to pelletization, as 97 summarized in Table 1.
98 Table 1 Comparison of torrefaction and pelletization pre-treatment technologies.
99 The limited experience with torrefaction at pilot and industrial scale is the major concern about 100 this technology. On the other hand, Table 1 shows that, compared with traditional wood pellets, 101 the combined torrefaction and pelletization process has significant potential advantages; in 102 particular, the enhanced bulk and energy density results in more efficient transportation. Better 103 mechanical and hydrophobicity properties further reduce the need for expensive storage 104 solutions. Hence, torrefaction in combination with pelletization has the potential to improve 105 the economic performance of long distance biomass supply chains, provided that the additional 106 CAPEX and OPEX of this emerging, energy intensive technology are compensated by 107 corresponding cost savings in the logistics [18,19].
108 The role of pelletization in long distance biomass logistics has been investigated by several 109 authors [20,21], also in comparison with other pre-treatment alternatives such as pyrolysis and 110 considering regional and overseas supply chains [10,22]. On the other hand, only recent studies 111 compare torrefied pellets (also called black pellets) with traditional pellets (white pellets), 112 considering long distance logistics case studies [23–26] and introducing a supply chain 113 configuration perspective [19,27]. For this reason,Ehrig et al. [5], who first demonstrated that 114 long distance solid biomass supply for co-firing could be a viable GHG reduction policy option 115 for the EU, call for additional research on supply chain configurations and economics, as well 116 as on the environmental impact of torrefaction, since only white pellet supply chains are 117 investigated in their study.
118 This paper contributes to fill these research gaps by aiming to investigate:
119 1. how torrefaction at biomass sourcing sites may affect the economic and carbon 120 equivalent emission performance of long distance supply chains;
124 For this purpose two cases of reference plants will be examined in different national contexts, 125 i.e. Italy and GB, as those countries are characterized by low shares of solid biomass in the 126 primary energy mix and therefore have a high potential for increase. International and local 127 biomass supply chain scenarios are configured, i.e biomass flows and properties are quantified, 128 capacities and input-output flows of treatment plants are determined both for long and short 129 distance supply chains, as well as collection, transportation and storage requirements. For long 130 distance supply chains black pellets and white pellets scenarios are considered, whereas for 131 short distance supply chains wood chips are also evaluated. Section 2 describes the case studies 132 discussed in this paper. Alternative supply chain configurations are modelled on a spreadsheet 133 simulation model as illustrated in section 3, which presents the economic and environmental 134 parameters used as model inputs for the two case studies. In section 4, the least cost 135 configurations for international and local supply chains are evaluated, and the performance of 136 short and long distance supply chains is compared, considering also their contribution to the 137 economic and environmental performance of produced electricity and corresponding costs of 138 CO2 avoidance. In section 5, the sensitivity of the model results to the most influential uncertain
139 parameters is analysed, while general conclusions and directions for future research are derived 140 in section 6.
141
2 Case studies
142 To enable comparison of long distance (L) and short distance (S) supply chains delivering 143 biomass to large coal co-firing plants in a global context, two reference co-firing plants in GB 144 and Italy were selected as end users. The location of the base reference plant is assumed to 145 coincide with existing plants in GB (Drax Power Station in Selby) and in Italy (A2A power 146 station in Monfalcone). The Selby power station has already converted several of its units to 147 use biomass pellets, it is the biggest in GB and is located near to the port of Immingham, an 148 important harbour for pellets trade. In Italy, Monfalcone is selected as a coal power plant of 149 comparable size as Selby, and because of technically successful past experiences of co-firing.
150 Both reference co-firing plants are modelled with the same reference capacity to enable a fair 151 comparison of results. The reference capacity has been fixed at 600 MW, which is in 152 accordance with reference values often used in literature [28,29] and reflects industrial practice, 153 as it is very close to the real capacity of a single unit in Selby (645 MW according to [30]) and 154 the overall capacity of Monfalcone (664 MW according to [31]).
156 The long distance international supply chain options examined are mapped in Figure 1.
157 Figure 1 Representation of import & export countries and shipping routes.
158 The green dots represent the location of import harbours, i.e. Immingham for Selby and port 159 of Koper in Slovenia, for Monfalcone. In both cases, energy conversion plants are situated 160 within 50-70 km from the harbours. Figure 1 also shows the exporting countries selected and 161 the respective harbours considered for long-distance biomass supply, i.e. Brazil (port of 162 Belem), South East US (port of Savannah) and Mozambique (port of Nacala). These choices 163 are in agreement with the selection criteria proposed in [2] and [27]. Export as well as import 164 ports are large ports with existing terminals for wood pellets or at least other biomass or wood 165 products. South America and Africa are widely expected to become significant exporters of 166 biomass to the EU. A future high level of EU biomass demand is expected to result in 167 investments in pellet plants, short rotation crop and tree plantations, such as eucalyptus, in 168 regions such as Brazil, Uruguay, West Africa and Mozambique [2]. Similar considerations are 169 presented in [1], where the expectations are that up to 5% of total biomass use in 2020 could 170 be sourced by international trade, with North America, Africa, Brazil and Russia as the major 171 suppliers.
172 For the European countries of concern data on forest biomass distribution is available from 173 National Inventories, particularly [32,33] for softwood availability in Scotland, [34] for 174 biomass from arboreal origins in different Italian provinces, and [35] for the allowable cut of 175 forestry biomass in Slovenia. Available data on technical biomass withdrawal potentials were 176 imported in ArcGis, and used first to build up a supply area, gradually including locations 177 farther to the plant once the potential of the closest ones was exhausted. Secondly, ArcGis was 178 used to determine a weighted median centre, where the reference location of the centralized 179 collection point was set, and to calculate the average transport distance from the withdrawal 180 area to the collection point. This approach allows to estimate the proportion of national territory 181 needed to feed reference plants with local forest biomass. For regional supply, limitations in 182 European forest biomass potentials lead to remarkable average distances from centralized 183 collection points to power plants: 443 km for Scotland, 275 km for Northern Italy, and 153 km 184 for Slovenia.
185
3 Supply chain modelling
188 both short and long distance supply chain types, while wood chips (C) are examined only in 189 short distance supply chains. In fact, previous studies [26,36,37] concluded that wood chips 190 are not economically viable on long distance supply chains, and a preliminary evaluation for 191 the case studies of concern led to similar results.
192 Figure 2 Structure of long and short distance supply chain scenarios for C, WP and BP.
193
194 To model the supply chain structures represented in Figure 2 for the case studies at hand, a 195 spreadsheet based simulation model was developed to evaluate energy and mass flow balances, 196 properties of feedstock, costs and CO2 equivalent emissions of alternative supply chain
197 configurations. A supply chain configuration is defined for the purposes of this work as a 198 combination of one of the supply chain structures presented in Figure 2 with a particular 199 biomass origin and destination country. The inputs and output parameters of the simulation 200 model are reported in Figure 3 for each supply chain stage, with reference to long distance 201 supply chains only for simplicity of representation. A simplified version of Figure 3 applies for 202 short distance supply chains, where port logistics and overseas transport stages are omitted and 203 chipping is considered as the treatment option. Inputs and outputs for common stages between 204 long and short distance supply chains are the same.
205 Figure 3 I/O diagram of long distance supply chain.
206 The output of every stage of the supply chain consists of:
207 an economic evaluation of the CAPEX and OPEX related to the single stage activity 208 considered (e.g. chipping, handling, storage);
209 an environmental assessment (in terms of kgCO2eq) related to the single stage activity
210 consumption of fuel (electricity, diesel, HFO or natural gas).
211 At the end all the output results of every single stage are added to obtain the total cost and 212 emissions of the supply chain.
213 The simulation model is based on following assumptions:
214 Mass losses for the supply chain stages are adapted from [5,10,20,21], while mass yield 215 of torrefaction and pelletization processes is derived from [24].
219 in biomass direct co-firing in order to ensure seamless biomass conversion together 220 with coal in the coal utility boiler.
221 Fuels represented in Figure 3 vary depending on supply chain stage. Diesel and 222 electricity are considered for handling and storage. Trucks are fuelled with diesel, trains 223 use electricity or diesel fuel depending on locally available infrastructure, and ships 224 operate on HFO. For all pre-treatment options, except for the torrefaction process, 225 drying is considered to be fuelled with biomass, rather than with fossil fuels, as in [5]. 226 In the case of torrefaction, extra thermal power to support drying and torrefaction 227 processes is being put into the process partly by natural gas and partly by combustion 228 of extra feedstock, as reported in [39]. When the pre-treatment is pelletization, only 229 electricity emissions are considered as the combustion of biomass for drying is 230 considered renewable, while in the case of torrefaction emissions from electricity and 231 natural gas are considered. Emission factors are derived from [40] for diesel and HFO, 232 from [41] for natural gas, and from [42–44] for electricity generation in each country. 233 The assessment of electrical efficiency reduction due to biomass co-firing is based on 234 the evaluation performed for black pellets by [25], who, like [24], assume that 235 combustion efficiency for black pellets equals that of white pellets combustion.
236 It is also assumed that wood chips combustion is performed at the same efficiency as 237 pellets. Since some authors [45,46] claim that black pellets combustion efficiency may 238 be higher than white pellets or wood chips combustion, this assumption is conservative, 239 and the adopted values tend to favour chips and white pellets over black pellets.
240 The final supply chain stage analysed in this work is pulverising the biomass delivered 241 at the co-firing plant and feeding it to the boiler. To define and calculate biomass 242 requirements, direct co-firing is selected among the various available technologies [47]. 243 For direct co-firing, biomass is pre-mixed with coal, and the fuel blend is fed to the 244 furnace using the existing firing equipment, i.e. without significant additional 245 investments. As a consequence, this technology is the most popular [37,41] and has 246 therefore been selected for this study. A limitation of direct co-firing is in the share of 247 biomass which can be treated, i.e. only percentages up to approx. 5-10% on an energy 248 basis. For this reason, a 8% co-firing rate was assumed in this paper, which is in line 249 with similar analyses in literature [48].
253 feeding in the boiler. On the other hand, black pellets have properties that closely match 254 those of low-grade coal [23]. This allows using the same equipment at the co-firing 255 plant and, as a consequence, no additional investment cost for milling [14,16,49].
256 Data and sources about the co-firing plants are reported in Table 2.
257 The properties of wood chips before drying, mainly considered for short supply chains and 258 available at the roadside are reported in Table 3, while the properties of treated biomass (WP, 259 BP and dried C) are summarized in Table 4.
260 Table 2 Reference co-firing plant characteristics.
261 Table 3 Properties of biomass before treatment, after chipping at the roadside.
262 Table 4 Properties of pellets (short and long supply chain) and chips (only short supply chain) after treatment.
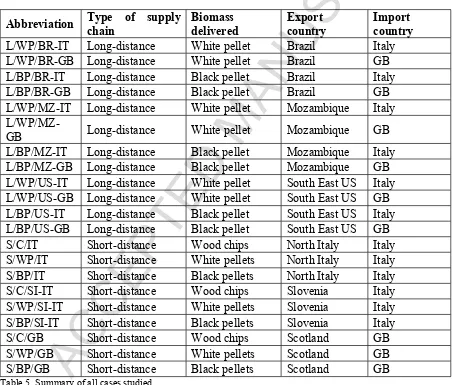
263 Transportation pathways and relevant cost models were implemented separately for each 264 supply chain configuration. For each power plant location, international long distance supply 265 chains from Brazil, Mozambique and South US are modelled. For short distance supply 266 alternatives, the forests of Scotland are chosen for supplying Selby, while for Monfalcone two 267 alternative sourcing areas are considered for local supply, i.e. Northern Italy and Slovenia. 268 Combining all sourcing and pre-treatment options examined yields 20 alternative configuration 269 scenarios, described in Table 5, where ISO codes are used as abbreviations for country names.
270 Table 5 Summary of all cases studied.
271 3.1 Long-distance supply chains
272 The long-distance supply chain scenarios are based on the following assumptions:
273 As feedstock is considered available at the roadside, the feedstock cost includes 274 harvesting, collection and, if specified, also storage. Feedstocks considered are based 275 on the prevalent biomass sources in each supply country: hardwood (eucalyptus) for 276 Brazil and Mozambique, softwood for US.
277 Biomass is chipped at the roadside and then transported to the pre-treatment facilities. 278 Different first transport stage options are assumed depending on regional infrastructure 279 conditions: for Brazil, transport to the port is done by truck for an average assumed 280 distance of 100 km [10], while in South US and Mozambique biomass transfer is a 281 combination of truck (20 km) and diesel train (100 km), in agreement with the 282 assumptions by [55–57] for the same or similar countries.
284 For overseas shipping, a handymax bulk carrier with capacity of 45000 t and 56250 m3
285 is used, as this is a ship type that can access smaller ports and usually has on-board 286 loading capability. Due to the lower bulk density of pellets compared to the marginal 287 cargo density of the ship (800 kg/m3), volume is the restrictive factor in the sea
288 transportation stage, leading to suboptimal utilisation of the ship weight capacity. 289 The sea transportation cost has been calculated analytically as a time charter by adding 290 a daily charter rate, the fuel cost and other major operational costs (port and canal fees)
291 [25].
292 Once arriving at the import ports, the ship is unloaded and the pellets are transferred to 293 the reference coal power plant by electric trains.
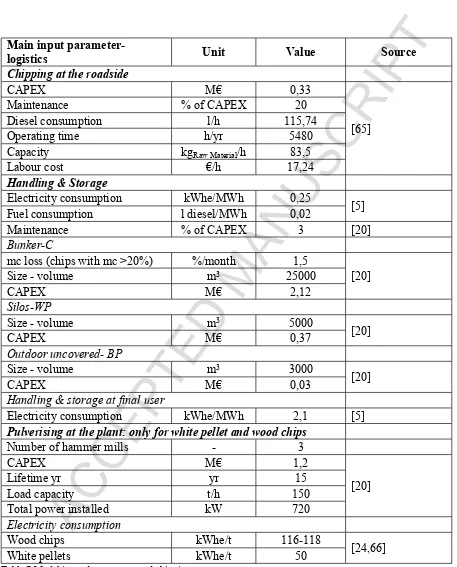
294 Economic, technical and environmental input data used for the logistics model are summarized 295 in
296 Table 6,
297 Table 7 and Table 8 respectively. All costs and prices, collected from several sources and in 298 various currencies, are first converted in Euro using the average yearly exchange rates from 299 [58] and then adjusted in 2016 values using the industrial producer price index [59].
300 The average shipping distance between export and import ports is reported in
301 Table 9.
302 Table 6 Model input data: transport parameters.
303 Table 7 Model input data: storage and chipping parameters.
304 Table 8 Model input data: electricity emission factors, biomass and fuels prices.
305 Table 9 Average distance between the ports in nm (nautical miles) and km.
306
307 3.2 Short-distance supply chains
308 To configure short supply chains it is assumed that:
309 Pelletization and torrefaction pre-treatment options are performed at a centralized 310 collection and storage point before the transportation to the final user.
313 Costs and emissions for harvesting, collection and first handling incorporate truck 314 transport to local collection points, where pre-treatment is performed.
315 The transportation mode from the collection point to the co-firing plant is selected 316 depending on locally available infrastructure: thus, rail transport (electric train) is 317 selected for Scotland and road transport (diesel truck) for both supply from Slovenia
318 and North Italy.
319 Alternative configurations are also possible and could be considered in a spatially explicit 320 analysis of local supply, which is however beyond the scope of current paper. The 321 simplifications introduced here are deemed as conservative for the sake of local vs international 322 comparison in that they tend to minimize costs and impacts of short supply chains.
323
4 Results and discussion
324 Economic and carbon emissions analysis has been performed for all supply chain configuration 325 scenarios studied. The costs and the emissions associated with the supply chain are reported 326 with respect to GJ of biomass delivered. In order to address the three main research questions 327 and to facilitate presentation of the results for the 20 scenarios, the analysis focuses first on 328 long distance supply chains, to assess whether torrefaction is economically and 329 environmentally justifiable compared to pellets and to determine the best performing supply 330 chain scenarios. Secondly, short supply chains are studied to establish which supply form (WP, 331 BP or C) is preferable for each case. Finally, the best performing short and long distance options 332 are compared to highlight the relationship between long and short distance supply alternatives.
333 4.1 Long distance supply chains
334 In order to have the same amount of thermal energy input for a co-firing plant with 8% of 335 biomass on an energy basis, the quantity of biomass delivered at the final user changes 336 depending on its energy content.
344 Table 10 Initial and final biomass flows.
345 4.1.1 Cost breakdown and comparison
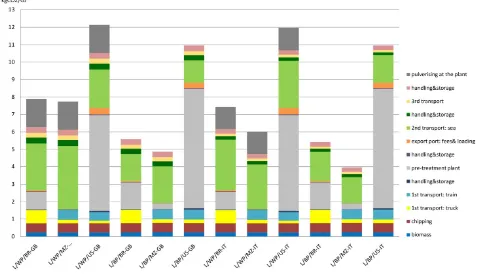
346 In Figure 4, costs per GJ of biomass delivered are presented. The major contribution to the total 347 supply chain cost is represented by cost of the biomass at the roadside (particularly in the US) 348 and pre-treatment (especially for black pellets and in export countries with higher electricity 349 costs).
350 Ship transport and export fees are the third highest cost element. These are significantly 351 reduced for BP, compared with WP, due to higher energy density that leads to better utilisation 352 of the ship cargo space. A major cost reduction in BP supply chains comes from removing the 353 need for dedicated milling at the power station. The reduction in these three cost components, 354 namely ship transport, export fees and milling at destination, compensates for the additional 355 pre-treatment costs associated with the BP process. As a result, both for Italy and Great Britain 356 and from all import countries, BP are the least cost option for biomass logistics, with savings 357 ranging between 8,3 % (for L/BP/US-IT) and 12,2% (for L/BP/BR-GB) compared with the 358 respective WP supply chains.
359 Figure 4 Cost breakdown for WP and BP on long distance supply chains.
360 These economic results whereby BP is less costly than WP in long distance supply chains are 361 in agreement with the conclusions of [26,27,37].
362 As to country dependent differences, the examined supply chains have a comparable 363 economical behaviour, with differences between L/WP and L/BP in the range of 12,23% and 364 10,75% respectively for BR-GB and BR-IT, 10,72 % for MZ-GB, 8,79 % for MZ-IT, 9,51% 365 and 8,30% respectively for US-GB and US-IT. The best economic performance for supplying 366 Italy is BP from Mozambique due to lower cost of biomass and electricity (Table 8), which 367 affects operational costs of pre-treatment. Indeed, although the additional cost of passing 368 through the Suez Canal has been incorporated in shipping costs, the cost of shipping from MZ 369 to IT is comparable with the ones of L/BP/BR-IT and L/BP/US-IT thanks to the shorter 370 shipping distance (
371 Table 9). The least cost long-distance supply chain to GB is the one supplying BP from Brazil.
374 4.1.2 Environmental impact breakdown and comparison
375 Pre-treatment and sea transportation are also the phases with the highest impact on the CO2
376 equivalent emissions of long distance supply chains, as highlighted inFigure 5. In the case of 377 white pellets, also pulverisation at final plant has a significant impact, especially in Great 378 Britain due to the higher carbon emission factor for electricity generation (see Table 8). 379 International differences in electricity related emission factors remarkably affect the 380 environmental impact of pre-treatment, particularly of the energy intensive torrefaction and 381 pelletization process.
382 Figure 5 Emission factor breakdown for WP and BP on long distance supply chains.
383 Figure 5 shows that the emissions of the supply chain from US are significantly higher than 384 from other supply locations, because of considerable indirect emissions associated with pre-385 treatment. The reason is that the electricity mix of US is based mainly on fossil fuels while the 386 electricity produced in Mozambique and Brazil comes mostly from hydroelectric energy, 387 which leads to a much lower electricity emission factor (Table 8). For this reason, Mozambique 388 is the best sourcing area for both Italy and Great Britain from a carbon emissions perspective, 389 followed by Brazil.
390 As a whole, the higher number of sea trips required yearly for WP compared to BP because of 391 the lower density of WP, and subsequent sub-optimal utilisation of the ship cargo capacity, is 392 such that additional environmental impact associated with the torrefaction process is 393 compensated by lower sea transportation impact both in the Brazil and Mozambique cases. 394 Also for supply chains of US origin, BP are preferable to WP, but this is mainly due to 395 additional emissions for pulverising white pellets at the plant before co-firing them, rather than 396 to gains in sea transportation and handling at the port related emissions alone. Thus, for all the 397 long distance supply chains considered, delivering BP appears preferable to WP not only from 398 an economic but also from an environmental point of view.
406 variations in the environmental impact of long distance supply chains depending on origin and 407 destination.
408 4.2 Short distance supply chains
409 For short distance supply chains there is mixed evidence in the literature about the utility of 410 pre-treatment [10,26,47]. The advantages of pre-treatment in terms of handling, transportation 411 and storage and the related efficiency gains are less profound in short transportation distances. 412 Thus an economic and environmental comparison among wood chips, black and white pellet 413 short distance supply chains is performed.
414 4.2.1 Cost breakdown and comparison
415 As shown in Figure 6, the purchasing cost of biomass has the highest share on total costs, 416 particularly in Italy. The situation in Great Britain (Scotland) is more favourable, while 417 Slovenia seems the least cost regional sourcing option for Italy with any pre-treatment method.
418 Due to the low bulk density of wood chips, the stages of transport, handling and storage highly 419 affect the costs of the wood chips (C) supply chain compared to pelletization based options. 420 Nevertheless, because of high electricity costs in all short distance supply countries, pre-421 treatment is expensive and additional costs are not compensated by efficiency gains in logistics. 422 Therefore C are less expensive than pellets in all the short distance supply chains examined. 423 Differences between WP and BP delivered costs are minimal.
424 Figure 6 Cost breakdown for WP, BP and C on short-distance supply chains.
425 4.2.2 Environmental impact breakdown and comparison
436 nevertheless be stressed that, from an economic viewpoint, C remain the least cost option even 437 for the S/SI-IT supply chain.
438 Figure 7 Emissions factor composition for WP, BP and C on local supply chains.
439 As a conclusion, in short distance supply chains the best option, both from an economic and an 440 environmental perspective, is to deliver biomass as wood chips, irrespective of the 441 geographical context. Therefore, wood chips will be considered as the reference short distance 442 biomass supply chain for the comparison with long distance supply chains. For the case of 443 Italy, wood chips from Slovenia will be considered as a reference, due to the lowest cost and 444 lower emissions compared to supply from northern Italy.
445 4.3. Long vs short-distance supply chains
446 As a result of the previous discussions, a comparison between the best performing long- 447 distance supply chains (BP) with the short-distance supply chains (C) is performed.
448 4.3.1 Cost comparison between L/BP and S/C
449 Figure 8 enables comparison of least cost options for the best performing short and long 450 distance supply chains, which is C and BP respectively. It appears that BP long distance supply 451 chains have lower biomass delivered cost compared to local C supply chains. Despite the higher 452 overall transportation and handling cost, as well as significant pre-treatment cost, BP supply 453 chains benefit from the lower biomass price and lack of additional milling requirement 454 compared to C supply chains. It appears that the introduction of torrefaction makes long 455 distance supply options considerably more competitive to short distance supply chains in both 456 geographical contexts. For Great Britain, the best option appears to be to supply BP from Brazil 457 that reduces cost by 0,83 €/GJ compared to the best C option. For Italy, the cost difference 458 between the least cost long distance supply chain from Mozambique is significantly more 459 profound compared to the local C supply from Slovenia, amounting at 1,77 €/GJ.
460 Figure 8 Cost structure comparison of international (BP) vs. local (C) supply chains.
461 4.3.2 Environmental impact comparison between L/BP and S/C
467 factors of Italy and GB increase the emissions of the milling stage in the case of delivering 468 wood chips, while low emission factors in Brazil and Mozambique limit the environmental 469 impact of energy intensive pre-treatment options such as torrefaction and pelletization. 470 Ultimately, it is shown that long-distance biomass supply chains can lead to reduced 471 greenhouse gas emissions of the overall supply system compared to short-distance alternatives, 472 despite the increased transportation and processing involved, when the supply locations benefit 473 from high availability of renewable energy.
474 Figure 9 Emission factor comparison of international (BP) vs. local (C) supply chains.
475 4.4 Competitiveness of co-firing and carbon dioxide abatement cost
476 In order to compare co-firing of biomass from various origins with other decarbonisation 477 options for electricity generation, a useful figure of merit is the Carbon Dioxide Abatement 478 Cost (CDAC). The CDAC can be regarded as the minimum incentive to be paid per unit of 479 carbon equivalent emission avoided (€/tCO2eq, similarly to EU ETS allowances and any form
480 of carbon credit) in order to make a renewable or low carbon energy source competitive with 481 its fossil alternative [52,53]. In particular, the CDAC of biomass co-firing equals the incentive 482 for every unit of carbon equivalent emission avoided by co-firing that would make the 483 corresponding levelized cost of electricity (LCOE, as defined in [52]) equal to the LCOE 484 obtained from the same plant, when firing only coal.
485 In mathematical terms, the CDAC of co-firing is calculated with Eq. 1 (adapted from [53]), 486 where E stands for emissions in tCO2/kWh, C for combustion and SC for supply chain.
487 𝐶𝐷𝐴𝐶=
(
𝐿𝐶𝑂𝐸𝑐𝑜𝑓𝑖𝑟𝑖𝑛𝑔‒ 𝐿𝐶𝑂𝐸𝑓𝑖𝑟𝑖𝑛𝑔)
(
𝐸𝑓𝑖𝑟𝑖𝑛𝑔‒ 𝐸𝑐𝑜𝑓𝑖𝑟𝑖𝑛𝑔)
𝐶+
(
𝐸𝑓𝑖𝑟𝑖𝑛𝑔‒ 𝐸𝑐𝑜𝑓𝑖𝑟𝑖𝑛𝑔)
𝑆𝐶
[
€𝑡𝐶𝑂2
]
(1)488 The first term of the denominator in Eq. 1 expresses the difference in emissions level from 489 combustion at the power plant, calculated as the amount of coal burned in the coal firing and 490 the co-firing scenarios annually multiplied by the emissions factor of coal combustion (2110 491 kgCO2eq/t [25]) and then divided by the respective amount of electricity generated annually to
492 reflect the effect of de-rating when co-firing biomass. Biomass does not contribute to the CO2
497 supply chain, emissions have been calculated analytically for each stage of the supply chain 498 (see Figure 3), considering the fossil fuel and electricity use, multiplied by the respective 499 emissions factor. For the co-firing scenario, the total supply chain emissions consist of both 500 coal and biomass supply chain emissions for the respective amounts of each fuel used. All 501 emissions have been divided by the amount of electricity generated in each scenario. Regarding 502 the numerator of Eq. 1, LCOE of the firing plant is the total annual cost of coal needed in a 503 firing plant with 600 MWe output gained only from coal combustion divided by the total annual 504 electricity produced. LCOE of the co-firing plant is instead the sum of total annual coal cost 505 and biomass cost at the plant gate (assessed in this work), divided by the total annual electricity 506 produced.
507 Figure 10 illustrates the emissions reduction in the cases studied (8% biomass co-firing) 508 compared with a coal firing system with the characteristics of the base reference plant reported 509 in Table 2. In other words, Figure 10 illustrates the denominator of Eq. 1 for the case of concern 510 expressed in percentage terms.
511 Figure 10 CO2eq emissions reduction with 8% co-firing compared to coal-firing plant.
512 These results show that co-firing is environmentally better than coal firing regardless of the 513 type and origin of biomass used. From an emissions reduction viewpoint, the best case for long 514 distance supply chains is L/BP/MZ-IT; indeed, the logistics from Mozambique to Italy have 515 the lowest emissions. The best scenario among short-distance supply chains is BP delivered 516 from Slovenia (S/BP/SI-IT). While differences between different supply chains are significant 517 in relative terms (e.g. carbon equivalent emissions associated with L/BP/MZ-IT supply chain 518 are about 1/3 of L/WP/US-IT, see Figure 5) and logistics chains are virtually the only cause of 519 net carbon emission associated with bioenergy, it should be observed that their carbon 520 equivalent impact is nevertheless an order of magnitude lower compared with that of coal, 521 which is in the order of ca 90 kgCO2eq/GJ of delivered chemical energy [81] against 4-13
522 kgCO2eq/GJ as calculated for various solid biomass supply chains in the present work. As a
523 result, substituting coal with biomass always leads to a considerable reduction in carbon 524 emissions, in the order of 7 - 7,7% in relative terms for an 8% co-firing ratio, which in absolute 525 terms for the reference plant would mean a notable range of avoided emissions between ca 285 526 - 309 ktCO2eq/year depending on the biomass supply chain adopted.
529 carbon emission abatement costs point of view, BP is the best option for long distance supply 530 chains with a CDAC cost range of 40-55 €/tCO2eq, while wood chips have the lowest CDAC
531 for short distance supply chains (50-60 €/tCO2eq). The CDAC of international supply chains
532 originating in Brazil and Mozambique is slightly lower than that of local supply chains even 533 when using WP, but when BP is introduced long distance supply chains become even more 534 efficient.
535 Nevertheless, the required incentive is high in all cases if one considers that, current carbon 536 prices within the EU ETS are around 5-10 €/tCO2 [82], and, even considering future scenarios
537 proposed by [83], maximum expected carbon prices equal 32 €/tCO2 for Italy and 24-27 €/tCO2
538 for GB in 2020. Dedicated additional support schemes are therefore needed in any case to 539 promote bioenergy in the form of co-firing.
540 Figure 11 Carbon dioxide abatement costs of 8% co-firing at plants of all scenarios studied.
541
5 Sensitivity analysis
542 In order to evaluate the potential impact of uncertainty on the most influential parameter values 543 to the findings of this work, the results have been subjected to sensitivity analysis.
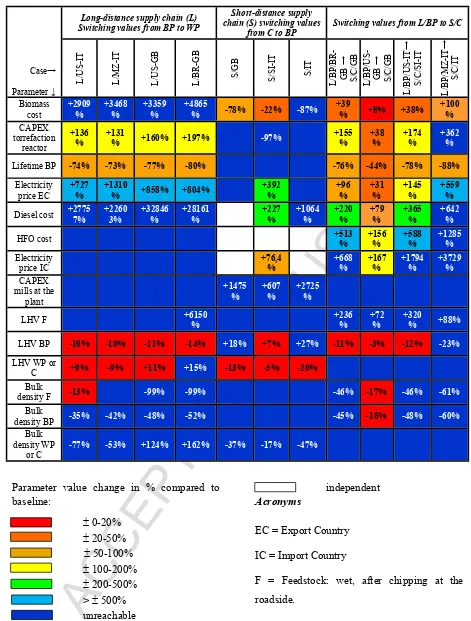
544 In particular, the main research focus is on the potential economic and environmental benefits 545 of BP over WP (for long distance supply chains) or over supply of wood chips (for local supply 546 chains). It has been demonstrated that, under the conditions considered, for all long distance 547 supply chains BP are preferable to WP, and for most short distance supply chains wood chips 548 are preferable to BP, both from an economic and a carbon emissions viewpoint. To quantify 549 the dependence of these results on input parameters, it was chosen to determine switching 550 values, i.e. the level of uncertain parameters that determine a reversal in this relationship. 551 Similarly, since it was also found that some long distance BP supply chains are preferable to 552 short distance wood chips supply, it was decided to determine switching values also for this 553 relationship.
554 The switching values for supply chain costs are reported in Table 11 and for supply chain 555 CO2eq emissions in Table 12, respectively. To enable comparison, they are represented as the
560 the most sensitive results. White cells represent parameters that are not relevant to the particular 561 supply chain and therefore cannot affect the switching decision (e.g. in Table 11, HFO price in 562 short supply chains). Parameters in light blue or green, with percentage variation ranges greater 563 than 200%, indicate limited sensitivity on the cost and environmental performance of supply 564 chains, while for blue cells switching conditions are either reached for extremely high values, 565 could not be reached at all, or are reached for variations in physical parameters which are 566 beyond technically achievable ranges.
567 To simplify representation only some of the possible configurations are reported in Table 11 568 and in Table 12, based on economic performance ranges. In particular, for long-distance supply 569 chains, the comparison between BP and WP in the cases of US-IT and MZ-IT is chosen because 570 supply chain cost differences between WP and BP are maximum in the case of US-IT and 571 minimum for MZ-IT. The same rationale is behind the selection of US-GB and BR-GB supply 572 chains for the British case. To analyse switching between local and global supply chains, 573 supply from US to GB and from MZ to IT are selected as extreme conditions, with US-GB 574 having the lowest gap to local supply and MZ-IT having the highest gap to local supply from 575 Northern Italy. BZ to GB and the comparison between US-IT and SI-IT supply chains are also 576 presented as examples for intermediate performance differences.
577 5.1 Sensitivity of cost
578 In Table 11, switching values for supply chain costs are reported as percentage variations on 579 the parameter baseline values used in the analysis.
580 Table 11 Switching values for supply chain costs, expressed as percentage variation from baseline values.
581 5.1.1 Effect of CAPEX, fuel and electricity price
582 As shown in Table 11, economic parameters such as fuel cost, electricity price and CAPEX 583 could change significantly without affecting final decisions on the least cost biomass supply 584 chain configurations. An increase around 130-170% in capital costs of torrefaction equipment 585 or – equivalently – a reduction in its expected lifetime around 70-80% make WP more 586 economical than BP for international supply but, at the same time, determine a switch from 587 long distance to local bioenergy supply chains.
588 5.1.2 Effect of feedstock price
591 chains competitive for GB and a doubling in biomass cost is required for IT. Biomass cost also 592 affects decisions on pre-treatments on local supply chains: the trade-off between the mass 593 losses implied by torrefaction processes and energy density gains in the transport stage is such, 594 that a reduction of biomass costs in the order of 22% is sufficient to make BP preferable to 595 wood chips for local biomass supply chains from Slovenia to Italy. For GB, a more important 596 reduction in biomass cost is required to attain similar switching conditions (78%), mainly 597 because operational costs of torrefaction plants are higher in GB than in Slovenia due to higher 598 electricity prices.
599 5.1.3 Effect of biomass properties
600 The most critical parameter for long distance supply chain performance is the biomass energy 601 density, whose variations in the order of 10-15% determine a complete rearrangement of the 602 supply chain configurations identified as least cost options in sections 4.1.1, 4.2.1 and 4.3.1. 603 This means that, if the LHV of BP is just about 18-19 MJ/kg against a baseline LHV of 17 604 MJ/kg for WP, then WP are preferable to BP in long distance supply configurations. Similarly, 605 if a LHV of ca 18-19 MJ/kg can be attained for WP against a baseline BP LHV of 21 MJ/kg, 606 torrefaction becomes uneconomic compared with WP. Ultimately, it is the difference between 607 energy densities of BP and WP that is the critical parameter. When comparing long and short 608 distance supply chains, a similar sensitivity is observed on the biomass energy density. In the 609 best performing scenarios, a reduction in BP energy density of 11% and 23% is needed to make 610 the switch to local wood chips supply chain economically feasible for GB and IT respectively. 611 In the latter case, the economic competitiveness of supplying BP from MZ to IT seems quite 612 robust, since a reduction in BP energy density of about 23% would imply that the calorific 613 value of BP would be lower than WP, which is not realistically possible.
614 On the other hand, based on the switching values analysis, the impact of bulk density on supply 615 chain economics appears limited, mainly because even relatively small percentage variations, 616 e.g. in the order of 20-50%, are out of realistically feasible ranges for BP or WP. For instance, 617 Table 11 shows that for BP to become economically preferable to WP on long supply chains 618 or for C based short supply chains to become preferable to BP based long supply chains, bulk 619 density of black pellets should be diminished to values in the range of 300-500 kg/m3,
620 completely out of the reported range of BP bulk density (650-800 kg/m3) [27]. The only
624 becomes a better choice than BP from US for a decrease of BP bulk density within a realistic 625 range (i.e. 18%, as reported in Table 11, which corresponds to a bulk density of 656 kg/m3).
626 5.2 Sensitivity of environmental performance
627 Moving on to the sensitivity analysis related to the environmental performance of the supply 628 chains (Table 12), the energy density of biomass in any form appears to be the most critical 629 parameter.
630 Table 12 Switching values for supply chain emissions, expressed as percentage variation from reference values.
631 5.2.1 Effect of biomass properties
632 Once again, variations in the order of 10% are enough to change some recommended 633 configurations: for instance, for short supply chains, a 10-11% increase in BP energy density 634 would make centralized torrefaction and pelletization a preferable option to wood chips from 635 an environmental viewpoint for Northern Italy and GB respectively. Similarly, in the case of 636 the S/SI-IT supply chain, where BP originally outperform C as to carbon equivalent emissions, 637 variations in the order of 12-13% in the energy density (i.e. decreases in BP LHV or increases 638 in C LHV, respectively) would make C the preferable option from an environmental viewpoint.
655 5.2.2 Effect of electricity emissions factor
656 Regarding the uncertainty in electricity emissions factors of importing countries, only the 657 Italian electricity mix appears to have a high sensitivity and only with reference to imports 658 from Slovenia. In that case, an 18% decrease in the Italian electricity emission factor would 659 reduce the environmental impact of milling wood chips at the final plant enough to make C a 660 more environmentally friendly solution than BP even for the short-distance supply chain 661 between SI-IT.
662 Variations in electricity emission factors of exporting countries hardly affect pre-treatment 663 options in long supply chains, with BP remaining always preferable to WP; however, they are 664 the only element of uncertainty affecting the relationship between the environmental 665 performance of long and short distance supply chains. For each export country, percentage 666 variations in electricity emissions factors required for short distance supply chains to 667 outperform long distance ones are substantial and hardly achievable in the short term; thus, 668 configurations identified in this work as the least cost can be deemed robust. However, long 669 distance supply chains with different origins may have remarkably different environmental 670 performances. For instance, the US emissions factor, which currently exceeds the British one 671 by about 7%, should be reduced to about the half for the L/BP/US-GB supply chain to become 672 at least as sustainable as its local alternative S/C/GB, whereas a 160% increase of the BR 673 electricity emissions factor, which is currently about 1/5 of the emissions factor of GB, would 674 be required for the S/C/GB to become preferable to Brazilian BP. Thus, differences in the 675 carbon emissions factors of electricity in different countries affect the relative environmental 676 performance of long and short distance supply chains in a similar manner as differences in 677 biomass costs affect economic performance.
678
Conclusions
679 A substantial increase in biomass co-firing in European countries poses the question of the 680 sustainability and availability of the feedstock supply, which is expected to rely mainly on 681 international supply chains originating overseas [2].
686 cases of co-firing in Italy and in Great Britain. Several supply chain scenarios were analysed, 687 including pellets and torrefied pellets from three international supply locations (US, Brazil and 688 Mozambique) and compared with local biomass supply chain alternatives.
689 One of the main findings of this work is that torrefaction has the potential to reduce the cost of 690 international supply chains compared to the currently established practice of white pellets, due 691 to the system-wide economies achieved, not only at the upstream supply chain and logistics, 692 but also at the co-firing station where the processing needed is significantly reduced. This 693 finding is aligned with the conclusions of [23, 27, 36], although applied in different 694 geographical contexts. Moreover, torrefaction could also reduce the carbon emissions of the 695 biomass supply chain compared to white pellets.
696 In the cases examined, the lowest CO2eq emissions from the biomass supply chain were
697 achieved by sourcing torrefied pellets from Brazil to Great Britain and torrefied pellets from 698 Mozambique for Italy.
699 When examining local biomass supply chains, wood chips were preferable to white or black 700 pellets, as the limited transportation distance and logistical efficiencies do not justify the 701 additional cost related to pre-treatment of biomass. Furthermore, wood chips incurred the least 702 carbon emissions in most of the local supply chain scenarios examined.
703 Interestingly enough, the above proposed international supply chains (based on torrefied 704 pellets) performed better than the best local supply chain alternatives for both Great Britain 705 and Italy, in terms of cost and carbon emissions. This result highlights the potential of 706 international biomass trade to reduce the overall environmental impact and cost of biomass 707 supply for co-firing. The main underlying reason for the environmental performance has to do 708 with performing energy-intensive pre-treatment processes in countries with low electricity 709 emission factors, such as Brazil and Mozambique.
717 This work contributes to academic knowledge and industrial practice by reinforcing the 718 potential advantage of a novel biomass pre-treatment process for international biomass supply 719 chains, namely torrefaction and pelleting, as it can lead to both cost and carbon emissions 720 reductions compared to the current practice of white pellets and even compared to local 721 biomass supply alternatives, for the cases examined. It is also the first research to compare the 722 performance of international biomass supply chains with local ones for this range of pre-723 treatment options. It could also be useful to policy makers for informing decisions on support 724 for renewable energy generation.
725 Finally, the authors would like to acknowledge that this work has some limitations. The 726 investigation of different co-firing rates or, particularly, of alternative technologies enabling 727 higher co-firing rates was out of the scope of this study, but is an important theme for future 728 research. Many of the parameters used are quite volatile, and therefore the order of preference 729 between the supply chains identified could change in the future, despite the sensitivity analysis 730 proving a good robustness of the findings to individual parameter value changes. Even more, 731 the dynamic nature of the systems examined could also alter the results (i.e. the electricity mix 732 in European countries is bound to become more renewable in the future and the average carbon 733 emissions fluctuate every year). Additionally, although international biomass supply chains are 734 the sensible way forward for the countries examined in this work, due to the inherent limitation 735 of domestic supply quantities, a potential future development of domestic biomass uses in the 736 considered supply countries could introduce competition, therefore increasing prices and 737 affecting availability of biomass. Furthermore, sustainability of biomass does not only involve 738 carbon emissions, but also the land change and substitution of edible crops for biomass. These 739 analyses are beyond the scope of this work, but are an interesting aspect that deserves more 740 investigation in the future.
741
References
742 [1] IEA-ETSAP and IRENA, Biomass Co- firing: Technology Brief, 2013.
743 https://www.irena.org/DocumentDownloads/Publications/IRENA-ETSAP Tech Brief E21
744 Biomass Co-firing.pdf.
745 [2] A. Ernsting, A new look at land-grabs in the global South linked to EU biomass policies, 2014.
746 http://www.biofuelwatch.org.uk/2014/biomass-landgrabbing-report/.
747 [3] Ofgem, Draft guidance - Renewables Obligation: Guidance for Generators, 2015.
748 https://www.ofgem.gov.uk/sites/default/files/docs/2015/09/for_publication_draft_guidance_fo
751 produzione di energia elettrica da impianti a fonti rinnovabili diversi dai fotovoltaici, 2016.
752 http://www.gse.it/it/Qualifiche e certificati/GSE_Documenti/Incentivi DM 23 giugno
753 2016/Documenti/PA DM FER-E 2016 Procedure Applicative 2016-07-15.pdf.
754 [5] R. Ehrig, F. Behrendt, Co-firing of imported wood pellets - An option to efficiently save CO2
755 emissions in Europe?, Energy Policy. 59 (2013) 283–300.
756 doi:http://dx.doi.org/10.1016/j.enpol.2013.03.060.
757 [6] Agriregionieuropa, Le biomasse legnose a fini energetici in italia: uno sleeping giant?, 2011.
758
https://agriregionieuropa.univpm.it/it/content/article/31/24/le-biomasse-legnose-fini-759 energetici-italia-uno-sleeping-giant.
760 [7] M. Masiero, N. Andrighetto, D. Pettenella, Linee-guida per la valutazione sistematica della
761 filiera corta delle biomasse legnose a fini energetici, Agriregionieuropa. (2013).
762
http://agriregionieuropa.univpm.it/it/content/article/31/33/linee-guida-la-valutazione-763 sistematica-della-filiera-corta-delle-biomasse.
764 [8] U. Mantau, U. Saal, K. Prins, F. Steierer, M. Lindner, H. Verkerk, J. Eggers, N. Leek, J.
765 Oldenburger, A. Asikainen, P. Anttila, EUwood - Real potential for changes in growth and use
766 of EU forests. Final report., Hamburg, 2010.
767
https://www.egger.com/downloads/bildarchiv/187000/1_187099_DV_Real-potential-changes-768 growth_EN.pdf.
769 [9] R. Fernando, Public attitudes to biomass cofiring, IEA Clean Coal Centre, 2013.
770 https://www.usea.org/sites/default/files/012013_Public attitudes to biomass
771 cofiring_ccc214.pdf.
772 [10] C.N. Hamelinck, R.A.A. Suurs, A.P.C. Faaij, International bioenergy transport costs and energy
773 balance, Biomass and Bioenergy. 29 (2005) 114–134.
774 doi:http://dx.doi.org/10.1016/j.biombioe.2005.04.002.
775 [11] U. Malisius, H. Jauschnegg, H. Schmidl, B. Nilsson, S. Rapp, A. Strehler, H. Hartmann, R.
776 Huber, J. Whitfield, D. Kessler, A. Geißlhofer, B. Hahn, Wood pellets in Europe, 2000.
777 http://www.seai.ie/Renewables/Bioenergy/Wood_pellets_in_Europe.pdf.
778 [12] P.C.A. Bergman, ECN report: Combined torrefaction and pelletisation - the TOP process, The
779 Netherlands, 2005. https://www.ecn.nl/docs/library/report/2005/c05073.pdf.
780 [13] C. Schorr, M. Muinonen, F. Nurminen, Torrefaction of Biomass, Mikkeli, Finland, 2012.
781
http://biosaimaa.fi/wp-782 content/uploads/2012/11/Torrefacion_of_biomass__Julkaisu_1_2012__06032012.pdf.
783 [14] J. Koppejan, S. Sokhansanj, S. Melin, S. Madrali, IEA Bioenergy Task 32 - final report: Status
784 overview of torrefaction technologies, 2012.
785 http://www.ieabcc.nl/publications/IEA_Bioenergy_T32_Torrefaction_review.pdf.
786 [15] M. Wilk, A. Magdziarz, I. Kalemba, P. Gara, Carbonisation of wood residue into charcoal during
787 low temperature process, Renew. Energy. 85 (2016) 507–513.
788 doi:http://dx.doi.org/10.1016/j.renene.2015.06.072.
789 [16] S. Proskurina, J. Heinimo, F. Schipfer, E. Vakkilainen, Biomass for industrial applications : The
790 role of torrefaction, Renew. Energy. 111 (2017) 265–274.
791 doi:http://dx.doi.org/10.1016/j.renene.2017.04.015.
792 [17] N. Soponpongpipat, U. Sae-Ueng, The effect of biomass bulk arrangements on the
793 decomposition pathways in the torrefaction process, Renew. Energy. 81 (2015) 679–684.
795 [18] M. Svanberg, I. Olofsson, J. Flodén, A. Nordin, Analysing biomass torrefaction supply chain
796 costs, Bioresour. Technol. 142 (2013) 287–296.
797 doi:http://dx.doi.org/10.1016/j.biortech.2013.05.048.
798 [19] M. Svanberg, Á. Halldórsson, Supply chain configuration for biomass-to-energy: the case of
799 torrefaction, Int. J. Energy Sect. Manag. 7 (2013) 65–83.
800 doi:http://dx.doi.org/10.1108/17506221311316489.
801 [20] R. Suurs, Long distance bioenergy logistics. An assessment of costs and energy consumption
802 for various biomass energy transport chains, Utrecht, 2002.
803 https://dspace.library.uu.nl/bitstream/handle/1874/25753/suurs_02_+longdistancebioenergylog
804 istics.pdf?sequence=1.
805 [21] R. Sikkema, M. Junginger, W. Pichler, S. Hayes, M. Keynes, The international logistics of wood
806 pellets for heating and power production in Europe: Costs, energy-input and greenhouse gas
807 balances of pellet consumption in Italy, Sweden and the Netherlands, Biofuels, Bioprod.
808 Biorefining. 4 (2010) 132–153. doi:http://dx.doi.org/10.1002/bbb.
809 [22] B.H. Ba, C. Prins, C. Prodhon, Models for optimization and performance evaluation of biomass
810 supply chains : An Operations Research perspective, Renew. Energy. 87 (2016) 977–989.
811 doi:http://dx.doi.org/10.1016/j.renene.2015.07.045.
812 [23] B. Batidzirai, F. van der Hilst, H. Meerman, M. Junginger, A. Faaij, Optimization potential of
813 biomass supply chains with torrefaction technology, Biofuels, Bioprod. Biorefining. 8 (2014)
814 253–282. doi:10.1002/bbb.1458.
815 [24] D. Agar, J. Gil, D. Sanchez, I. Echeverria, M. Wihersaari, Torrefied versus conventional pellet
816 production - A comparative study on energy and emission balance based on pilot-plant data and
817 EU sustainability criteria, Appl. Energy. 138 (2015) 621–630.
818 doi:http://dx.doi.org/10.1016/j.apenergy.2014.08.017.
819 [25] A. Rentizelas, J. Li, Techno-economic and carbon emissions analysis of biomass torrefaction
820 downstream in international bioenergy supply chains for co-firing, Energy. 114 (2016) 129–142.
821 doi:http://dx.doi.org/10.1016/j.energy.2016.07.159.
822 [26] A. Uslu, A.P.C. Faaij, P.C.A. Bergman, Pre-treatment technologies, and their effect on
823 international bioenergy supply chain logistics. Techno-economic evaluation of torrefaction, fast
824 pyrolysis and pelletisation, Energy. 33 (2008) 1206–1223.
825 doi:http://dx.doi.org/10.1016/j.energy.2008.03.007.
826 [27] G. Gardbro, Techno-economic modeling of the supply chain for torrefied biomass, Umeå
827 University, 2014. http://www.diva-portal.org/smash/get/diva2:722991/FULLTEXT01.pdf.
828 [28] K. Damen, A. Faaij, A greenhouse gas balance of two existing international biomass import
829 chains: The case of residue co-firing in a pulverised coal-fired power plant in the Netherlands,
830 Mitig. Adapt. Strateg. Glob. Chang. 11 (2006) 1023–1050.
831 doi:http://dx.doi.org/10.1007/s11027-006-9032-y.
832 [29] D.R. McIlveen-Wright, Y. Huang, S. Rezvani, Y. Wang, A technical and environmental analysis
833 of co-combustion of coal and biomass in fluidised bed technologies, Fuel. 86 (2007) 2032–2042.
834 doi:http://dx.doi.org/10.1016/j.fuel.2007.02.011.
835 [30] Drax Group plc, drax: About us - Our businesses and projects, (2017).
836 https://www.drax.com/about-us/our-businesses-and-projects/#drax-power.
837 [31] Ministry for the Environment and the protection of Territory and Sea, Authorization for A2A
840 [32] National Forest Inventory, Biomass in live woodland trees in Britain: National Forest Inventory
841 Report, Edinburgh, 2011. https://www.forestry.gov.uk/pdf/fcnfi114.pdf/$FILE/fcnfi114.pdf.
842 [33] Renewable Energy Foundation, Biomass Supplies in Scotland, Dalkeith, 2010.
843 http://www.ref.org.uk/attachments/article/140/123_Biomass 100516.pdf.
844 [34] V. Motola, N. Colonna, V. Alfano, M. Gaeta, S. Sasso, V. De Luca, C. De Angelis, A. Soda, G.
845 Braccio, Report RSE (Ricerca Sistema Elettrico) - Censimento potenziale energetico biomasse,
846 metodo indagine, atlante Biomasse su WEB-GIS, 2009.
847
http://www.enea.it/it/Ricerca_sviluppo/documenti/ricerca-di-sistema-elettrico/censimento-848 biomasse/rse167.pdf.
849 [35] Š.P. Malovrh, V. Leban, J. Krč, L.Z. Stirn, Slovenia : Country report, Ljubljana, 2012.
850
http://www.bf.uni-851 lj.si/index.php?eID=dumpFile&t=f&f=14316&token=468116d57f07e3fe4844e1b3821867868f
852 29507b.
853 [36] M. Junginger, T. Bolkesjø, D. Bradley, P. Dolzan, A. Faaij, J. Heinimö, B. Hektor, Ø. Leistad,
854 E. Ling, M. Perry, E. Piacente, F. Rosillo-Calle, Y. Ryckmans, P.P. Schouwenberg, B. Solberg,
855 E. Trømborg, A. da S. Walter, M. de Wit, Developments in international bioenergy trade,
856 Biomass and Bioenergy. 32 (2008) 717–729.
857 doi:http://dx.doi.org/10.1016/j.biombioe.2008.01.019.
858 [37] D. Bradley, B. Hektor, M. Wild, M. Deutmeyer, P.-P. Schouwenberg, J.R. Hess, J.S. Tumuluru,
859 K. Bradburn, IEA Bioenergy Task 40: Low Cost, Long Distance Biomass Supply Chains,
860 Utrecht, 2013.
861 https://www.researchgate.net/publication/256088240_Low_cost_long_distance_biomass_supp
862 ly_chains.
863 [38] F. Sebastián, J. Royo, M. Gómez, Co-firing versus biomass fired power plants : GHG (
864 Greenhouse Gases ) emissions savings comparison by means of LCA ( Life Cycle Assessment
865 ) methodology, Energy. 36 (2011) 2029–2037.
866 doi:http://dx.doi.org/10.1016/j.energy.2010.06.003.
867 [39] D. Agar, The Feasibility of Torrefaction for the Co-Firing of Wood in Pulverised-Fuel Boilers,
868 Åbo, Finland, 2015.
869 https://www.doria.fi/bitstream/handle/10024/117763/agar_david.pdf?sequence=2.
870 [40] National Energy Foundation, NEF|-Simple Carbon Calculator, (2015).
http://www.carbon-871 calculator.org.uk/index2015.html (accessed July 30, 2016).
872 [41] Ministry for the Environment, Guidance for voluntary corporate greenhouse gas reporting -
873 2015: Data and methods for the 2013 calendar year., New Zealand, 2015.
874
http://www.mfe.govt.nz/publications/climate-change/guidance-voluntary-corporate-875 greenhouse-gas-reporting-data-and-methods.
876 [42] Greenhouse Gas Protocol, Excel spreadsheet: emission factors from cross-sector tools, (2012).
877 http://www.ghgprotocol.org/calculation-tools/all-tools.
878 [43] Enerdata, Slovenia: Energy efficiency report, 2011.
879 https://library.e.abb.com/public/583b64aa2baddef6c12578e2005291a6/Slovenia.pdf.
880 [44] Ecometrica, Electricity-specific emission factors for grid electricity, 2011.
881 https://ecometrica.com/assets/Electricity-specific-emission-factors-for-grid-electricity.pdf.
882 [45] J.-B. Michel, C. Mahmed, J. Ropp, J. Richard, M. Sattler, M. Schmid, Combustion and
life-883 cycle evaluation of torrefied wood for decentralized heat and power production, in: 9th Eur.
http://www.sib.heig-885 vd.ch/téléchargements/Documents/Paper_INFUB1_JBM_V4.pdf.
886 [46] F. Biedermann, T. Brunner, C. Mandl, I. Obernberger, W. Kanzian, S. Feldmeier, M. Schwabl,
887 H. Hartmann, P. Turowski, E. Rist, C. Schön, Production of Solid Sustainable Energy Carriers
888 from Biomass by Means of Torrefaction: Deliverable No. D7.3 and No. D7.4 – Executive
889 Summary, 2014.
https://sector-project.eu/fileadmin/downloads/deliverables/D7.3_7.4-890 combustion_behaviour__combustion_screening_and_fuel_assessment_Bios__final.pdf.
891 [47] A. Maciejewska, H. Veringa, J. Sanders, S.D. Peteves, CO-FIRING OF BIOMASS WITH
892 COAL: CONSTRAINTS AND ROLE OF BIOMASS PRE-TREATMENT, The Netherlands,
893 2006. http://www.canadiancleanpowercoalition.com/files/7712/8330/1763/BM2 -
894 EUR22461EN.pdf.
895 [48] F. Al-Mansour, J. Zuwala, An evaluation of biomass co-firing in Europe, Biomass and
896 Bioenergy. 34 (2010) 620–629. doi:http://dx.doi.org/10.1016/j.biombioe.2010.01.004.
897 [49] P.C. a Bergman, a R. Boersma, R.W.R. Zwart, J.H. a Kiel, ECN report: Torrefaction for biomass
898 co-firing in existing coal-fired power stations - “BIOCOAL,” The Netherlands, 2005.
899 https://www.ecn.nl/docs/library/report/2005/c05013.pdf.
900 [50] B.S. Hoffmann, A. Szklo, R. Schaeffer, An evaluation of the techno-economic potential of
co-901 firing coal with woody biomass in thermal power plants in the south of Brazil, Biomass and
902 Bioenergy. 45 (2012) 295–302. doi:http://dx.doi.org/10.1016/j.biombioe.2012.06.016.
903 [51] Z. Khorshidi, M.T. Ho, D.E. Wiley, The impact of biomass quality and quantity on the
904 performance and economics of co-firing plants with and without CO2 capture, Int. J. Greenh.
905 Gas Control. 21 (2014) 191–202. doi:http://dx.doi.org/10.1016/j.ijggc.2013.12.011.
906 [52] R. Boardman, K. Cafferty, M. Bearden, J. Cabe, Logistics, Costs, and GHG Impacts of
Utility-907 Scale Cofiring with 20% Biomass, 2013.
908 https://www.researchgate.net/publication/282157146_Logistics_Costs_and_GHG_Impacts_of
909 _Utility-Scale_Cofiring_with_20_Biomass.
910 [53] E. Agbor, A.O. Oyedun, X. Zhang, A. Kumar, Integrated techno-economic and environmental
911 assessments of sixty scenarios for co-firing biomass with coal and natural gas, Appl. Energy.
912 169 (2016) 433–449. doi:http://dx.doi.org/10.1016/j.apenergy.2016.02.018.
913 [54] Forest Research, Calorific value as a function of moisture content: Excel spreadsheet tool,
914 (2013). http://www.forestry.gov.uk/fr/beeh-9ukqcn.
915 [55] B. Batidzirai, A.P.C. Faaij, E. Smeets, Biomass and bioenergy supply from Mozambique,
916 Energy Sustain. Dev. 10 (2006) 54–81. doi:http://dx.doi.org/10.1016/S0973-0826(08)60507-4.
917 [56] M. Hoque, S. Sokhansanj, T. Bi, S. Mani, L. Jafari, J. Lim, P. Zaini, S. Melin, T. Sowlati, M.
918 Afzal, Economics of Pellet Production for Export Market, 2006 CSBE/SCGAB, Edmonton, AB
919 Canada, July 16-19, 2006. (2006) 1–15. doi:http://dx.doi.org/10.13031/2013.22062.
920 [57] Y. Qian, W. McDow, The Wood Pellet Value Chain - An economic analysis of the wood pellet
921 supply chain from the Southeast United States to European Consumers., 2013.
922 http://www.usendowment.org/images/The_Wood_Pellet_Value_Chain_Revised_Final.pdf.
923 [58] X-Rates: Exchange Rates, (2016). www.x-rates.com (accessed June 25, 2016).
924 [59] Eurostat, Producer prices in industry, EU-28, (2016).
http://ec.europa.eu/eurostat/statistics-925 explained/index.php/Industrial_producer_price_index_overview (accessed May 30, 2016).