0022-538X/84/080497-08$02.00/0
Copyright ©1984, AmericanSocietyforMicrobiology
Uncoating
of Influenza
Virus in
Endosomes
AKIHIKO YOSHIMURA AND SHUN-ICHI OHNISHI*
Deparutnent ofBiophlysics, Facculty of ScSience, Kvoto Universitv, Sakvo-kii, Kvoto606, Jalpaln Received 28November 1983/Accepted 20April 1984
The intracellular uncoating site of influenza virus was studied by measuring the fluorescence intensity of probes conjugated to the virus or the isolated hemagglutinin and also by assaying virus replication under various incubation conditions. Acidification of the viral environment was monitored by the decrease in the fluorescence intensity of fluorescein isothiocyanate, and transport of the virus particles into secondary
lysosomes wasassayed by the increase in the fluorescenceintensitvof fluorescein isothiocyanate diphosphate. The intracellular pHwasestimated by the ratio of fluorescence intensities excitedat twodifferentwavelengths. Itwasfound that the viral environment became acidifiedtoapHvalue of 5.1to5.2 within 10minat37°Cor 1h at 20°C after endocytosis. Addition of ammonium chloride to the medium rapidly raised the pH to 6.7. Transport of the virus particles into the secondary lysosomes was slower and negligibly low during those incubation periods. Virus replicationoccurred when the cells wereincubated for 10minat37°Cor for1 h at
20°C, followed byincubation in thepresenceof ammonium chlorideforatotal of 12 h. These resultsindicate
the uncoating of influenza virus in endosomes beforereachingthe secondary lvsosomes.
Based on thelow pH-induced fusion activity of influenza virus, we proposed and presented evidence for a new infectious cell entrymechanism for this virus (5, 6, 14). After endocytosis, penetration of the viral genome into cytosol occurred when thevirusparticles reachedanacidic compart-ment and the viral envelope fused with the membrane.
Raising the lysosomal pH by addition of chloroquine or ammonium chloride inhibited virus replication, and its pH dependencewascompletely parallel to that for the envelope fusion. We therefore proposed the secondary lysosomes to be theuncoating site. Recently. Tycko andMaxfield (12) and Maxfield (8) have shown that the prelysosomal endocytic vesicles (endosomes or receptosomes) had a low inside pH
(about5) and thatvarious weak bases, including chloroquine and ammoniumchloride, caused an increase in thepH, just asforthe lysosomalpH. The uncoating ofinfluenza virus in endosomes is therefore very probable andis the subject of the present investigation.
We synthesized a new fluorescent probe. fluorescein
isothiocyanate (FITC) diphosphate (see Fig. 1) to detect transport of the dye-conjugated particles into the secondary
lysosomes, since dephosphorylation of the probe by acid phosphatase caused about a 20-fold increase in the fluores-cence intensity. We also followed the change in pH of the viral environment by using virus or isolated hemagglutinin labeled with FITC and estimated the endosomal pH. By
combining these data with those on virus replication under conditions where transport of virus particles into secondary
lysosomes wasnegligible, we conclude that influenza virus is uncoated in endosomes.
Helenius and his colleagues have extensively studied low
pH-inducedfusion of Semliki Forest virus and proposed that uncoating occurs in lysosomes or other intracellular acidic vacuoles (1. 13). They have recently studied and obtained evidence for involvement of endosomes in the uncoating (7).
MATERIALS ANDMETHODS
Cells and virus.Madin-Darby canine kidney (MDCK) cells were grown at 37°C under 5% CO, in 35-mm plastic petri dishes (Nunc) oron glass cover slips (9 by 18 mm) in Eagle
*Corresponding author.
minimum essential medium supplemented with 10% new-born calfserum. Influenza virus strain WSN was grown in theallantoic cavity of 10-day-old embryonated eggs for 48h at36°C and purified by centrifugationasdescribed previous-ly (4). Virus concentration was expressed as hemagglutinat-ing unitsorproteinweightasdeterminedby Lowryetal.(3). Fluorescence labeling of virus and isolated HA rosette by FITC. Virus (10 mg/ml in Tris-buffered saline) was mixed with an equal volume of 0.1 mg of FITC per ml in 0.5 M bicarbonate buffer (pH 9.5) and allowed to reactfor 1 h at room temperature. After being passed through a Sephadex G-50 column to removethe unconjugateddye,the viruswas suspended in phosphate-buffered saline and filtered through a Millipore filter (diameter. 0.45 pm) to separate out virus aggregates. Theviruscontained about
102
dye molecules per virion, mainly attached to hemagglutinin (HA) and neur-aminidase (NA) proteins in the envelope but not to M and nucleocapsid proteins, asjudged by fluorescence after sodi-um dodecyl sulfate-polyacrylamide gel electrophoresis. Pronasetreatment(1 mg/ml: Kaken)of the labeled virus (0.7 mg/ml) at 35°C for 8 h released most (93%) of the fluores-cence intomedium. The fluorescence labelingdid not much alter theviralactivity.Thelabeled virus hada hemagglutina-tion titer of 3.6 x10⁴
hemagglutinating units per mg ofprotein(120% ofcontrol), infectivity at 1.7 x 10⁹PFU/mgof
protein (77% of control), and low pH-induced hemolytic
activity (62%hemolysis after incubation at pH 5.2for 30 min at 37°C; 72% of control).
FITC-labeled HA rosettes were obtained by solubilizing virus that was densely labeled with FITC in Triton X-100* followed by sucrose density gradient centrifugation as de-scribed previously(11). The dye-to-HA ratiowas ashighas
unity. but thelabeled HA rosettesstill retained the low pH-induced hemolytic activity at 70% of that of intact rosettes (11).
Fluorescencelabeling of virus and proteins by FITC diphos-phate. FITC diphosphate was prepared by the reaction of FITC with phosphorous oxychloride in a manner similarto that for phenylphosphoric acid esters (2). A description of the preparation andcharacterization ofthecompoundwillbe published elsewhere. Briefly, a solution of FITC (10 mg) in 0.1 ml of dried pyridine was added with shaking to 10
[l
of 497on November 10, 2019 by guest
http://jvi.asm.org/
phosphorous oxychloride and reacted for 1 h at room temperature. The remaining phosphoryl oxychloride was decomposed by adding 50
[1
of water, and the pH was adjusted to neutral by adding 1 N NaOH. The solution was then mixed with a large volume (10 ml) of 0.5 M bicarbonate buffer (pH 9.5) and useddirectly for labeling by adding it to an equal volume of virus suspension (10 mg/ml in Tris-buffered saline [pH 7.2]). After reaction for 1 h at room temperature, theunconjugated dye was removed by passing through a Sephadex G-50 column. Conjugation of FITC diphosphate to protein (bovine serum albumin and conca-navalin A) was carried out in the same way as above. The labeled virus contained about102
dye molecules per virion, mainly attached to HA andNA but notto Mand nucleocap-sid proteins. Pronase treatmentof the labeled virus released 92% ofthe fluorescence into the medium. The labeled virus retained 100%V/ of the hemagglutination titer, 60% of the infectivity, and 79% of the low pH-inducedhemolytic activi-ty.The fluorescence characteristics of FITC diphosphate were similar to those of the protonated form of FITC. The fluorescence intensity at 530 nm with excitation at 495 nm was much smaller (ca. 1/20th) than that of FITC at neutral pH and was similar to that of FITC at pH 4. Therefore. hydrolysis of the diphosphate caused about a 20-fold in-creasein the fluorescence intensity measuredat neutral pH (Fig. 1). This enhancement of fluorescence is quitesimilarto that for conversion of FITC from the protonated to the neutral form by neutralization.
Intracellular dephosphorylation siteof FITC diphosphate.
.u
r
LA
I-3
LAJ
C-I
LAJ
IA-LAJ
b
500 440
EX. WAVELENGTH (nm)
FIG. 1. Chemical formula of FITC diphosphate and its
fluores-cence spectrum. A large increase in the fluorescence intensity on
dephosphorylation is shown. Shown is the fluorescence intensityat
530nmwithexcitationatvariouswavelengths of FITC diphosphate-labeledvirus (a) and of thelabeled virus aftertreatmentwithalkaline phosphatase (b). Virus (10 ,ul; 1 mg/ml) was incubated in 0.25 M
carbonate buffer (pH 9.5) containing (b) ornot containing (a) calf intestinealkalinephosphatase(1mg/ml)for 10 minat37°C, and 2 ml
of50 mMphosphate buffer (pH 8.5)was added.
I-z
z
-z UJ (n)
0
Ul
w
0
-j
I-w
5.0
6.0
7.0
8.0
pH
FIG. 2. pH dependence of hydrolysis ofFITC diphosphate by MDCK cell homogenate. FITC diphosphate conjugated tobovine serum albumin was mixed with MDCK whole-cell homogenate in bufferatvariouspHvaluescontaining1%Triton X-100 and incubat-ed for 10min at 37°C as described in the text. Afterthe pH was readjusted to 8.5, the fluorescence intensity at 530 nm (eX = 495
nm) was measured(0).The reaction mixture contained in addition 5 mMNaMoO4 (0)or 5 mMlevamisole hydrochloride (A).
To locate thedephosphorylationsite in MDCK cells, hydro-lysis of FITC diphosphate after endocytosis into cells and also by cell homogenate was studied by measuring the fluorescence intensity at 530 nm (A = 495 nm) at neutral pH for the assay. 'T'he hydrolysis by cell homogenate was studiedbyusingthedyeconjugatedtobovineserumalbumin as asubstrate. The cell homogenatewasobtainedby
homog-enizing cells isolated froma confluent monolayer culture in 0.25 M sucrose-1) mM HEPES (N-2-hydroxyethylpipera-zine-N'-2-ethanesulfonic acid) (pH 7.2) with a Teflon ho-mogenizer. The whole-cell homogenate (10
[1I;
7 mg of protein per ml) was mixed with 10 .1l of the dye-conjugated bovine serum albumin (7mg/ml) in 200 mM buffer at various pH values [2-(morpholino)ethanesulfonic acid (Dotite) for pH 4.5 to 7.0 and HEPES for pH 7.5 to 8.0] containing 1% Triton X-100. After incubation for 10 min at 37°C, the solution pH was adjusted to 8.5 by adding 2 ml of 50 mM phosphate buffer, and the fluorescence intensity at 530 nm was measured. Figure 2 shows the fluorescence intensity against the pH of the reaction. The hydrolysis reaction had an optimum pH of 5.0 to 5.5. The same experiment was carried out in the presence of 5 mM sodium molybdate, an acid phosphatase inhibitor, or 5 mM levamisole hydrochlo-ride (Aldrich Chemical Co.), an alkaline phosphatase inhibi-tor. Molybdate completely inhibited the hydrolysis, but levamisole did not affect the reaction at all (Fig. 2). These results indicate that FITC diphosphate was hydrolyzed by acid phosphatase in the cell homogenate, most probably in the lysosomes.t
2
on November 10, 2019 by guest
http://jvi.asm.org/
[image:2.612.321.555.75.339.2] [image:2.612.65.303.392.641.2]For the study ofhydrolysis afterendocytosis. concanava-lin A conjugated with FITC diphosphate was used. MDCK cells on a 35-mm petri dish were adsorbed with the dye-conjugated concanavalin A(0.4 mg/ml) inHANKS (137mM NaCl. 5.4 mM KCI. 0.40 mM NaHPO04 0.44 mM KH2PO4, 0.41 mM MgSO4. 0.49 mM MgC.. 1.3 mM CaCl,, 5.6 mM glucose) buffered with 20 mM HEPES (pH 7.4). After incubation for various periods at 37°C. the cells were solubi-lized by 0.2% Triton X-100 buffered with 0.1 M Tris-hydrochloride (pH 9.0). and the fluorescence intensity at 530 nmwasmeasured. Thefluorescence intensity increased with time. However, whenNH4CI ormonensin was added to the incubation mixture. the fluorescence intensity was greatly reduced. For example. the fluorescence intensity after 90 minof incubationwas reduced to33% of the control level by 10 mM NH4CI and to 29% of the control level by 10 >.M monensin (Calbiochem). Since these reagents are known to raise Iysosomal pH and to reduce the enzyme activity, the results indicatesecondary lysosomes asthe dephosphoryla-tion site.
Assay of virus particles transported into secondary lyso-somes by fluorescence intensity increase. Ifvirus conjugated with FITC diphosphate isendocytosed andtransportedinto
secondary lysosomes, the probe molecule will be
dephos-phorylatedbyacidphosphatase and the fluorescence intensi-ty will increase ca. 20-fold when measured at neutral pH.
z
LI-z
LUJ Z -0
w
en
LICKo
o o3
0 0
-LU
-J
wL
4
0
30
20
10
0
The amount ofvirus transported into secondary lysosomes wasassayed as follows. MDCK cells on a 35-mm petri dish were loaded with 0.5 ml ofFITC diphosphate-labeled virus (80 p.g/ml) in HANKS-20mM HEPES(pH7.4), kept for 1 h at 4°C. and washed by cold HANKS. Two milliliters of HANKS was then added to the cells. and they were incubat-ed for various periods at 37 or 20'C. The medium was
withdrawn, and its fluorescence intensity at 530 nm (XA\ = 495nm) was measured. The cells weresolubilized with2 ml of 0.1 M Tris-hydrochloride (pH8.0) containing 0.2% Triton X-100. Aftercentrifugation, the fluorescenceintensityofthe supernatant was measured at 530 nm. The sum of the fluorescence intensity of the cells and that of the medium represents virus transportedinto secondarylysosomes. The fluorescence intensity of the initially adsorbed total virus was obtained after treating cells adsorbed with the labeled virus in4ml of0.2% TritonX-100-5mgof alkaline phospha-tase(calfintestine, Sigmatype 1)perml-1mgofpronase per ml-0.1 M Tris-hydrochloride (pH 8.0) for 30 to 60 min at 370C.
Assay of pH change in viral environment and estimation of endosomal pH. Change in the local pH surrounding the virus was followed after endocytosis by measuring the fluores-cenceintensity of FITC conjugatedto virus. MDCK cells on a glass coverslip (9 by 18 mm) were loaded with 0.1 ml of FITC-labeled virus (0.1 mg/ml in HANKS-HEPES [pH
0
20
40
60
80
100
120
T IM
E
(minf)
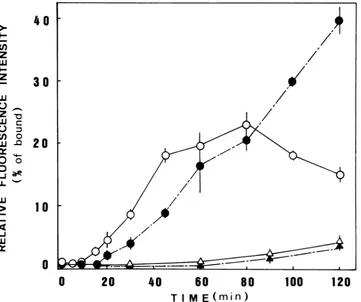
FIG. 3. Increase in thefluorescence intensityonincubationof cells adsorbedwith FITCdiphosphate-labeled virusat37°C(O,)or20°C (A,A). Open symbols, Cell-associated fluorescence: solid symbols, extracellular fluorescence. MDCK cellson petri dishes were adsorbed with 0.5 ml of FITC diphosphate-labeled virus (80 ,ug/ml) at 4°C for 1 h. washed, and incubated at 37 or20'Cin 2 ml of HANKS-HEPES (pH 7.4). After the indicated times, the covering mediumwas withdrawn, anditsfluorescence intensityat530nm
(X,\
= 495nm)was measured(@A).
The cells were solubilized with 2 ml of0.2% Triton X-100 in 0.1 M Tris-hydrochloride buffer(pH 8.0) and centrifuged, and the fluorescence intensity of the supernatantwas measured (O,A). The ordinate gives the fluorescenceintensity relative tothatof the initially adsorbed totalvirus.on November 10, 2019 by guest
http://jvi.asm.org/
[image:3.612.131.492.359.661.2]FIG. 4. Fluorescence micrographs of MDCKcells adsorbedwithFITC-labeled virus(athrough d)orFITCdiphosphate-labeledvirus(e through h) after incubationfor 10min at 37°C (a, b, e), for 1 h at20°C(c,d, f), orfor1h at37°C(g).Afterincubations,cellswereeither treated with20mM ammonium chloride (a, c) or fixed with4%paraformaldehyde (e, f, g, h) except for (b) and(d). (h),Phase-contrastmicrograph of cellscorrespondingto(g). Bar, 20p.m.
on November 10, 2019 by guest
http://jvi.asm.org/
[image:4.612.120.508.73.678.2]100
I-. 0
-EC8
j /o\0
/,
40
A
X
II
C-, 4
20
LA.. 0
0 20 40 60
TIME
(min)
FIG. 5. Decrease inthefluorescence intensityon incubation of cellsadsorbed withFITC-labeledvirus at370C(e) or20°C(0)and its recovery onaddition ofammonium chloride. MDCKcells ona glasscoverslipwereloaded with0.1 mlofFITC-labeledvirus(0.1 mg/ml) for1 h at4°C andwashed extensively. Thecover slipwas thenplaced inacuvettecontaining HANKS-HEPES maintainedat
37 or200C,and itsfluorescence intensityat520nm(Xex = 495nm) was measured intermittently. The arrow shows thetime when 20 mM ammonium chloride was added to the medium. The light scattering effectwascorrected byusing cells without FITC-labeled virus.
25
r-x
4-j
c 0
0 0 0. -C
m
20
15
10
5
7.4]), kept for 1 h at 40C, and washed extensively with HANKS for 1 min at room temperature to remove the unbound virus. Thecoverslip was mounted in the holderas described inOhkuma and Poole (10) and placed inastandard fluorescence cuvette containing HANKS-HEPES main-tained at37 or 20°C, and the fluorescence intensity at 520nm (Xex = 495 nm) was measured by using a Hitachi MPF-II fluorescence spectrophotometer.
The endosomal pH was estimated by using FITC-labeled HArosettes in a way similar to that ofTycko and Maxfield (12). MDCK cells grown on the cover slip were loaded with 50 [L ofFITC-labeledrosettes(50,ug/ml in HANKS-HEPES
[pH
7.2])
for 30 min at4°C
foradsorption.
washed, and incubated for 1 h at20°C or for 10 min at 37°C. The cells were then treated with 5 mg of pronase per ml in HANKS for 20 min at 20°C to remove the fluorescent label in rosettes remaining bound on the cell surface. The treatment removed more than 90% of the surface-bound label according to the fluorescencemeasurementbut didnotmodify the cell shape. The cover glass was then mounted on the stage ofa Zeiss Universal microscope, and thefluorescenceintensities from a small region (diameter. ca. 10 pLm) of a single cell was measured by using a photomultiplier attached tothe micro-scope.The fluorescence intensities at520nmwith excitation at 495 nm(1495) and 450 nm (1450) was counted. To obtain the background level, the same measurement was made by using the cells without fluorescent rosettes, and the back-ground level was subtracted from the fluorescence intensi-ties. The pH value was calculated by the ratio of the0
to
I',
0-4
cn
0
C-0
CK
5.0
6.0
7.0
8.0
pH
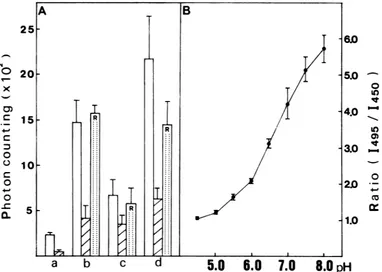
FIG. 6. IntracellularpH measurement by the ratio of fluorescence intensities (1495/1450)of FITC-labeled HA rosettes incubated with MDCK cells. (A)Labeledrosetteswere adsorbed onto the MDCK cell monolayer at0°Cfor 30 min (column b), incubated for 1 h at20°C, fol-lowedbypronase treatmentfor 20 min at 20°C (column c), and then 20 mMNH4CIwas added(column d). The fluorescence intensity at 520 nm,excitedat495 nm (open bars)and at 450 nm (hatched bars), was measured by photon counting, and the ratio1495/1450(R) was calculated
as described in the text. Column a, Background level measured with cells without added fluorescent rosettes. (B) Ratio of fluorescence intensities(1495/1450)versus thepH obtained for FITC-labeled HA rosettes in 120 mM buffer at various pH values (acetateforpH 4.5 to 5.5, phosphate forpH 6.0 to 7.5,Tris-hydrochloride for pH 7.5 to 8.0). Valuesare given as the mean + standarddeviation.
on November 10, 2019 by guest
http://jvi.asm.org/
[image:5.612.60.297.68.257.2] [image:5.612.120.502.390.662.2]TABLE 1. IntracellularpHmeasurement With FITC-labeled HA rosettes"
Fluorescence
Conditions intensity ratio pH w
(1495/1450)
Adsorbedfor 30) min at0°C at pH 3.88 ± ).26 6.9 ± ().1
7.2
Incubated for 1h at 20'C 1.46 + ).46 5.2 + 0).4 Incubated for 1t)min at37°C 1.28 ± 0.22 5.1 -- 0.3
Incubated for1 hat20°C and then 3.59 +(0.78 6.7 ±(0.4
20 mM NH4CI wasadded
Incubated for 30 min at 37°C and 3.95 ± 1.33 7.0 ± ().5 fixed with paraformaldehyde
atpH 7.0
6
6 6 it
5
"MDCK cells on acover-slipwereadsorbed with FITC-labeled r-osettes
(50,ug/ml) in HANKS-HEPES and treated under the conditions described.
The cells were then treated with pronase (5mg/ml)for20 minat20°C.and the
fluorescence intensityat 520 nm with excitation at 495 nm(1495)and at 450 nm
(1450)wasmeasured. 11.Number of measurements.
corrected fluorescence intensities. 1495/1450. with reference to astandard curve. The standard curve was obtained with FITC-labeled HA rosettes (40 p.g/ml) in 120 mM buffer at various pH values with the same optics (see Fig. 6B).
RESULTS
Kinetics of transport of virus into secondary lvsosomes. FITCdiphosphate-labeled virus was adsorbed onto cells and incubated at 37 or 20°C. After various times the fluorescence intensities of the covering medium and of the cells
solubi-lized in neutral media were measured. Figure 3 shows the time course of increase in the fluorescence intensity.
Thecell-associated fluorescence arose fromvirus that was transported into the secondary lysosomes. and the conjugat-ed dye probewasdephosphorylated there.The viralproteins were probably also digested. but the dye-containing frag-ments remained trapped in the lysosomes or in other intra-cellular vesicles. The extraintra-cellular fluorescence, on the otherhand, can be assigned to the dephosphorylated probe attached to HA and NA fragments excreted after digestion in thesecondary lysosomes. A calmodulin inhibitor. trifluoper-azine. at 20 p.M inhibited the extracellularfluorescence but notthe intracellularfluorescence.
The intracellular fluorescence began to increase after 10 min at37°C. reachedaplateau in 40 to 60min and decreased thereafter.The extracellular fluorescence started to increase a little later (after 20 min at 370C) and kept increasing thereafter. The sum of the intracellular and extracellular fluorescence intensities, which corresponds to the virus particles transported into the secondary lysosomes. amount-ed to 35% after 1 h alnd 55% after 2 h at 37°C of that of the initially adsorbed virus. On the other hand, the increase in the fluorescence intensity at 20C was very slow, negligible after 1 h and only a few percent after 2 h. This is primarily due to the very slow rate of transport to the secondary lysosomes at this temperature, although the rates of endocy-tosis and dephosphorylation in the secondary lysosomes were also slowed. Our previous assay with virus labeled with Tempo-phosphatidylcholine (14) and the present study with FITC-labeled virus (see below) showed that endocytosis into
0
20
4
0
6 0
80
100
120
T I M
E (m
in
)
FIG. 7. Virus replication after incubation for various periods at37°C (@)or20°C (A),followed byincubationat37°C inthe presenceof ammonium chloride. MDCK cells onpetri disheswereadsorbed withvirus (100 PFU percell)and washedat4°C.Two milliliters of HANKS-HEPES (pH 7.4) prewarmed at 37 or20°C was added to the cells and incubated.Attheindicatedtime,40p1of1 Mammonium chloridewas
addedtothe medium (final concentration, 20 mM) and incubatedfor2 h at37or20°C. The medium was then replaced with fresh Eagle minimal essentialmediumcontaining 20mMammoniumchloride,andthe cellswereincubatedfurther for10hat37°C. Virus released into the coveringmedium was assayed byhemagglutinationtitration.Virusyield for incubations in the absence of ammonium chloridethroughoutwas 27hemagglutinating units (HAU) per ml.
on November 10, 2019 by guest
http://jvi.asm.org/
[image:6.612.60.299.92.208.2]MDCKcells does
occur
during 1h at20°C.
Thedephosphor-ylation
rateofFITlC
diphosphate byMDCK cell homogenateat
20°C
was lowered butonly to about40% of that at37°C,
according to the fluorescence assay.
Transport of FITC diphosphate-labeled virus into the secondary lysosomes can also be observed as fluorescent spots inside the cells. Figure 4e through g shows fluores-cence
micrographs
of cells incubated forvarious
periods at 37 or20°C
and then treated with 20 mM ammonium chloride orfixed with 4% paraformaldehyde atneutral pHto raise the internal pH of acidic vacuoles. The fluorescent spots were observable from the cells incubated for 1 h at37°C
(g) but not from the cells incubated for 10 min at37°C
(e) or 1 h at
20°C
(f). consistent with the kinetic assay described above. The fluorescent spots in Fig. 4g appear to be localized near the nuclear periphery, probably in second-arylysosomes.These were nonfluorescentwithoutammonia addition or fixation because of the low inside pH.Kinetics of acidification of virus environments after
endocy-tosis. Cells adsorbed with FITC-labeled virus were incubated at 37 or
20C.
and the fluorescence intensity at 520 nm(A\,
= 495 nm) was measuredat varioustimes. The fluores-cence intensity decreased with time rapidly at37°C
and moreslowly
at20'C(Fig. 5). This decrease can beassigned mainly toacidification
of theviral
environment after endocytosis. Addition of ammonium chloride caused a rapid recovery of the fluorescence: a 25 to 30% increase on addition after 20 min at37°C
and after 1 h at20°C.
Release of the adsorbed virus and excretion of the HA and NA fragments into the medium should also contribute to the loss of cell-associated fluorescence. However, these contributions were small in the experiments shown in Fig. 5. After incubation for 15minat
37°C,
ca. 10% of the total virus was released (14), and the excreted HA fragments amounted to only a few percent (Fig. 3). Incomplete fluorescence recovery on addition of ammo-nia was due at least partly toincomplete
neutralization of endosomal pH. as described below.A large decrease in the fluorescence intensity(50%) after incubation for 10 min at
37°C
or for 1 h at 20'C indicatesacidification
in
endosomescontaining
the endocytosed vi-rus.sinceonly
negligibly small fractions of virus reached thesecondary Iysosomes during
the incubation periods. We estimated the endosomal pH by using FITC-labeled HA rosettes which apparently were endocytosed in the same way as the virus, since the fluorescence intensity followed essentially the sametime course as thatfor the virus (Fig. 5) when incubated with cells at 20 or37°C.
An increase in the fluorescence intensity on addition of ammonia similar to that for virus was also observed (data not shown). Figure 6A shows the fluorescence intensity of FITC-labeled rosettes incubated with cells. After incubation for 1 h at20°C,
1495and the ratio of1495/1450 decreased greatly, corresponding to acidification. The pH value was calculated by the ratio with reference to the standard curve (Fig. 6B). A value of 5.2
+ 0.4 was obtained (Table 1). Before the fluorescence measurements, the cells were treated with pronase to re-move the surface-bound fluorescent label. The pH value after incubation for 10 min at
37°C
was 5.1 + 0.3. Thesevalues should represent the endosomal pH. Ammonia addi-tion rapidly (within 2 min) raised the pH to 6.7 ± 0.4. It is reasonable that the pH value for the cells incubated for 30
min
at37°C
and then fixed at pH 7.0 was estimated as 7.0. ± 0.5.The fluorescence micrographs of FITC-labeled virus after incubation for 10 min at
30°C
or for1 h at20°C
showed a negligible amount of fluorescence (Fig. 4b and d) because ofthe acidic environmentsbut showedstrong fluorescent spots inside the cells on addition ofammonium chloride (Fig. 4a and c). These spots were distributed widely in the cells, in contrast to the nuclear periphery shownin Fig. 4g.
In accord with the results of fluorescence study, an electron microscopic observation of MDCK cells incubated with virus for1 h at 20°C showedvirus particles in electron-lucent vacuoles (probably endosomes) but not in lysosomes
(data not shown).
Virus uncoating in endosomes. Cells adsorbed with virus were incubated at 37 or 20°C for various periods, and ammonium chloride was added. Afterincubation fora total of 2 h. the medium was changed to fresh
Eagle
minimal essential medium containing ammonium chloride, and the incubation was continued for an additional 10 h at37°C.
Production of the virus wasassayed as thehemagglutinating
units of the medium. Figure 7 shows virus reproduction
against incubation time in the absence ofammonium chlo-ride.
Virus reproduction began to occur when the cells were incubated in the absence ofammonia for 5 minat 37°C. The virus yield afterincubation for 10 min at 37°C wasquite close to that yielded after incubation in the absence of ammonia throughout. Virus reproduction at 20°C occurred after incu-bation for 20min in theabsence of ammonia. The virus
yield
after incubation for 1 h was the same asthat for the control. The virus particles were not yet transported into second-ary lysosomes during incubation periods for 10mmn
Cat37°C
(less than 2% of the total virus) or 1 h at 20°C
(0%).
as described above. Therefore. they were in the endosomes and experienced an acidic environment of pH 5.2, which allows rapid envelope fusion at 37°C (6. 14) as well as at 20'C.according to the spin label assay (14). Ammonium chloride raised the pH to 6.7. which does not allow envelope fusion
(6,
14). Virus replication when the cells were incubated for10 min at 37°C or for 1 h at 20°C. followed by incubation in the presence ofammonium chloride for a total of12 h. was almost at the same level as that for the control experiments. These results therefore indicate that virus uncoating occurs in the endosomes.
DISCUSSION
In the previous paper we proposed secondary
lysosomes
as theuncoating site based on a strong correlation between thedependenceofvirus replication onlysosomal pH andthe pH dependence of envelope fusion (14). However, since
lysosomotropic
reagents,
such as chloroquine and ammoni-umchloride, raise theendosomal pH as well as thelysosom-al pH, the previous data do not exclude endosomes as the uncoating site. Nor do the present results exclude
uncoating
in the secondary lysosomes. The present study shows that influenza virus uncoating does occur in the endosomes before reaching the secondary lysosomes and that this uncoating is more relevant to the infection.
Theelectronmicroscopic observations shown in the
previ-ous paper appear to be consistent with the present results. The virus particles were found in coated vesicles after5 min at 37°C and in smooth-surfaced vacuoles (probably endo-somes) and secondary lysosomes after 10 min. Presence of virus particles in electron-lucent vacuoles after 1 h at 20°C but not in lysosomes was observed in the present investiga-tion. After 15 min, regular-shaped virus particles were not
recognizable in the vacuoles and secondary
lysosomes.
probably because the uncoating of virus in endosomes had occurred, in addition to uncoating and degradation in the secondary lysosomes, in that time interval. In the presence
on November 10, 2019 by guest
http://jvi.asm.org/
of chloroquine, however, many virus particles remained inside the vacuoles and secondary lysosomes after 15 min, which is probably due to the failure ofenvelope fusion in the endosomes and lysosomes.
Marsh etal. (7) have recentlystudied the time course and temperature dependence of degradation of Semliki Forest virus, nucleocapsid uncoating, and infection in BHK-21 cells. They found that at 37°C the genome release to the cytosol was detected within 5 to 7 min after endocytosis, whereas delivery of the virus to the secondary lysosomes occurred within 15 to 20 min. At temperatures of 15 to20'C,
thevirus particles were internalized but not delivered to the secondary lysosomes. By combining these data with the occurrence of nucleocapsid uncoating andinfection at20°C, Marsh et al. concluded that penetration occurred in endo-somes. These results obtained on Semliki Forest virus
infection in BHK cells are in good agreement with thoseon influenza virus infection in MDCK cells. A more recent
investigation on mutants of Chinese hamster ovary cells
cross-resistant against diphtheria toxin and viruses (Semliki Forest virus and vesicular stomatitis virus) has shown in-volvement of acidification in endosomes in the penetration of thetoxin and the viruses (9).
ACKNOWLEDGMENT
Weexpress our sincere thanks to Shohei Yamashinaforelectron microscopy.
LITERATURE CITED
1. Helenius, A., J.Kartenbeck, K. Simons, and E. Fries. 1980. On theentryof SemlikiForest virusintoBHK-21cells.J.CellBiol. 84:404-420.
2. King, E. J., and T. F. Nicholson. 1937. The preparation of phenylphosphoric esters. Biochem. J. 33:1182-1184.
3. Lowry, 0.H., N. J.Rosebrough,A. L.Farr, and R. J. Randall.
1951. Protein measurement with Folinphenolreagent. J. Biol. Chem. 193:265-275.
4. Maeda,T.,A.Asano,K.Ohki,Y.Okada,andS.Ohnishi. 1975. A spin label study offusion of red blood cells induced by hemagglutinating virusofJapan. Biochemistry 14:3736-3741. 5. Maeda, T., K. Kawasaki, andS. Ohnishi. 1981. Interaction of
influenza virus hemagglutinin withtargetmembrane lipids isa
keystepinvirus-inducedhemolysisand fusionatpH5.2. Proc. Natl. Acad.Sci. U.S.A.78:4133-4137.
6. Maeda, T.,andS. Ohnishi. 1980. Activationof influenza virus byacidic mediacauses hemolysisand fusion oferythrocytes. FEBSLett. 122:283-287.
7. Marsh, M., E. Bolzau, and A. Helenius. 1983. Penetration of Semliki Forest virus from acidic prelysosomal vacuoles. Cell 32:931-940.
8. Maxfield, F. R. 1982. Weak bases and ionophores rapidlyand reversibly raisethepH of endocyticvesiclesin culturedmouse
fibroblasts.J. CellBiol. 95:676-681.
9. Merion, M.,P.Schlesinger,R. M.Brooks,J. M. Moehring, T.J. Moehring, and W. S. Sly. 1983. Defective acidification of endosomes in Chinese hamster ovary cell mutants
"cross-resistant"totoxins andviruses.Proc. Natl. Acad.Sci. U.S.A. 80:5315-5319.
10. Ohkuma, S.,and B. Poole. 1978. Fluorescence probe
measure-mentofintralysosomal pHinlivingcells andperturbationofpH byvarious agents. Proc. Natl. Acad. Sci. U.S.A.75:3327-3331. 11. Sato, S. B., K. Kawasaki, and S. Ohnishi. 1983. Hemolytic activityofinfluenza virushemagglutinin glycoproteinsactivated in mildly acidic environments. Proc. Natl. Acad. Sci. U.S.A. 80:3153-3157.
12. Tycko, B., and F. R. Maxfield. 1982. Rapid acidification of endocytic vesicles containing cx-macroglobulin. Cell 28:643-651.
13. White,J., and A. Helenius. 1980.pH-dependent fusion between theSemliki Forest virusmembraneandliposomes. Proc. Natl. Acad. Sci. U.S.A. 77:3273-3277.
14. Yoshimura, A., K. Kuroda, K. Kawasaki, S. Yamashina, T. Maeda,andS.Ohnishi. 1982.Infectious cell entry mechanism of influenza virus. J.Virol. 43:284-293.