Measuring eco-intensity in a multi-tier food supply
chain: a case study
Andrea Tuni ([email protected])
Department of Design Manufacture and Engineering Management, University of Strathclyde, 75 Montrose Street, G1 1XJ, Glasgow, United Kingdom
Athanasios Rentizelas
Department of Design Manufacture and Engineering Management, University of Strathclyde, 75 Montrose Street, G1 1XJ, Glasgow, United Kingdom
Abstract
Organisations are facing increasing pressure from stakeholders to lower the environmental impact of their company and their supply chain. However, green supply chain management research has mostly focused on direct suppliers, with limited consideration of further upstream supplier tiers. This work aims to demonstrate the applicability of an innovative method to assess the eco-intensity of multi-tier supply chains, which adopts an indirect approach recognising the pivotal role of direct suppliers. Results from a single case study in a food supply chain show that the recursive method is effective in supporting environmental performance assessment of the whole supply chain.
Keywords: Eco-intensity, Multi-tier green supply chain management, Performance assessment
Introduction
Literature review
Eco-intensity and eco-efficiency of supply chains
Eco-efficiency and eco-intensity combine the environmental and economic dimensions of sustainability in a unique index. The Organisation for Economic Co-Operation and Development defines eco-efficiency as “the efficiency with which ecological resources are used to meet human needs”(WBCSD, 2000). Eco-efficiency is mathematically expressed as the ratio of the economic value created and the sum of environmental pressures generated by an economic activity. Eco-intensity is the reciprocal value of eco-efficiency, being the ratio of the environmental impact and the economic benefit generated by an economic activity (Schmidt and Schwegler, 2008). Both concepts of eco-efficiency and eco-intensity are applicable to any industry since they adopt the economic benefit as the reference unit to generate relative environmental indicators. Moreover, they are applicable to different systems, including supply chains. Schmidt and Schwegler (2008) observed that eco-intensity is more suitable to the supply chain context from a mathematical perspective due to the positioning of environmental values at the numerator, which simplifies calculations when multiple organisations are involved.
Despite this observation, the eco-intensity supply chain literature is limited to few examples, such as Schmidt and Schwegler's (2008) recursive method to calculate the eco-intensity of a company including its entire supply network and the work on supply chain water eco-intensity by Joa et al. (2014). On the other hand, the eco-efficiency supply chain literature is more abundant in size, with pieces of work addressing different supply chain extents and offering support to different managerial decisions. Tseng et al. (2013) and Mahdiloo et al. (2015) adopted eco-efficiency scores to select and evaluate suppliers and naturally limited their attention to 1st tier suppliers in their works. The supplier selection and evaluation problem was expanded to additional supply chain members by Wu and Barnes (2016), that combined it with the green lot sizing problem, adopting eco-efficiency to evaluate different supply chain structures. Similarly Colicchia et al. (2015) also addressed different supply chain configurations, introducing an eco-efficient optimisation of the distribution network, whereas Quariguasi Frota Neto et al. (2009) focused on the reverse chain in the WEEE sector. Finally, Charmondusit et al. (2014) added the social dimension to the eco-efficiency concept, creating a socio-eco-efficiency index for the toy industry.
Other authors removed the constraints of focusing on a limited portion of the supply chain by adopting a lifecycle perspective. Examples include Michelsen and Fet (2010) and Michelsen et al. (2006) that adopted life cycle assessment and life cycle costing as the eco-efficiency determinants in their work on the furnishing sector. On the other hand, Saling et al. (2002) developed a different method, which also aims to obtain an aggregated eco-efficiency index and is applied to a dyeing supply chain of blue jeans. However, despite trying to adopt a lifecycle perspective suitable for extended supply chains, these works adopt focal company-centered life cycle assessment for their analysis, which does not offer the granularity level to spot differences in the environmental performance of supply chains with similar design but different suppliers and does not address the challenges of the multiple-organisation nature of supply chains.
Multi-tier green supply chain management
pushing organisations to specialise on a narrower core business and outsourcing other processes to different companies (Mena et al., 2013). The increased number of tiers in the supply chain diminished the visibility and traceability of companies over their supply chain as organisations are less knowledgeable about their upstream activities (Acquaye et al., 2014; Michelsen and Fet, 2010). Visibility of the supply chain is limited to 1st tier suppliers in 50%
of the cases as surveys report, thus limiting the understanding of the upstream network by supply chain executives (Egilmez et al., 2014; O’Rourke, 2014). The limited amount of information about the sub-suppliers poses potential threats to the organisational image and can cause economic losses: scandals affected in the past companies such as Nike, Zara, Unilever or Nestlé due to social or environmental misconduct of their sub-suppliers (Miemczyk et al., 2012; Vachon and Mao, 2008; Wilhelm et al., 2016). Despite not being directly involved in any unsustainable practice, the focal companies were held responsible for the misconduct by consumers, as their prominent role within the supply chain was recognised (Gimenez and Tachizawa, 2012).
The drawbacks of an approach limited to 1st tier suppliers appear particularly severe in a
sustainability perspective. Therefore, scholars developed a number of approaches for the focal companies to deal with the sub-suppliers located beyond the 1st tier suppliers. Mena et al. (2013) distinguished between closed and open triad structures based on the existence of a direct contact between the focal company and the 2nd tier supplier, suggesting that a direct contact is necessary to influence key product characteristics. Tachizawa & Wong (2014) introduced a conceptual framework with four alternative sustainable supply chain management (SSCM) approaches a focal firm can adopt to relate to lower-tier suppliers: “don’t bother”, “working with third parties”, “indirect” and “direct”. These approaches can be considered applicable also to green supply chain management (GSCM), which is considered a sub-set of SSCM. The “indirect” approach is pursued through direct suppliers that are responsible to reach out indirect suppliers and involve them in the sustainability aspects. This approach is expanded in the work by Wilhelm et al. (2016) that focuses on the pivotal role played by suppliers at any level of the supply chain in disseminating sustainability in their upstream supply chain, claiming that other approaches are substantially inapplicable due to the limited control of the focal company on sub-suppliers. Recognising the key role played by suppliers, this paper adopts the “indirect” approach to multi-tier GSCM. More specifically, it deploys the “indirect” approach to the specific field of GSCM performance measurement, aiming to demonstrate the applicability of an innovative method to assess the eco-intensity of multi-tier supply chains through a single case in the food industry, adopting real life data.
Methodology Single case study
allow obtaining an in-depth knowledge about the case under analysis and “to explore the previously unexplored subject”, which is in this case the applicability of the method in an operating context (Genovese et al., 2013; Yin, 2003). It can thus be inferred that the case study is functional to validation purposes (Yin, 2003). Moreover, the case study is helpful in enhancing the understanding of the usefulness of the results obtained in terms of performance improvement for both the focal company and other supply chain tiers.
Data collection was performed between September 2017 and December 2017. Being the case study used primarily for validation purposes, data collection included mainly collection of relevant primary data to test the method in an operating context. Both environmental and economic data refer to year 2016. Collection of quantitative data was complemented by additional information collected from the relevant managers of the organisations. This information was necessary to identify the boundaries of the supply chain and to obtain a more complete overview of the supply chain operations, which facilitated the implementation of the method in the supply chain.
Implementation of the method
Following previous work by the authors, the method was implemented in the single case study according to the following steps (Tuni and Rentizelas, 2017a, 2017b):
1. Definition of system boundaries: boundaries of the supply chain were defined according to the transformed resources concept, following interviews with the relevant managers. 2. Selection of environmental indicators: six environmental impact areas were selected,
which tackle the most critical areas in terms of environmental impacts according to the managers of the supply chain. Theconsultation with the managers was also functional to verify requirements of data availability, data accuracy and completeness in the application of the model. The selected impact areasare:
Land occupation [m2]: the surface covered by the premises of the companies part of the supply chain.
Water consumption [m3]: the overall water consumption by the companies part of the supply chain.
Energy consumption [kWh]: the overall energy consumption by companies part of the
supply chain, including electrical energy, thermal energy and chemical energy.
Emissions to air [kg CO2 e]: this indicator tackles specifically greenhouse gas
emissions. Scope 1 (direct emissions) and Scope 2 (indirect emissions due to electricity consumption) emissions are included in the analysis. Scope 3 emissions are omitted from the analysis, as the supply chain dimension is addressed by the method through the recursive mechanism. CO2 captured by each supply chain member due to their
activity (e.g. emissions captured by plants) is not accounted in the analysis. Solid waste (recycled) [kg]: the solid waste produced, which is sent to recycling. Solid waste (non-recycled) [kg]: the solid waste produced, which is disposed of. 3. Inclusion of the economic dimension: each organisation’s turnover and the share of the
turnover generated by the specific product supply chain are included allowing calculating the eco-efficiency at the company level.
5. Application of the recursive mechanism: the recursive mechanism kicks-off allowing passing the eco-intensity indicators from one tier of the supply chain to the next one downstream until the eco-intensity of the supply chain of the product is calculated.
Case study
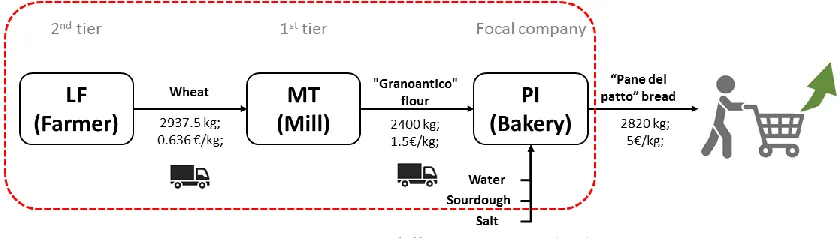
[image:5.612.93.513.432.551.2]The “Patto della Farina” supply chain is a collaborative supply chain based in Friuli Venezia Giulia region, Italy. It operates in the “Food products” industry and the final product delivered to the customer is bread. The specific bread produced through this supply chain is clearly identified to the final customer by the brand “Pane del Patto”, which guarantees on its origin as well as on the traceability of the raw product and of the product transformation practices from the raw material stage throughout to the final product. The branding of the bread is part of a wider strategy of the supply chain, which has at its heart a strong focus on sustainability. The “Pane del Patto” bread is one of the many products offered by the focal company and the following analysis focuses only on this product and its supply chain. The supply chain is linear and consists of three organisations, as depicted in Figure 1. The focal firm PI produces and distributes the bread to the customers, starting from the flour acquired from the 1st tier supplier MT. Flour is produced by MT starting from wheat, which is the raw material that is sourced from the 2nd tier supplier LF. The core activity of LF is the cultivation of wheat along with other cereals and crops. The organisations building the supply chain can be considered micro enterprises according to European Union as they employ fewer than 10 people and their annual turnover does not exceed EUR 2 million. The transportation between the supply chain tiers is made by truck. Although supply chain members have a strong focus on sustainability, this is the only viable transportation option due to the low volumes and short distances involved.
Figure 1 – “Patto della Farina” supply chain
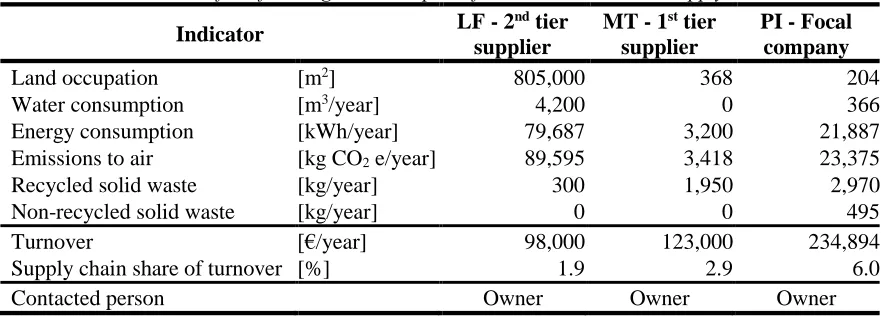
The key information on the organisations part of the supply chain are presented in Table 1. These include the environmental profile of the organisations, their key economic indicators and the person contacted to obtain additional information on the supply chain operations. All figures are on a yearly basis.
Table 1 – Profile of the organisations part of “Patto della Farina” supply chain
Indicator LF - 2
nd tier supplier
MT - 1st tier supplier
PI - Focal company
Land occupation [m2] 805,000 368 204
Water consumption [m3/year] 4,200 0 366
Energy consumption [kWh/year] 79,687 3,200 21,887
Emissions to air [kg CO2 e/year] 89,595 3,418 23,375
Recycled solid waste [kg/year] 300 1,950 2,970
Non-recycled solid waste [kg/year] 0 0 495
Turnover [€/year] 98,000 123,000 234,894
Supply chain share of turnover [%] 1.9 2.9 6.0
Contacted person Owner Owner Owner
Results & Discussion
The method offers three main outputs, which are the eco-intensity indicators at the company level (Table2), the eco-intensity indicators at the supply chain level (Table 3) and the environmental impact allocated to final product (Table 4). This last output is calculated from the eco-intensity indicators at the supply chain level and is here referred as the ‘environmental backpack’ of the product.
[image:6.612.85.527.516.647.2]The eco-intensity indicators at the company level provide a unique reference unit for all companies and environmental indicators, transforming the absolute values of Table 1 into relative values that are comparable across different organisations. However, a comparison between the values of different eco-intensity indicators is not meaningful as different units of measurement are used to calculate the environmental numerator of the indicator.
Table 2 – Eco-intensity indicators at the company level
Eco-intensity indicators
Eco-intensity performance 2nd tier supplier
LF
1st tier supplier
MT
Focal company PI
Land occupation [m2/€] 8.214 0.003 0.001
Water consumption [m3/€] 0.043 0.000 0.002
Energy consumption [kWh/€] 0.813 0.026 0.093
Emissions to air [kg CO2 e/€] 0.914 0.028 0.100
Recycled solid waste [kg/€] 0.003 0.016 0.013
Non-recycled solid waste [kg/€] 0.000 0.000 0.002
sub-suppliers, calling for an effective multi-tier supply chain assessment. Neglecting this impact and limiting the assessment to the 1st tier supplier would lead to a significant underestimation of the overall eco-intensity of the supply chain of the final product. Finally, it is interesting to point out that some companies have zero impact in certain indicators, such as MT in water consumption and both LF and MT in non-recycled solid waste.
[image:7.612.106.505.308.409.2]The eco-intensity indicators at the supply chain level, which are calculated through the recursive mechanism outlined in Tuni and Rentizelas (2017b), are depicted in Table 3. These values represent the eco-intensity of the extended multi-tier supply chain with respect to each environmental impact and are the main output of the assessment of the supply chain environmental performance. The last column of Table 3 shows the increase of the eco-intensity values at the supply chain level compared to the focal company eco-eco-intensity values omitting the environmental backpack from the supply chain. The values demonstrate that the eco-intensity would be significantly underestimated and potentially mislead managers on the environmental impact areas to tackle.
Table 3 – Eco-intensity indicators at the supply chain level
Product: “Pane del Patto” bread ∆ without env. backpack
Land occupation [m2/€] 1.086 108500 %
Water consumption [m3/€] 0.007 250 %
Energy consumption [kWh/€] 0.207 123 %
Emissions to air [kg CO2 e/€] 0.227 127 %
Recycled solid waste [kg/€] 0.017 31 %
Non-recycled solid waste [kg/€] 0.002 0 %
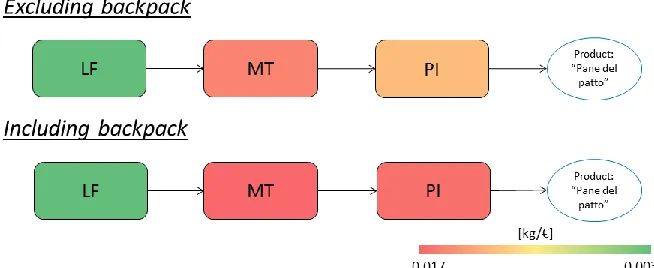
Figure 2 – Recycled solid waste eco-intensity, excluding and including environmental backpack
[image:7.612.147.474.442.576.2]Tracing back the highest eco-intensity values in the supply chain identifies the most interesting opportunities for effective environmental performance improvement, thus offering guidance to implement operational improvements. Following the outcomes from Figure 2 and the identification of the 1st tier supplier as the hotspot for recycled solid waste, MT identified a potential to improve the environmental performance by installing additional container bins for wheat and flour at the facility. These would substitute the current paper packaging in use, in order to minimise the waste produced.
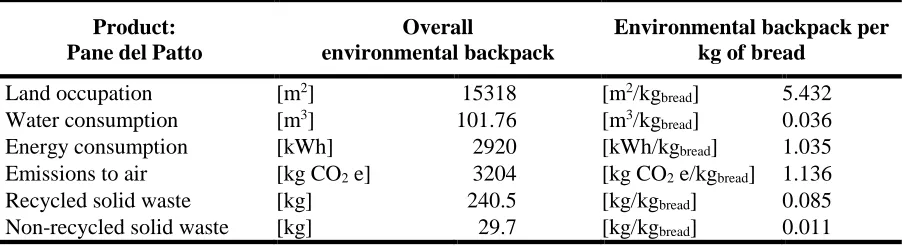
Finally, the environmental backpack associated to the final product is presented in Table 4. The information is presented in two formats: the environmental backpack associated to the entire yearly production of the final product and the environmental backpack associated to one kilogram of “Pane del Patto” bread produced, which is the typical unit the bread is priced at, thus introducing an alternative reference unit for the environmental impact. Although the methodology adopted differs significantly, the value of 1.136 kg CO2 e/kgbread is comparable
[image:8.612.82.533.319.442.2]in magnitude to the results of an LCA study performed by Kulak et al. (2015) on an Italian bread supply chain adopting similar varieties of wheat as raw material.
Table 4 – Environmental backpack associated to the final product
Product: Pane del Patto
Overall
environmental backpack
Environmental backpack per kg of bread
Land occupation [m2] 15318 [m2/kg
bread] 5.432
Water consumption [m3] 101.76 [m3/kg
bread] 0.036
Energy consumption [kWh] 2920 [kWh/kgbread] 1.035
Emissions to air [kg CO2 e] 3204 [kg CO2 e/kgbread] 1.136
Recycled solid waste [kg] 240.5 [kg/kgbread] 0.085
Non-recycled solid waste [kg] 29.7 [kg/kgbread] 0.011
Conclusion
Implications for researchers
This work introduced one of the first examples of multi-tier green supply chain management performance measurement adopting real life data from an operating context. The case study demonstrated the applicability of an indirect approach to assess the supply chain environmental performance adopting an innovative method, which is based on a recursive mechanism. Although, the application was facilitated in this case study by the collaborative nature of the supply chain, which simplified the exchange of information and environmental data between supply chain members, the recursive indicators proved to be effective in cascading the environmental performance from upstream suppliers down to the focal company. This was noticeable, considering that all companies building the supply chain are micro enterprises that cannot allocate dedicated resources to sustainability management. The collection of data at the company level proved to be beneficial in this respect, as most data were available in the information systems of companies. The case study also demonstrates the potential for large scale application of the method in small and medium enterprises, which are currently lagging behind in the path towards sustainability (Yusuf et al., 2013).
that a decentralised approach is feasible and that focal companies do not need to take control of the entire assessment process but can share this burden with their 1st tier suppliers that play a key role as the gateway to the upstream supply chain. The simple design and limited depth of the supply chain eased the process in the case study, but are to be considered as a starting point for future application, where the issue of limited visibility is more severe and relying on direct business partners is the only feasible way to obtain a supply chain wide environmental assessment (Wilhelm et al., 2016).
Implications for practitioners
The successful application of the method demonstrated the utility of the method in an operating context for several purposes. Firstly, the method showed a straightforward applicability for external reporting, both at the company level and at the product level. The outputs provided offer the opportunity to easily communicate results of sustainable strategies to the customer. Secondly, the method provided effective support in identifying the hotspots along the supply chain. Although the core businesses of the companies differ, the unique economic reference unit provides directions on where operational improvements would be more effective to diminish the overall supply eco-intensity. Finally, the eco-intensity indicators both at the company level and at the supply chain level can become an additional source to inform the sustainable strategy of the supply chain, being applicable for longitudinal benchmarking as well as to drive future improvements.
Limitations and future research directions
A number of limitations of this research need to be mentioned. First, the case study demonstrated that the method is prone to some underestimation or overestimation of certain environmental impacts due to the specific methodology adopted. Since the assessment of the environmental impacts is performed at the company level and then allocated to products on the basis of their economic value, certain products might carry an environmental quota they are not responsible for. As an example, this appeared in the case study in the case of water consumption. The hotspot for water eco-intensity in the supply chain is located at 2nd tier
supplier LF, however the farmer revealed that no water is used for the wheat crop according to the conservative agriculture techniques. The use of water for different crops affects though the calculations of the eco-intensity of the final product as well.
Additionally, the use of coefficients was necessary in certain instances to convert some environmental data to the same units of measurement and to provide outputs in a standardised format. Different practices in the recording of environmental performances caused this issue, e.g. waste recorded in volume or weight, depending on the organisations. Although the additional assumptions do not significantly affect the results, they do increase the uncertainty of the outputs. A standardised data collection process would solve this issue.
References
Acquaye, A., Genovese, A., Barrett, J. and Koh, S.C.L. (2014), ‘Benchmarking carbon emissions performance in supply chains’, Supply Chain Management: An International Journal, Vol. 19 No. 3, pp. 306–321.
Brandenburg, M., Govindan, K., Sarkis, J. and Seuring, S. (2014), ‘Quantitative models for sustainable supply chain management: Developments and directions’, European Journal of Operational Research, Elsevier B.V., Vol. 233 No. 2, pp. 299–312. Charmondusit, K., Phatarachaisakul, S. and Prasertpong, P. (2014), ‘The quantitative eco-efficiency measurement for small and medium
enterprise: A case study of wooden toy industry’, Clean Technologies and Environmental Policy, Vol. 16 No. 5, pp. 935–945. Colicchia, C., Creazza, A., Dallari, F. and Melacini, M. (2015), ‘Eco-efficient supply chain networks: development of a design
framework and application to a real case study’, Production Planning & Control, Vol. 7287 No. November, pp. 1–12.
Dou, Y., Zhu, Q. and Sarkis, J. (2017), ‘Green multi-tier supply chain management: An enabler investigation’, Journal of Purchasing and Supply Management, Elsevier Ltd, pp. 1–13.
Easterby-Smith, M., Thorpe, R. and Jackson, P. (2012), Management Research, Sage, London.
Egilmez, G., Kucukvar, M., Tatari, O. and Bhutta, M.K.S. (2014), ‘Supply chain sustainability assessment of the U.S. food
manufacturing sectors: A life cycle-based frontier approach’, Resources, Conservation and Recycling, Elsevier B.V., Vol. 82, pp. 8–20.
Genovese, A., Lenny Koh, S.C., Kumar, N. and Tripathi, P.K. (2013), ‘Exploring the challenges in implementing supplier environmental performance measurement models: a case study’, Production Planning & Control, Vol. 7287 No. July 2014, pp. 1–14.
Gimenez, C. and Tachizawa, E.M. (2012), ‘Extending sustainability to suppliers: a systematic literature review’, Supply Chain Management: An International Journal, Vol. 17 No. 5, pp. 531–543.
Hartmann, J. and Moeller, S. (2014), ‘Chain liability in multitier supply chains? Responsibility attributions for unsustainable supplier behavior’, Journal of Operations Management, Elsevier B.V., Vol. 32 No. 5, pp. 281–294.
Joa, B., Hottenroth, H., Jungmichel, N. and Schmidt, M. (2014), ‘Introduction of a feasible performance indicator for corporate water accounting – a case study on the cotton textile chain’, Journal of Cleaner Production, Elsevier Ltd, Vol. 82, pp. 143–153. Krikke, H. (2011), ‘Impact of closed-loop network configurations on carbon footprints: A case study in copiers’, Resources,
Conservation and Recycling, Elsevier B.V., Vol. 55 No. 12, pp. 1196–1205.
Kulak, M., Nemecek, T., Frossard, E., Chable, V. and Gaillard, G. (2015), ‘Life cycle assessment of bread from several alternative food networks in Europe’, Journal of Cleaner Production, Vol. 90, pp. 104–113.
Mahdiloo, M., Saen, R.F. and Lee, K.H. (2015), ‘Technical, environmental and eco-efficiency measurement for supplier selection: An extension and application of data envelopment analysis’, International Journal of Production Economics, Elsevier, Vol. 168, pp. 279–289.
Mena, C., Humphries, A. and Choi, T.Y. (2013), ‘Toward a theory of multi-tier supply chain management’, Journal of Supply Chain Management, Vol. 49 No. 2, pp. 58–77.
Michelsen, O. and Fet, A.M. (2010), ‘Using eco-efficiency in sustainable supply chain management; A case study of furniture production’, Clean Technologies and Environmental Policy, Vol. 12 No. 5, pp. 561–570.
Michelsen, O., Fet, A.M. and Dahlsrud, A. (2006), ‘Eco-efficiency in extended supply chains: A case study of furniture production’, Journal of Environmental Management, Vol. 79 No. 3, pp. 290–297.
Miemczyk, J., Johnsen, T.E. and Macquet, M. (2012), ‘Sustainable purchasing and supply management: a structured literature review of definitions and measures at the dyad, chain and network levels’, Supply Chain Management: An International Journal, Vol. 17 No. 5, pp. 478–496.
O’Rourke, D. (2014), ‘The science of sustainable supply chains’, Science, Vol. 344 No. 6188, pp. 1124–1128.
Quariguasi Frota Neto, J., Walther, G., Bloemhof, J., van Nunen, J.A.E.E. and Spengler, T. (2009), ‘A methodology for assessing eco-efficiency in logistics networks’, European Journal of Operational Research, Elsevier B.V., Vol. 193 No. 3, pp. 670–682. Saling, P., Kicherer, A., Dittrich-Krämer, B., Wittlinger, R., Zombik, W., Schmidt, I., Schrott, W., et al. (2002), ‘Eco-efficiency analysis
by BASF: the method’, The International Journal of Life Cycle Assessment, Vol. 7 No. 4, pp. 203–218.
Schmidt, M. and Schwegler, R. (2008), ‘A recursive ecological indicator system for the supply chain of a company’, Journal of Cleaner Production, Vol. 16 No. 15, pp. 1658–1664.
Tachizawa, E.M. and Wong, C.Y. (2014), ‘Towards a theory of multi-tier sustainable supply chains: a systematic literature review’, Supply Chain Management: An International Journal, Vol. 19 No. 5/6, pp. 643–663.
Tseng, M.-L., Tan, K.-H., Lim, M., Lin, R.-J. and Geng, Y. (2013), ‘Benchmarking eco-efficiency in green supply chain practices in uncertainty’, Production Planning & Control, Vol. 7287 No. July 2014, pp. 1–12.
Tuni, A. and Rentizelas, A. (2017a), ‘Measuring the eco-intensity of the supply chain : a novel approach’, 4th International EurOMA Sustainable Operations and Supply Chains Forum, Milan, pp. 1–10.
Tuni, A. and Rentizelas, A. (2017b), ‘Benchmarking the environmental performance of supply chains through eco-intensity’, 24th EurOMA Conference, Edinburgh, pp. 1–10.
Vachon, S. and Mao, Z. (2008), ‘Linking supply chain strength to sustainable development: a country-level analysis’, Journal of Cleaner Production, Vol. 16 No. 15, pp. 1552–1560.
WBCSD. (2000), Eco-Efficiency. Creating More Value with Less Impact, World Business Council for Sustainable Development. Wilhelm, M.M., Blome, C., Bhakoo, V. and Paulraj, A. (2016), ‘Sustainability in multi-tier supply chains: Understanding the double
agency role of the first-tier supplier’, Journal of Operations Management, Elsevier Ltd, Vol. 41, pp. 42–60.
Wu, C. and Barnes, D. (2016), ‘An integrated model for green partner selection and supply chain construction’, Journal of Cleaner Production, Elsevier Ltd, Vol. 112, pp. 2114–2132.
Yin, R.K. (2003), Case Study Research: Design and Methods, Sage Publications, Sage Publications, Thousand Oaks, available at:https://doi.org/10.1097/FCH.0b013e31822dda9e.